Simulation of the prestress in a Representative Structural Volume of a French
1450 MWe containment building
Ludovic Jason1, Shahrokh Ghavamian2, Alexis Courtois3, Lucian Illie4
1
CEA SACLAY, DEN / DANS / DM2S / SEMT / LM2S, Gif sur Yvette, France 2 EDF R&D, Clamart, France
3
EDF SEPTEN, Villeurbanne, France 4
Labora Consulting, Le Chesnay, France
ABSTRACT
The behavior of a Representative Structural Volume for containment buildings of 1450 MWe nuclear power plants is studied. Computations give information about the global behavior of the structure (deformation, evolution of the mechanical behavior as a function of the internal pressure during the simulation), about the failure mode and finally underline the role of the prestress. The ducts may be responsible, well above the dimensioning pressure (hypothetic loading), for local effects that have to be studied carefully. Two modeling are compared for the cables, using either bar or three dimensional elements. The impact on the damage distribution is analyzed.
INTRODUCTION
In high-power French nuclear power plants (1300 and 1450 MWe), the concrete containment vessel represents the third passive safety barrier and is supposed to prevent leakage in case of accidents (figure 1). That is why it is carefully monitored. Integrity tests, consisting in an internal pressure inside the structure, are carried out every ten years to check the leakage rate (if any). As the gas transfer through concrete is directly influenced by the mechanical degradation [1] and as experiments can be hardly carried out because of the difficult environmental conditions, numerical studies remain the most convenient way to understand the degradation process. That is why, for the last decade, several important civil engineering research and development programs have been launched and dedicated to the analysis of prestressed pressure containment vessel (PCCV) reactor building. These concern the elaboration of new constitutive laws for concrete, techniques of modelling and resolution algorithms. The validity of the models (damage [2] and/or plasticity [3], fracture [4]…) must be obtained by comparing their performances with experimental results (benchmarking [5] for example).
Concrete external
containment vessel
Concrete internal
containment vessel
Containment vessel of
the reactor core
Fuel cladding
Concrete external
containment vessel
Concrete internal
containment vessel
Containment vessel of
the reactor core
Fuel cladding
Figure 1. Barriers of a 1300 or 1450 MWe nuclear power plant.
The validation is generally obtained from simple tests on small size specimen, where elementary features of models are qualified. But more complex tests are also essential to determine the capacity of the calculations to predict the structural behaviour of more realistic and industrially representative cases.
REPRESENTATIVE STRUCTURAL VOLUME
The application presented in this contribution starts from a test proposed by Electricité de France in 2002 (Jason et al, in press). The test, named PACE 1300 was a Representative Structural Volume of a PCCV of a French 1300 MWe nuclear power plant. At first, the structure was considered as a mere numerical tool to investigate the ability of constitutive laws to be applied on an industrial test. But unknowns about the role of the pretensioned tendons and mesh dependency problems finally proved clearly that an experimental validation was necessary. That is why a new test was designed to validate, first qualitatively, then quantitatively, the tendencies that were observed trough the parametric studies. Details can be found in [7].
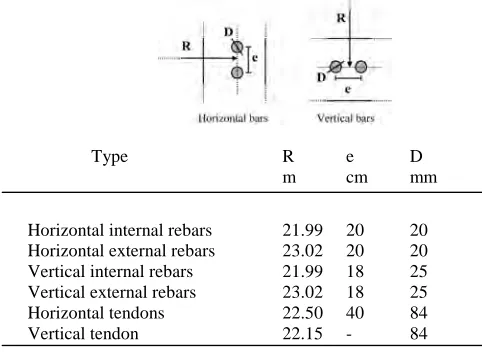
This contribution presents the conclusions of the preliminary simulations. The aim is to study a Representative Structural Volume of a containment building of a 1450 MWe nuclear power plant. Figure 2 illustrates the position of the model within the entire PCCV. The model incorporates all components of the real structure : concrete, vertical and horizontal reinforcement bars and pretensioned tendons in horizontal and vertical directions. The size of the RSV is chosen to respect three conditions: large enough to include a sufficient number of components (especially prestressed tendons) and to offer a significant observation area in the center, far enough from boundary conditions, while remaining as small as possible to ease computations. The RSV includes 9 horizontal and 11 vertical reinforcement bars (on both internal and external faces), 4 horizontal and 1 vertical prestressed tendons. Hoops are not represented in order to simplify the model. The geometry of the problem is given in figure 3. Table 1 provides information about the steel distribution and properties.
Figure 2. Position of the Representative Structural Volume within the entire containment building
θθθθ=0.0889 rad R=22.50 m
h=1.8 m
e = 1.2 m s=2m
θθθθ=0.0889 rad R=22.50 m
h=1.8 m
e = 1.2 m s=2m
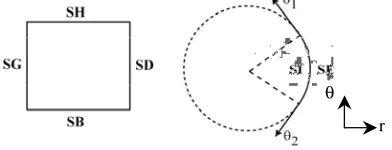
Figure 3. Dimensions of the Representative Structural Volume.
Figure 4. Definition of the finite element model indicating the boundary SG, SD, SH, SB, SE and SI. r
θ
Table 1. Properties of passive rebars and prestressed tendons.
Type R e D
m cm mm
Horizontal internal rebars 21.99 20 20 Horizontal external rebars 23.02 20 20 Vertical internal rebars 21.99 18 25 Vertical external rebars 23.02 18 25 Horizontal tendons 22.50 40 84 Vertical tendon 22.15 - 84
The following boundary conditions have been chosen for the simulation: face SB is blocked along the vertical direction and no rotations are allowed for faces SG and SD to keep the angular distance constant (figure 4). In order to model the effect of the prestress, bar elements are anchored to faces SG and SD, then prestressed using internal forces. They are restrained to surrounding concrete elements to represent the prestressing technology applied in French PPCVs. It is to be noted that the vertical tendon is only cast, in this particular application, to maintain the global rigidity of the structure and will not be pretensioned. Instead, a compressive homogeneous pressure of 1MPa is applied on SH.
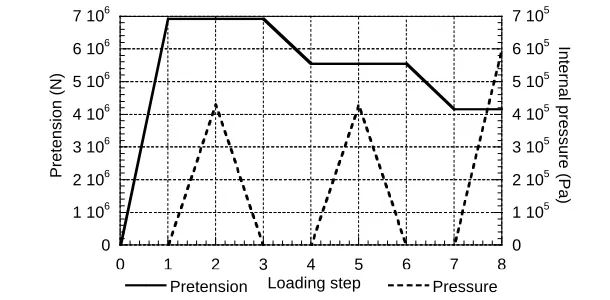
The integrity test loading is represented by a radial pressure on the internal face SI. For the sake of simplicity, the effect of gravity is not considered. Boundary conditions and loading are summarized in figure 5. In order to take into account the ageing process, different loadings are considered with a decrease in the initial pretension (from 100% to 60% of the initial value). Figure 6 illustrates the evolution of the prestress and of the internal pressure during the simulation. The last loading consists in an increasing internal pressure until the collapse of the Representative Structural Volume and well above the dimensioning pressure (hypothetic loading).
MECHANICAL BEHAVIOUR
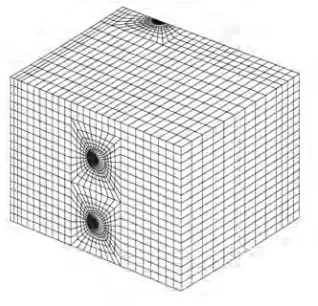
Figure 7 provides the internal pressure applied on the volume as a function of the radial displacement of a point located at the bottom right of the internal face. The simulations are carried out with the elastic damage law developed in its initial form by Mazars (1984), using the finite element code Cast3M [8]. Due to symmetry conditions, only one fourth of the volume is modeled (figure 8)
The three main loading steps are clearly represented on the figure (increases in the internal pressure). The initial negative displacements, for each step, correspond to the application of the different levels of prestress on the horizontal tendons. This yields a compaction of the volume and due to the boundary conditions (no normal displacement on the lateral faces), it imposes an initial negative displacement (see figure 9).
ND ND
NV
Boundary conditions in displacement ND : zero normal displacement on SG
and SD
NV : zero vertical relation on SB
g PSH
PSH
CS
Boundary conditions in stress PSH : horizontal prestress 6.93 MN (max.) per tendon CS : compressive stress
1 MPa
IP
z
r
Figure 6. Definition of the loading steps for the Representative Structural Volume
The effect of the pretension is also illustrated with an initial displacement that increases with the decrease in the value of the prestress. During the last application of the internal pressure, the curve can be divided in three parts. The initial state corresponds to the application of the prestress as already mentioned. Then, upon application of the internal pressure, there is a zone of linear behavior when the compaction is reduced and the structure returns towards its initial rest position before undergoing tension for higher values of internal pressure. Finally, a partial unloading appears due to heavy cracking of the structure and for which the computation has been stopped. It is to be noted that the maximum value of the pressure is related to this particular test, with particular boundary conditions and can not be generalized to other structures.
Figure 10 presents the damage evolution. Some mechanical degradation appears at the end of the prestress application around the horizontal cables then propagates along the vertical bar, from the top to the bottom of the structure. The two first pressure loadings stay in the elastic regime as no damage develops. But, during the last loading step (internal pressure up to the failure) some localized bands appear on the top face. Their orientations are partly related with the meshing around the vertical tendon and the well known mesh-dependency effect when using softening relations. It could be avoided with some regularization techniques which are out of the topic of this contribution (see [9] or [10] for example). Finally, a zone of heavy damage appears in the center of the volume, along the vertical tendon, at the end of the computation. This test confirms the special role of the pretensionned cables, already mentioned in previous studies.
INFLUENCE OF THE PRESTRESS MODELING
As the ducts seem to play a key role in the development of the mechanical degradation, it has to be studied carefully. That is why two different modeling are compared, the first one using bar elements for the prestressed tendons (as already shown) and the second one 3D elements. The relation between concrete and steel is supposed perfect in both cases.
Figure 7. Radial displacement – internal pressure curve for the Representative Structural Volume
0
1 106
2 106
3 106
4 106
5 106
6 106
7 106
0
1 105
2 105
3 105
4 105
5 105
6 105
7 105
0 1 2 3 4 5 6 7 8
Pretension Pressure
Pre te n s io n (N ) In te rn a l p re s s u re (Pa ) Loading step 0 100000 200000 300000 400000 500000 600000
-0,008 -0,006 -0,004 -0,002 0 0,002 0,004
Radial displacement (m)
Figure 8. Mesh for the Representative Structural Volume. Only one fourth of the structure has been meshed
Figure 9. Radial deflection of the Representative Structural Volume through different steps (schematic). View from the top of the volume.
Figure 10. Damage distributions during loading. Dark zones are the most damaged ones.
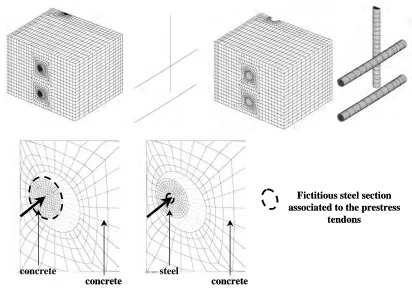
The two simulations only differs in term of cable meshing. In the first case, prestress tendons are only defined by bar elements associated with a fictitious section, equal to the real one, but the neighboring material is concrete. In the second case, the real section of the cables is associated with steel (figure 11).
Prestressing process is adapted to each situation in order to get the same initial stress distribution in both cases. It is to be noted that classical approaches generally use bar elements and do not represent the cables explicitly as their distributions in an industrial application is very complex (meshing limit). The comparison between the two methods on a
Step « zero »
Figure 11. Different modeling for prestress tendons. Figure on the top : concrete / steel meshing when considering bar elements (on the left) or three dimensional elements (on the right). Figure on the bottom (zoom on a
horizontal tendon) : fictitious steel section associated to bar elements (on the left) or three dimensional elements.
Figure 12. Pressure – radial displacement curve for the two modeling.
Figure 12 presents the comparison between the two approaches on the displacement – pressure curve. No relevant differences can be noticed on the global behavior and the choice of the prestress modeling does not seem to have any impact on the mechanical evolution. Especially, the levels of initial radial displacements are the same and the characteristics of the curve are similar (position of the pressure peak, qualitative evolution…).
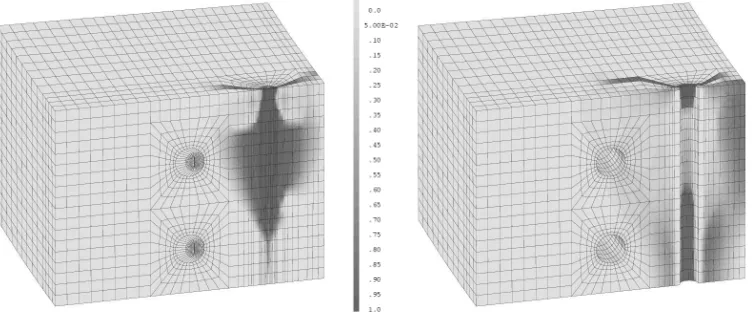
Figure 13 illustrates the damage distribution at the end of both computations. Some clear differences are noticed this time. If damage appears in both cases along the vertical cable (which plays the role of a rigid body in concrete) then propagates on the upper face along localized bands, its distribution at the end of the computation differs. The damage is essentially concentrated around the vertical tendon when a 1d bar element modeling is chosen, whereas some more complex effects appear in the second case.
0 100000 200000 300000 400000 500000 600000
-0,008 -0,006 -0,004 -0,002 0 0,002 0,004
Radial displacement (m)
P
re
s
s
u
re
(
P
a
)
1d 3d
concrete
concrete
concrete
steel
Fictitious steel section
associated to the prestress
tendons
concrete
concrete
concrete
steel
Fictitious steel section
associated to the prestress
Figure 13. Damage distribution for the two modeling at the end of the computation (1d bar elements on the left and three dimensional elements on the right). Dark zones are the most damaged ones.
When 3d elements are used for the tendons, the internal variable localizes on the inner face and an interaction between horizontal and vertical cables is noticed. These differences may be explained by the choice in the modeling. In 3D, the rigid body represented by the vertical tendon is directly, and explicitly, reproduced by the simulation. On the contrary, with bar elements, it is related to a fictitious section as the volume around the prestress 1d bars is associated with concrete. As a conclusion, it seems that the choice of refinement for the modeling of the prestress plays a key role in the distribution of the damage, in the description of the failure mode, and obviously in the associated effects (permeability description as a function of damage for example).
CONCLUSIONS
A representative Structural Volume of a containment building of a 1450 MWe nuclear power plant has been studied. Different steps in the global mechanical behavior have been highlighted (initial negative displacement due to prestress, peak in the pressure…). As far as the local behavior is concerned, the study has underlined the key role which is played by the ducts of the prestressing system for the apparition of local effects under severe loadings. The comparison between two different modeling (classical bar elements preventing from the total meshing of the tendons, or more representative but also more complex three dimensional elements) for the prestress has shown that relevant differences could appear, depending on the chosen meshing. Even if our results are not sufficient, up to now, to conclude about the validity of each method , the question should be reevaluated, especially when experimental results will be available.
REFERENCES
1. Picandet, V., Khelidj, A., Bastian, G., “Effect of axial compressive damage on gas permeability of ordinary and high performance concrete”, Cement and Concrete Research, Vol. 31, 2001, pp. 1525-1532
2. Mazars, J., Application de la mécanique de l’endommagement au comportement non linéaire et à la rupture du béton de structure, PhD thesis, Paris VI University, 1984
3. Jason, L., Huerta, A., Pijaudier-Cabot, G., Ghavamian, S., “An elastic plastic damage formulation for concrete: application to elementary tests and comparison with an isotropic damage model”. Computer Methods in applied Mechanics and Engineering, Vol. 195, 52, 2006, pp. 7077-7092
4. Ngo, D., Scordelis, A.C., “Finite element analysis of reinforced concrete beams”, Journal of the American Concrete Institute, Vol. 64, 1967, pp 152-163
5. Ghavamian, S., Delaplace, A., “Modèles de fissuration de béton – Projet MECA”, Revue Française de Génie Civil, Vol. 7, 2003
6. Jason, L., Pijaudier-Cabot, G., Ghavamian, S., Huerta, A., “Hydraulic behaviour of a Representative Structural Volume for containment buildings”, Nuclear Engineering and Design, in press
7. Jason, L., Ghavamian, S., Courtois A., “Preliminary computations for a Representative Structural Volume of nuclear containment buildings”, Proceeding of FRAMCOS conference, June 2007
8. Cast3M, Description of the finite element code Cast3M, http://www-cast3m.cea.fr
10. Peerlings, R.H.J., De Borst, R., Brekelmans, W.A.M., de Vree, J.H.P., “Gradient enhanced damage for quasi brittle materials”, International journal for numerical methods in engineering , Vol. 39, 1996, pp. 3391-3403