A
Polymerization Model of Chiasma Interference and Corresponding
Computer Simulation
Jeff S. King* and
Robert
K.
Mortimert?*
*Graduate Group in Biophysics, University of California, Berkeley, California 94720, tDepartment of Molecular and Cell Biology, Division of Genetics, University
of
California, Berkeley, Calfornia 94720, and $Division of Cellular and Molecular Biology,Lawrence Berkeley Laboratory, Berkeley, California 94720 Manuscript received April 16, 1990
Accepted for publication August 29, 1990
ABSTRACT
A model of chiasma interference is proposed and simulated on a computer. The model uses random
events and a polymerization reaction to regulate meiotic recombination between and along chromo-
somes. A computer simulation of the model generates distributions of crossovers per chromosome
arm, position of events along the chromosome arm, distance between crossovers in two-event tetrads,
and coincidence as a function of distance. Outputs from the simulation are compared to data from
Saccharomyces cerevisiae and the X chromosome of Drosophila melanogaster. The simulation demon-
strates that the proposed model can produce the regulation of recombination observed in both genetic
and cytological experiments. While the model was quantitatively compared to data from only
Drosophila and Saccharomyces, the regulation observed in these species is qualitatively similar to the
regulation of recombination observed in other organisms.
I
N 1916 MULLER reported that a crossover in one region of a Drosophila chromosome changes the probability of a crossover in an adjacent region(MULLER 19 16). Subsequent work in other eukaryotes
revealed in general a distance-dependent reduction in
the probability of a second crossover, known as posi-
tive chiasma interference. Interference is expressed
in terms of coincidence, which is the ratio of observed
to expected coincident crossovers in two linked re-
gions. Interference has been observed at both the
cytological and genetic levels. For example, coinci-
dence as a function of distance has been measured
genetically in Drosophila melanogaster (WEINSTEIN
19 18) and in Saccharomyces cerevisiae (MORTIMER and
FOCEL 1974). In both organisms, interference is
strong for closely linked regions and falls off with
increasing separation. Cytologically, interference has been examined in terms of coincidence of chiasmata, the cross-shaped associations between homologous chromosomes seen in diakinesis and considered to be
an outcome of genetic exchanges (for review SeeJONES
1984). For example, on the long arm of the L3
bivalent of Chorthzppus brunneus complete interfer-
ence is observed over distances of 25-30% of the
length of the bivalent arm (LAURIE 1980), and no
interference is observed for regions longer than 60%
of the length of the bivalent arm.
Genetic experiments have provided clues to the
relationship between recombination and interference. In
S.
cerevisiae and inD.
malanogaster, roughly one- half of all gene conversions are associated with recip- rocal recombination (HURST, FOCEL and MORTIMER 1972; HILLIKER and CHOVNICK 198 1). In Neurospora(knrtics 126: 1127-1 138 (December, 1990)
and Saccharomyces gene conversions with a genetic crossover show chiasma interference but gene conver- sions without exchange of flanking markers do not interfere with other gene conversions, either with or
without associated crossovers (STADLER 1959; MOR-
TIMER and FOCEL 1974). Chromatid interference, a
deviation from the 1 :2: 1 distribution of 2-, 3-, and 4-
strand double crossovers, is not detected via tetrad
analysis in Saccharomyces (MORTIMER and FOGEL
1974) or in crosses of Drosophila with attached X
chromosomes (EMERSON and BEADLE 1933).
Electron microscopic studies of pachytene synapto- nemal complexes resulted in the discovery of recom-
bination nodules (SCHRANTZ 1970; GILLIES 1972) (for
reviews, see VON WETTSTEIN, RASSMUSSEN and HOLM
1984; CARPENTER 1989). Two types of recombination nodules have been observed. Based on their temporal appearance in meiotic nuclei they have been termed early and late recombination nodules (CARPENTER
1989); however, it has not been established that late recombination nodules arise from early recombina-
tion nodules. T h e demonstration that late recombi-
nation nodules parallel chiasmata in frequency and
distribution has led to the proposal that late recom- bination nodules are directly involved in meiotic re-
combination (CARPENTER 1975). The distributions of
late recombination nodules, chiasmata, and crossovers
are comparable in terms of number per chromosome and positions on chromosome arms. Late recombina- tion nodules have been associated with sites of local-
ized DNA synthesis (CARPENTER 1981), which is be-
lieved to occur during recombination. (For models of
1128 J. S. King and R. K. Mortimer
TABLE 1
Comparison of genome sizes and recombination levels for several organisms
Organism DNA Mb N cM/gen co/biv chi/biv Mb/chr co/Mb SC wn/biv
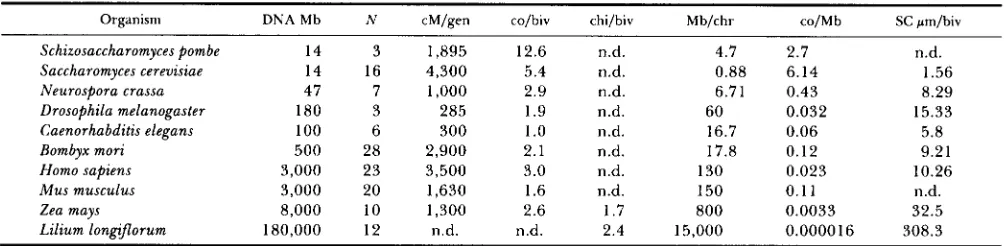
Schizosaccharomyces pombe 14 3 1,895 12.6 n.d. 4.7 2.7
14 16 4,300
Saccharomyces cerevisiae 5.4 n.d. 0.88 6.14 1.56
Neurospora crassa 47 7 1,000 2.9 n.d. 6.71 0.43 8.29
Drosophila melanogaster 180 3 285 1.9 n.d. 60 0.032 15.33
Caenorhabditis elegans 100 6 300 1
.o
n.d. 16.7 0.06 5.8Bombyx mori 500 28 2,900 2.1 n.d. 17.8 0.12 9.21
Homo sapiens 3,000 23 3,500 3.0 n.d. 130 0.023 10.26
Mus musculus 3,000 20 1,630 1.6 n.d. 150 0.1 1 n.d.
Zea mays 8,000 10 1,300 2.6 1.7 800 0.0033 32.5
Lilium long9orum 180,000 12 n.d. n.d. 2.4 15,000 0.0000 16 308.3
n.d.
Amount of DNA in base pairs, number of chromosomes, size of genetic map, and size of synaptonemal complexes. While the organisms listed have radically different amounts of DNA, they are similar in terms of cM per genome and crossovers per bivalent. Data are from: VON
WETTSTEIN, RASSMUSSEN and HOLM (1984), FASMAN (1976), O’BRIEN (1987) and WHITE (1977). Abbreviations: Mb = megabase-pairs, cM = centimorgans, gen = genome, co = crossovers, biv = bivalent, chi = chiasmata, chr = chromosome, SC = synaptonemal complex, N = the haploid number of chromosomes, n.d. = n o data.
and ORR-WEAVER, SZOSTAK and ROTHSTEIN 198 1 .)
For these reasons it is believed that late recombination
nodules, chiasmata and genetic crossovers are all man- ifestations of the same event: reciprocal meiotic re- combination.
Regulation of recombination events is apparent at several levels. T h e number of crossovers per chro- mosome arm was shown to be nonrandom (HALDANE
1931; WEINSTEIN 1936) since, compared to a Poisson
distribution with the same average, the number of
Drosophila X chromosomes with no crossovers was
underrepresented and the number with one or two
crossovers was overrepresented. T h e distributions of late nodules, chiasmata, and crossovers are nonuni- form in terms of position along chromosomes and nonrandom in terms of distances between them. T h e
positions of crossovers along the telocentric X chro-
mosome of Drosophila tend to be centrally located in single crossover tetrads and tend to have one cross-
over near the centromere and the other crossover
near the distal telomere in double crossover tetrads (CHARLES 1938).
Several models have been proposed to account for either interference or the distributions of chiasmata
along chromosomes (for review see JONES 1984).
Some of the models address interference but fail to account for the observed distributions of chiasmata between chromosomes. Others models only address the distributions of chiasmata and do not account for interference. A model of particular interest was pro- posed by EGEL in 1978. EGEL’S model is based on possibilities of exchanges that are established before synapsis and serve as initiation centers of synapsis. Synapsis is then followed by formation of synaptone- mal complex, which prevents the establishment of further possibilities of exchange. This results in posi- tive interference.
Stochastic models, based on recombination sites
with individual crossover probabilities, are notewor-
thy because a growing body of evidence suggests that some DNA sites have much higher recombination rates than other sites. Stochastic models can also be based on a limited supply of a necessary component. Criticisms of stochastic models stem from their inabil- ity to account for interference without additional as- sumptions. Stochastic models based on a small number
of sites are not supported by the fact that in Drosoph-
ila some chromosomal sequences that are moved
adopt the exchange distribution characteristic of the
new location (BAKER and CARPENTER 1972). Further-
more, in Saccharomyces the allelic recombination rate of a DNA sequence varies significantly, depending on
its location in the genome (LICHTEN, BORTS and HA-
BER 1987). It is also clear from fine-scale genetic
analysis that there are many sites at which recombi- nation may occur along a chromosome. However, in any one meiosis, recombination occurs at only a few of these sites.
Other models are based on pairing, in which certain chromosomal regions are assumed to pair first and are therefore more likely to undergo recombination.
However, without additional assumptions this does
not account for either interference or for the observed
distribution of crossovers between chromosomes. Still other models are steric, i.e. the molecules that catalyze recombination events physically block adjacent events. It is difficult to account for the nonrandom distribu-
tion of events between chromosomes with these
models, and based on electron micrographs, it is dif-
ficult to explain how a few nodules that are small
relative to the length of the synaptonemal complex
could have such a strong effect on each other. Another
criticism is that the source of the steric interference would need to be modified significantly between or- ganisms with different amounts of DNA and synap- tonemal complex lengths. Table 1 is a compilation of
genomic data from several organisms. These orga-
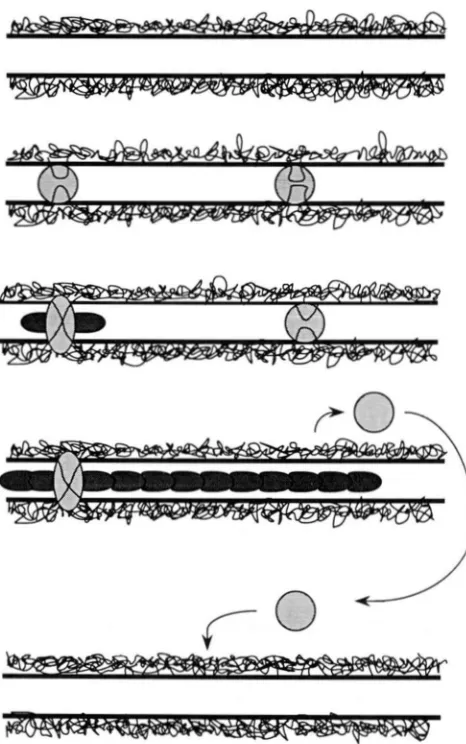
FIGURE I .-A speculative drawing of the model. h - l y structures (circular) bind randomly to the synaptonemal complex. Some initi- ate polymerization reactions thus becoming late nodules (oval). The growing polymers eject early structures. The ejected early struc- tures are either degraded or bind to synaptonemal complex that is free of polymer.
of magnitude, but (with the exception of Schizosac-
charomyces pombe) the number of crossovers per biva- lent varies by only a factor of about five. It is apparent that a model of interference that is to apply to more
than a few organisms must be adaptable such that it
can act over a wide range of distances. Polymerization
is a means with biological precedence which may be utilized to regulate recombination over such a range.
A polymer-based interference model: We propose
a model to account for chiasma interference in which early structures randomly attach among and along the synaptonemal complexes of meiotic nuclei (see Figure
1). Once attached, each structure has an equal chance
per unit time of initiating a bidirectional polymeriza- tion reaction. I t is speculated that the structures ini- tiating a polymerization reaction would give rise to the late recombination nodules, seen in pachytene, and would initiate reciprocal exchange. I t is further speculated that the early structures are the early re- combination nodules observed in zygotene, however
the model does not depend on these speculations.
Growing polymers block the binding of additional
early structures to the synaptonemal complex. As
these polymers grow, bound structures that have not
yet initiated such a reaction continue to have the
opportunity to do so until they are ejected by the
advance of a polymer initiated at a nodule located
elsewhere on the same chromosome. ’I’he ejected
structures move into the surrounding medium, where
they are either degraded, reattach to an available site on the same synaptonemal complex, or reattach to a
site on a different complex. A chromosome that re-
ceived only a single structure would retain the struc-
ture since it could not be ejected, and would be
guaranteed to have a single late nodule and thus a single crossover. T h e number of chromosome arms
with zero crossovers is initially determined by a Pois-
son distribution based on the average number of early
structures. In this model there are more early struc- tures than late nodules, thus there are fewer chro- mosome arms with zero crossovers than there would
be if the number expected was based solely on the
average number of late nodules. T h e number of chro- mosome arms with zero crossovers may be further reduced by the relocation of ejected early structures
onto chromosome arms that were initially void of
structures. These features of our model insure that virtually all bivalent arms will eventually obtain at least one late nodule, provided a moderate excess of early structures is synthesized. This model was partly
inspired by the proposal of RASMUSSEN and HOLM
( 1 978) for a redistribution from random recombina- tion nodules associated with the synaptonemal com- plex at zygotene to the nonrandom nodules observed in pachytene.
MATERIALS A N D METHODS
A Modula-2 program was written and run on an Apple Macintosh IIcx computer to simulate the model. The com- puter simulation generated “late nodule” bivalent arms from “early structure” bivalent arms. Early structures were placed at random on a bivalent arm with one hundred binding sites. Random numbers were generated using the Pascal
version of the uniform deviate random number generator R A N 1 from PRW et al. (1986). The number of early structures placed on the arm followed a Poisson distribution with an average of roughly twice the number of crossovers observed in either Drosophila or Saccharomyces. The posi- tions of the early structures were determined by generating
a random number between zero and ninety-nine for each structure and then designating the corresponding binding site as the location of a structure. Each “turn,” a random number between zero and one would be generated for each attached early structure. If this number was less than or equal to an assigned probability of initiating a polymeriza- tion reaction, that structure would be transformed into a late nodule and a polymer would begin to grow outward from the nodule.
1130 J. S. King and R. K. Mortimer
arm. Any early structures encountered by a polymer would then be removed and a new round would ensue, checking to see if any remaining early structures had initiated a polymerization reaction. In principle the model allows for the reattachment of displaced nodules; however, for sim- plicity this was not done in the computer simulations. When all the early structures had either been ejected or become late nodules, the cycle would stop and the results were recorded in terms of nodules remaining, distance between nodules, and distribution of nodules along the bivalent arm. Chiasma interference was analyzed in terms of coincidence as a function of distance.
For the simulation that was compared to the yeast data, each turn the growing polymers were given a probability of independently terminating growth in either direction. The values of the polymerization start and polymerization ter- mination probabilities used in the simulations were deter- mined by trial and error, acceptable values being those that reduced the initial distribution of early structures to a dis- tribution of late nodules that matched the observed distri- bution of number of crossovers.
Comparison of our model to genetic observations of the number of crossovers and to their distribution along a chromosome arm requires crosses with markers spanning the length of a chromosome arm. Fortunately, relevant published data from Drosophila (BRIDGES 1935) and unpub- lished data from Saccharomyces (R. K. MORTIMER and S. FOCEL) were available. In Drosophila the tetrads are in- ferred from the genotypes of the diploid progeny. The number of crossovers along the X chromosome in Drosoph- ila were determined by WEINSTEIN (1936). Distances be- tween crossovers and the distribution of crossovers in single- and double-event tetrads were analyzed by CHARLES (1938). The interference values from the computer simulations were compared with the data in STEVENS (1936). In the comparisons of the model and the experimental observa- tions made in Drosophila, the distances between genetic markers are based on salivary map data compiled by CHARLES (1 938) and are thus physical distances.
For the comparison of the number of crossovers per chromosome arm in the computer simulations with Saccha- romyces, 780 tetrads with markers spanning the right arm of chromosome III were analyzed. The number of cross- overs or recombinogenic events per tetrad is the tetrad rank. The distributions of crossovers in rank one and rank two tetrads were calculated. Coincidence values from the computer simulation were compared to data from several other Saccharomyces crosses, with a total of 8927 tetrads, all with at least five closely spaced markers on chromosome VIII. In the comparisons of the model and the experimental observations made in Saccharomyces, the distances between genetic markers are based on genetic data. The two sets of yeast data were necessary since the crosses that provided the chromosome IIZ data did not have markers close enough together to carry out interference analysis and the crosses used for interference analysis on chromosome VIII did not have markers spanning the length of a chromosome arm. Markers spanning the chromosome arm are necessary in order to record all the recombination events, and this is
needed to determine the overall rank of the arm and the distribution of crossovers along the arm. Since there is typically no interference across centromeres, the two arms of a chromosome should be independent in terms of the distributions of crossovers along the arms. Because of this we compare the model to chromosome arms. Since the Drosophila X chromosome is telocentric this is essentially the entire chromosome.
RESULTS
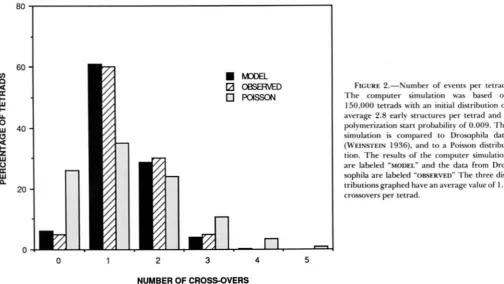
Figure 2 is a graphic comparison of the observed
number of crossovers along the X chromosome of
Drosophila to the number predicted by our model.
T h e probability of initiating a polymerization reaction
was set at 0.009. T h e sample size was 150,000 tetrads. T h e number of bivalent arms with zero nodules in the
computer simulation is initially 6.1 % based on a Pois-
son distribution with an average of 2.8 nodules per bivalent. T h e model output and the observed distri- butions are quantitatively similar and both have an average of 1.4 crossovers per tetrad and differ signif- icantly from the Poisson distribution with the same average. T h e same output was then compared to the Drosophila data in terms of distance between cross-
overs, coincidence, and distribution of crossovers in
rank one and rank two tetrads.
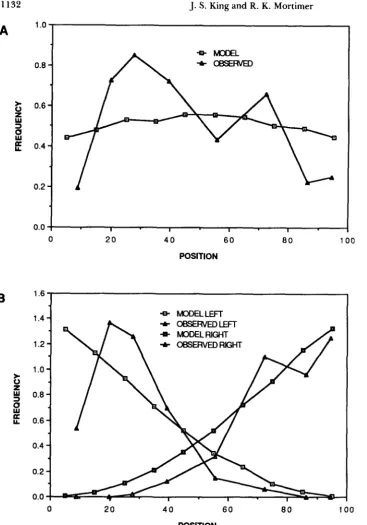
Figure 3 is a comparison of the distributions of
crossovers in rank one and rank two tetrads plotted by CHARLES (1938) and a similar distribution gener-
ated by the computer simulation. The distributions of
crossovers for single- and double-event arms from the computer simulation have the characteristics observed in Drosophila. Single events tend to be located near the center of the chromosome. T h e computer-gener- ated distribution of single events does not have the
sharp peaks (at approximately 25% and 70% the
length of the chromosome) and the drop at approxi-
mately 55% the length of the chromosome, observed
in Drosophila. However, CHARLES (1938) concluded
that due to errors primarily from estimating positions
of markers it can not be concluded that the peaks
observed represent a true bimodal distribution. He
did conclude that in single crossover tetrads, the cross-
over is less likely to be near one of the ends than it is
to be near the center of the chromosome. Double-
event tetrads tend to have one event near the cen-
tromere and the other towards the telomere, and in this case the model output and the experimental data from Drosophila agree very well. Peaks at approxi-
mately 25% and 70% the length of the chromosome
are also observed in rank two tetrads. This may indi-
cate that while the overall distribution is predomi-
nantly determined by rank there may be a tendency
for events to occur in specific regions regardless of
rank. T h e lack of events near the centromere in the experimental distribution of crossovers in two-event
tetrads may be caused by exclusion of events near the
centromere. This exclusion may account for the ob-
served distribution of single crossovers near the cen- tromere being significantly lower than the model out- put. T o generate distributions of crossovers with ex-
cluded regions, a more refined simulation could begin
with a nonuniform distribution of early structures.
In Figure 4 we compare the distance between nod-
ules in rank two tetrads from Drosophila data
FIGURE 2.-Number o f events per tetrad. T h e computer simulation was based on
150,000 tetrads with an initial distribution of
average 2 . 8 early structures per tetrad and a polymerization start probability o f 0.009. T h e simulation is compared to Drosophila data
(WEINSTEIN 1936). and to a Poisson distribu- tion. T h e results o f the computer simulation are labeled "MODEL" and the data from Dro- sophila are labeled "OBSERVED" T h e three dis- tributions graphed have an average value o f 1.4 crossovers per tetrad.
tions. T h e average distance between crossovers in both the model output and in Drosophila is approxi-
mately 50% the length of the chromosome arm. This
is significantly greater than the average of 33% ex-
pected for a random distribution. That the distance
between crossovers is greater than it would be if the
events were random restates that there is positive
chiasma interference.
A more informative way of analyzing interference
is to graph coincidence vs. distance since it illustrates
how interference decreases with increasing separation
of genetic intervals. This was done in Figure 5 for
both the computer generated data and for data ob-
tained along the
X
chromosome in Drosophila. Exper-imental coincidence values and uncertainties are from STEVENS (1936) and distances are from CHARLES
( 1 938). This coincidence 'us. distance graph illustrates
that interference data from the model qualitatively
follow experimental results in Drosophila, in that in- terference is strong over short intervals and falls off with increasing separation. T h e failure of the com-
puter generated coincidence values to reach unity
over the length of the chromosome arm may be caused
by the oversimplification of polymer growth made in
the computer simulation. A real polymer might not
have a constant, length-independent growth rate. T h e
growth rate in long polymers might be limited by breakage and a decreasing concentration of subunits. At small distances the model does not generate as
much interference as observed. This may be due to
our model recombinat.ion structure being only one potential recombination site in size. A structure that occupied several sites would generate absolute inter- ference over short intervals.
Computer simulations were also used to compare
the model to observations made in the yeast S. cermis-
iae. A probability for a growing polymer to stop was added to the simulation to obtain coincidence values that would approach one over long distances. The simulations compared to Saccharomyces initially had, on average, three early structures, a polymerization
start probability of 0.02, and a probability of polym-
erization termination of 0.0 1. Thirty-thousand model
tetrads were analyzed. T h e experimental data for the
comparison of crossovers per tetrad and the distribu-
tion of events along the right arm of chromosome
IZI
come from 780 tetrads from hybrid 4579 (S. FOGEL,
unpublished data). T h e genotype of hybrid 4579 is
+
+
leu2-27 MATa+
ma12his4 leu2-I
+
MATa thr4MAL2T h e gene leu2 was used as a centromere marker (it is
about 5 centimorgans to the left of the actual centrom-
ere), and recombination events between leu2-27 and
MAL2 (MAL2 is within 10 kilobase-pairs of the right
telomere) were recorded. Since leu2 is to the left of
the centromere a fraction of the crossovers that were
recorded as having occurred on the right arm presum-
ably occurred on the left arm, but since the distance
between MAT and the centromere (about 30 centi-
morgans) is six times longer than the distance between leu2 and the centromere this fraction is assumed to be small.
Table 2 is a comparison of the observed number of
crossovers
per
tetrad arm (data from chromosomeIZI
of Saccharomyces), to the number predicted by a
computer simulation. Since occasionally four-strand
1 .o
0.8
0.6
0.4
0.2
0.0 0
J. S. King and R. K. Mortimer
20 4 0
POSITION
6 0 80
-
1 0 0
1.6
1.4
1.2
1 .o
0.8
0.6
0.4
0.2
0.0
*
MODELLEFT+ OBSERVEDLEFT
4 MODELRIGKT
+
OBSEfWEDRIGHT0 20 4 0 6 0 80 100
POSITION
FIGURE 3.- D i s t r i b u t i o n s of
crossovers in tetrads from a com- puter simulation and from Drosoph- ila. The experimental data is from
CHARLES (1938) in which the Dro- sophila tetrads are inferred from the genotypes of the diploid progeny. Po-
sition 0 corresponds to the centrom- ere and position 100 corresponds to the distal telomere. Frequency is the percentage of tetrads with an ex- change in the specified region per 1/ 100 the length of the chromosome arm. (A) Distribution of crossovers in rank one tetrads. Model output has been adjusted to account for differ- ences in the percentage of single event tetrads reported in CHARLES
(1938) and the computer simulation.
(B) Distribution of crossovers in rank two tetrads. The left-most and right- most crossovers are plotted sepa- rately. Model output is adjusted to take into account differences in per- centage of tetrads with two ex- changes reported in CHARLES (1 938) compared to the computer simula- tion and the different number of in- tervals (8 vs. IO).
double crossovers occurred between two adjacent
markers, resulting in a non-parental ditype tetrad, it
can be assumed that other double crossovers occurred
that were observed as either parental or tetratype
tetrads. The data are adjusted to take into account these “silent” double exchange events in the following
way. A four-strand double exchange results in a non-
parental ditype tetrad (NPD); assuming a two-strand double is as likely (no chromatid interference), there can be expected to be an equal number of two-strand doubles that were scored as parental type tetrads (P). Similarly, for every four-strand double we expect there to be two three-strand doubles that were ob- served as tetratype tetrads (T). These adjustments are then weighted in proportion to the number of NPDs
that occurred in otherwise rank zero, rank one or
rank two tetrads. For example, there were 12 four-
strand double crossovers in tetrads with no other
events, so 12 of the rank zero tetrads and 24 of the
rank one tetrads are scored as rank two tetrads. It is
apparent from the data in Table 2 that a Poisson
distribution does not approximate the experimental
observations while the distribution of late nodules
generated by the computer simulation of the model does approximate the observed tetrad ranks.
The observed distribution of crossovers in rank one
tetrads from hybrid 4579 did not deviate significantly
Model of Chiasma Interference
1.2
1 .o
0.8
W
Y
P
8
W 0.6
0.4
0.2
0.0
0 2 0 6 0 4 0 80 100
DISTANCE
0 20 4 0 6 0
DISTANCE
the characteristic of having one of the two events near
the centromere and the other near the telomere, as
was found to occur in Drosophila. T h e number of
double crossovers in the regions genetically defined
in hybrid 4579 are listed in Table 3. Region 1 is
between leu2 and
MAT
(no crossovers occurred be-tween the two leu2 alleles). Region 2 is between
MAT
and thr4 and region 3 is between thr4 and
MAL2.
T h e numbers of crossovers expected in the regions listedif there were no interference are in the column labeled
"no interference." T h e numbers from computer sim- ulations are in the column labeled "model." In Sac- charomyces and in the computer simulations, cross-
80 100
FIGURE 4.-Distance between cross- overs in two-event tetrads vs. frequency of occurrence. Distance is based on phys- ical data and is in percentage of the chromosome arm length and frequency is the percentage of rank two tetrads with the corresponding distance be- tween exchanges. Experimental data is from Drosophila, and analyzed by CHARLES (1938). In both the computer simulation and in Drosophila the dis- tance between crossovers in double- event tetrads are approximately 50% the length of the chromosome arm, rather than 33% as would be the case for a random distribution.
FIGURE 5.-Coincidence vs. distance. Experimental data are from the X chro- mosome of Drosophila, calculated by
STEVENS (1936). In both the model and in Drosophila, interference is strong over short distances and falls off with increasing distance. In the computer simulation coincidence does not reach a value of one even for lor'g distances be- cause no limitations were ,,laced on poly- mer growth. In Drosophi'a coincidence is approximately one ior distances greater than 50% the length of the X
chromosome.
overs in rank two tetrads tend to be spaced far apart. One crossover tends to occur near the centromere
(region 1) and the other near the telomere (region 3),
thus regions 1 and 3 have a high number of coincident
crossovers in rank two tetrads.
Figure 6 shows the distribution of crossovers in
model tetrads and tetrads from hybrid 4579 of rank
one and rank two. T h e events in rank one tetrads
from the computer simulation have the characteristic
of being located near the center of the arm; however,
it is a moderately flat distribution which is consistent
with not detecting a nonuniform distribution of events
1134 J. S. King and R. K. Mortimer
TABLE 2
Crossovers per chromosome arm from Saccharomyces and from the model
Percentage of tetrads
Model
Observed No. of Poisson Early Late
crossovers distribution structures nodules Saccharomyces
0 16.5 5.0 5.0 6.8
1 29.8 14.9 33.4 32.4
2 26.8 22.4 38.5 37.1
3 16.1 22.4 17.7 19.9
4 7.2 16.8 4.6 3.8
>4 3.6 18.5 0.8 0.0
Average 1.80 3.00 1.86 1.80
Number of crossovers per tetrad observed on the right arm of chromosome III of Saccharomyces compared to the number of early structures and late nodules from a computer simulation. The experimental data are from 780 tetrads of hybrid 4579. The simulation was based on 30,000 tetrads with an initial distribution of three early structures per tetrad, a polymerization start proba- bility of 0.02, and polymerization termination probability o f 0.01.
Both the model distribution of late nodules and observed tetrad ranks in Saccharomyces differ significantly from a Poisson distri- bution. The predicted rank of tetrads from computer simulations based on the model approximate the ranks o f tetrads from hybrid 4579.
TABLE 3
Positions of crossovers in rank two tetrads
Regions Observed N o interference Model
1-2 60 40 54
1-3 133 59 124
2-3 58 44 65
1-1 8 53 16
2-2 8 30 6
3-3 24 65 26
The positions of crossovers along a chromosome arm in rank two tetrads in Saccharomyces are nonuniform and are similar to Drosophila in that one exchange tends toward the centromere and the other toward the telomere. The numbers in the column labeled “observed” are from chromosome 111 of hybrid 4579. The number of rank two tetrads expected with a crossover in each of the two regions listed i n the first column for a uniform distribution and without interference is listed in the column labeled “no interfer- ence.” The expected numbers were calculated using the overall recombination rates for each region in hybrid 4579. The numbers in the colunm labeled “model” correspond to the number generated in the computer simulations. For the computer simulations the regions were set to the proportions of the regions in hybrid 4579.
In rank two tetrads one crossover tends to be in region one and the other tends to be in region three.
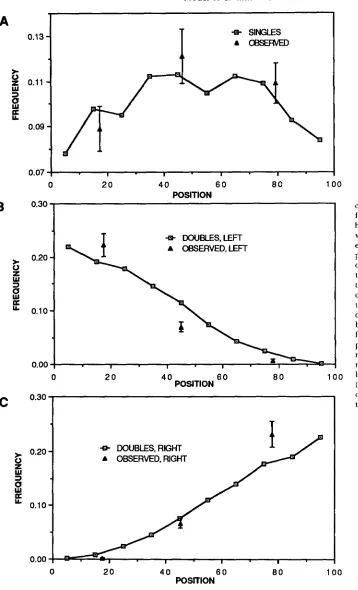
4579. Figure 6, parts B and C, are graphs of the
distributions of crossovers from simulated rank two
tetrads and the similar events recorded from hybrid
4579 for the left-most (Figure 6B) and right-most
(Figure 6C) crossovers. T h e experimental distances are based on genetic data. T h e comparison of the distribution predicted by the model to the observed positions of the crossovers in Saccharomyces illustrates that the model positions crossovers according to tetrad rank in a pattern similar to that seen experimentally. Analysis of the data is limited by the small number of
defined genetic intervals in hybrid 4579.
In Figure
7,
coincidence vs. distance is graphed forthe model and for the six hybrids listed in Table
4.
All six hybrids are genetically marked with at least
five genes spaced close enough together along the
right arm of chromosome VZZZ to calculate interfer-
ence as a function of distance. Positions are in per- centage of the total genetic length of the chromosome
arm, beginning at the centromere with zero, and
moving 40% toward the telomere. T h e length of the
region from CEN8 to CUPl compared to the length
of the chromosome arm was calculated from data in
the recent genetic map of Saccharomyces (MORTIMER
et al. 1989), and the distances between the genes
within the region were calculated from the relative frequencies of crossovers in the crosses examined in this study. Coincidence values are calculated for the combinations of regions between cen8 and p e t l , p e t l and arg4, arg4 and t h r l , t h r l and C U P l . Regions
between arg4 alleles were not used since not enough
coincidental events occurred in these intervals to ac- curately calculate interference. T h e computer simu- lation and experimental observation are basically in
agreement, with the observed interference being
slightly stronger overall.
DISCUSSION
Since our model proposes that the same cellular machinery is used to regulate meiotic recombination between and along chromosomes, it can explain the complex and diverse phenotypes of some meiotic mu-
tants. For instance Drosophila mutants that relax chro-
mosomal regulation in the form of interference also
have a more random number of events between chro-
mosomes (BAKER and HALL 1976). In our model, this
phenotype could be caused by either defective poly- mer subunits, or by recombination nodules unable to initiate the polymerization reactions. Drosophila mu- tants, heterozygous for large inversions on chromo-
some Z I I or on the X chromosome, have reduced
recombination rates on the chromosomes with the
inversions and increased recombination rates on their
normal chromosomes (SHULTZ and REDFIELD 1933).
This phenomenon is known as the Shultz-Redfield
effect and has been shown to occur in other organisms. In our model it can be explained as resulting from early structures being less likely to bind to the mutant chromosomal regions (which may pair more slowly or
less frequently), resulting in more early structures
available to bind to the normal chromosomes.
In Drosophila, humans, Neurospora, and several
other organisms, structures in zygotene associated
with the synaptonemal complex have been observed
(CARPENTER 1979; HOLM and RASMUSSEN 1983;
Model of Chiasma Interference
A
0.13
1
*
Lu
3
Y
0.11-
8
h
0.09
-
0.07
:
I I I I0 20 4 0 6 0 80 1
POSITION
Q DOUBLES, LEFT
A OBSERVED, LEFT
0 20 4 0 6 0
POSITION 8 0 1 0 0
Q DOUBLES, RIGHT
A OBSERVED, RIGHT
1.
T
”
I I I I
FIGURE 6,”Distribution of cross- overs in rank one and rank two tetrads from a computer simulation and from hybrid 4579. T h e computer simulation was based on 30,000 tetrads, a polym- erization start probability of 0.02 and a polymerization termination probability of 0.01. (A) Crossovers in rank one te- trads. Crossovers in rank one tetrads tend to be located near the center of the chromosome arm, however the localiza- tion is not dramatic. T h e experimental distribution of single crossovers in hy- brid 4579 does not significantly deviate from a uniform distribution. (B) T h e positions of the leftmost crossover in rank two tetrads. Crossovers tend to be near the centromere, which is near the left-hand end of the monitored region.
(C) T h e positions of the rightmost cross- over in rank two tetrads. Crossovers tend to be near the telomere.
0 20 4 0 6 0 8 0 1 0 0
POSITION
tures interpreted as intermediates between early and
late nodules have been observed and support the
theory that late nodules arise from a subset of the
early nodules, but the intermediates observed may be
partially assembled late nodules (BOJKO 1989). In this
model these possible morphological changes may mark the initiation of a polymerization reaction. Proof
that late nodules arise from early nodules does not
currently exist; however this model provides a means for the randomly distributed early nodules to give rise
to the nonrandomly distributed late nodules using
only random events.
Several investigators have made proposals for the
possible function of early nodules. CARPENTER (1979)
1136 J. S. King and R. K. Mortimer
.
.-
0.8
-
0.6
-
0.4
-
0.2
-
0.0
:
-' I I II
0 10 20 30 4 0
DISTANCE
TABLE 4
Saccharomyces strains used to collect data for interference analysis
Hybrid Genotype tetrads
No. of
X2961
+
petl _ _ trpl+
+
arg4-16 thrl-
~~ ~
arg4-3
+
+
CUP1 21235571
+
pet1+
thrl -trpl
+
arg4-3+
CUPI 10745574
+
p e t 1+
+
thrl -trpl
+
a7g4-3 arg4-36+
CUPl 10735577
+
petl arg4-16+
thrl -~
t r p l
+
+
arg4-36+
CUPI 908~~ ~~ ~
E 5 5 9
+
Pet1+
arg4-16 thrl-
trpl
+
arg4-3+
+
CUPl 11405497 trpl
+
arg4 thrl -+
petl+
+
CUP1 2609Genotypes of strains used in interference analysis. Strains were heterozygous for additional markers not used in this analysis. [Hy- brids from S. FOCEL and R. MORTIMER. Data from hybrid X2961 are published in MORTIMER and FOCEL ( 1 974), the rest are unpub- lished].
recombination. RASMUSSEN and HOLM (1978) pro-
posed that early nodules mediate both reciprocal and nonreciprocal recombination, but only those that are
involved in reciprocal recombination remain associ-
ated with the synaptonemal complex and thus become
late nodules. There are two observations that must be
considered in order to fit our model with the genetic
and cytological results. Early nodules and gene con-
FIGURE 7.-Coincidence us. distance for Saccharomyces and the model. Dis- tance is based on genetic data and is in percentage of the chromosome arm be- ginning with zero at the centromere. Experimental data is pooled from the six crosses listed in Table 4 (R. K. MORTI-
MER and S. FOGEL, unpublished data). The computer simulation is based on 30,000 tetrads, a polymerization start probability of 0.02 and a polymerization termination probability of 0.01. The computer simulation of the model ap- proximates the experimental observa- tions made in Saccharomyces.
version events are randomly distributed and do not exhibit interference. Late nodules and reciprocal ex- change events are nonrandom and do exhibit inter- ference. Based on our model of interference and the above observations, and given that the late nodules arise from the early nodules, there are two possible orders of events. Both involve the initial random placement of early recombination nodules capable of initiating gene conversion.
In the first, if an early nodule initiates a polymeri- zation reaction it becomes anchored to the synapto- nemal complex and the necessary steps for reciprocal recombination occur. In the second possible order of
events, cleavage of the DNA resulting in a reciprocal
exchange precedes and results in the initiation of a
polymerization reaction and cleavage of the DNA not
resulting in crossover does not lead to the initiation of a polymerization reaction. These proposals are
similar to the proposal, based on the analysis of mu-
tants defective in reciprocal exchange, made by CAR-
PENTER (1982) that isomerization is under genetic control. In both cases all early nodules would be at
sites of initiation of recombination and there would
be reciprocal recombination at sites where an early nodule becomes a late nodule. Furthermore the ap-
proximately 50% crossover to gene conversion with-
out crossover ratio would be a reflection of the redis-
tribution of nodules, not a random resolution between
equivalent forms.
Positive interference is not found in all regions of the Drosophila and Saccharomyces genomes. For ex-
ample MULLER (1916) found no interference across
the centromere of chromosome ZZ and negative inter-
Model of Chiasma Interference 1137
1975). T h e lack of interference across the centromere is explained in our model by structures associated with the centromere blocking the advance of the polymer.
Our model does not provide a means of generating
negative interference; however, the negative interfer- ence observed may be due to a variation in recombi-
nation frequencies (SALL and BENGTSSON 1989). Ap-
parent negative interference can also be due to gene conversion of a middle gene, which under some cir- cumstances might be mis-scored as coincident recip-
rocal recombination events, straddling the middle
gene.
T h e computer simulation used 100 equivalent sites;
however both genetic and molecular studies indicate that not all DNA sites are equivalent in terms of gene conversion and reciprocal recombination frequencies.
For instance, genetic and molecular studies of the
ARC4 locus of yeast clearly show a polarity of gene
conversion indicating a preferred site of initiation
(FOGEL et al. 1979; NICHOLAS et al. 1989) and the data
plotted in Figure 3 may illustrate a tendency for
crossovers to be more frequent in some regions of Drosophila chromosomes than in others, regardless of
tetrad rank. This model does not address whether
events are initiated at specific DNA sites, and is in fact
flexible in terms of the number of sites used. Recom-
bination nodules may bind more readily to certain
sites or regions. For example there may be a nonuni-
form initial distribution of early recombination struc- tures. T h e probability of a recombination nodule ini- tiating a polymerization reaction may also be higher at certain sites.
The model presented in this paper is simple and
biologically reasonable. It regulates the number of
events per chromosome and the distribution of events
along chromosomes, using a single mechanism. This model also explains how it may be possible for orga- nisms with significantly different chromosome lengths to use the same regulatory mechanisms with only minor changes in properties, such as changes in rates of polymerization, or changes in the amount of time spent undergoing meiosis.
Several possible additions to the model have been
considered, i.e., nonuniform initial distributions, vari-
able initiation probabilities, and variable polymeriza- tion rates. These variations are considered to be com- plications in simulating the genetic data of Drosophila and Saccharomyces since even in its simplest form the predictions of the model agree well with the genetic data examined. Additions to the simulation generate
additional variables and without a priori knowledge,
it is difficult to assign biologically relevant values to
these variables. T h e regulation observed in Drosoph- ila and Saccharomyces is qualitatively similar to the regulation observed in other organisms. In organisms with less uniform distributions of events additions to the model may be needed.
T h e model would be supported by the discovery of a polymerizing substance associated with the synap-
tonemal complex and recombination nodules. Indi-
rect evidence for the existence of a polymer may lie
in the observation that apparent components of the core of the synaptonemal complex self-assemble in the
cytoplasm of spermatocytes and oocytes of Ascaris
m u m , thereby exhibiting the ability to polymerize (BOGDANOV 1977; FIIL, GOLDSTEIN and MOENS 1977). T h e straightening of the synaptonemal complex be- tween zygotene and pachytene may also be evidence for polymerization that could provide a force used in untangling the chromosomes.
If this model does represent actual cellular events, there should also be a randomly distributed precursor to the late recombination nodules. T h e prime candi-
date for such a precursor is, of course, the early
recombination nodules, but whether early recombi-
nation nodules become late recombination nodules
has yet to be proven. To answer these questions, it
may be necessary to isolate and characterize the com- ponents of the synaptonemal complex and recombi- nation nodules. Analysis of meiotic mutants from a
variety of organisms has provided important clues
regarding the regulation of recombination and its role
in meiosis, and future studies will undoubtedly prove informative.
We would like to thank SEYMORE FOCEL for the unpublished data andJoHN GAME and DANIEL H. MALONEY for critical readings of the manuscript. This work was supported by a grant from the office of Health and Environmental Research of the U.S. Depart- ment of Energy under contract DE-AC03-76SF00098 and by U.S.
Public Health Service grants GM30990, 5 P40 RR04231-02 and ES07075.
LITERATURE CITED
BAKER, B. S., and A. T . C. CARPENTER, 1972 Genetic analysis of sex chromosome meiotic mutants in Drosophila melanogaster. Genetics 71: 225-286.
BAKER, B. S., and J. C. HALL, 1976 Meiotic mutants: genetic control of meiotic recombination and chromosome segrega- tion, pp. 351-434 in Genetics and Biology of Drosophila, Vol. lA, edited by M. A. ASHBURNER and E. NOVITSKI. Academic Press, New York.
BOGDANOV, Y. F., 1977 Formation of cytoplasmic synaptonemal- like polycomplexes a t leptotene and normal synaptonemal com- plexes at zygotene in Ascaris suum male meiosis. Chromosoma
61: 1-21.
BOJKO, M., 1989 T w o kinds of “recombination nodules” in Neus- pora crassa. Genome 32: 309-37 1.
BRIDGES, C. B., 1935 Constitution of thegerminal material in relation to heredity. Yearbook Carnegie Inst. 3 4 284-291.
CARPENTER, A. T . C., 1975 Electron microscopy of meiosis in Drosophila melanogaster females. 11. T h e recombination nod- ule-a recombination-associated structure at pachytene? Proc. Natl. Acad. Sci. USA 72: 3 186-3 189.
CARPENTER, A. T . C., 1979 Synaptonemal complex and recom- bination nodules in wild-type Drosophila melanogaster females. Genetics 92: 5 1 1-54 1.
1138 J. S. King and R. K. Mortimer
CARPENTER, A. T. C., 1982 Mismatch repair, gene conversion, and crossing-over in two recombination-defective mutants of
Drosophila melanogaster. Proc. Natl. Acad. Sci. USA 79: 5961- 5965.
CARPENTER, A. T . C., 1989 Thoughts on recombination nodules, meiotic recombination, and chiasmata, pp. 529-548 in Genetic Recombination, edited by R. KUCHERLAPATI and G. R. SMITH. American Society for Microbiology, Washington, DC.
CHARLES, D. R., 1938 T h e spatial distribution of cross-overs in X-chromosome tetrads of Drosophila melanogaster. J. Genetics
EGEL, R., 1978 Synaptonemal complex and crossing-over: struc- tural support or interference? Heredity 41: 233-237.
EMERSON, S . , and G. W. BEADLE, 1933 Crossing-over near the spindle fiber in attached X-chromosomes of Drosophila mela- nogaster. Z . Vererhungsl. 45: 129-140.
FASMAN, G. D. (editor), 1976 Nucleic Acids, Volume I I (CRC Hand- book of Biochemistry and Molecular Biology). CRC Press, Cleveland.
FIIL, A,, P. GOLDSTEIN and P. B. MOENS. 1977 Precocious for- mation of synaptonemal-like polycomplexes and their subse- quent fate in female Ascaris lubricoides var. suum. Chromosoma 65: 21-35.
FOGEL, S., R. MORTIMER, K. LUSNAK and F. TAVARES,
1979 Meiotic gene conversion: a signal of the basic recombi- nation event in yeast. Cold Spring Harbor Symp. Quant. Biol.
GILLIES, C. B., 1972 Reconstruction of the Neurospora crassa pachytene karyotype from serial sections of synaptonemal com- plexes. Chromosoma 3 6 119-1 30.
GREEN, M. M., 1975 Conversion as a possible mechanism of coincidence values in the centromere region in Drosophila. Mol. Gen. Genet. 139: 57-66.
HALDANE, J. B. S . , 1931 T h e cytological basis of genetical inter- ference. Cytologia 3: 54-65.
HILLIKER, A. J., and A. CHOVNICK, 1981 Further observations on intragenic recombination in Drosophila melanogaster. Genet Res. 38: 281-296.
HOLM, P. B., and S. W. RASMUSSEN, 1983 Human meiosis VI. Crossing over in human spermatocytes. Carlsberg Res. Com- mun. 48: 385-413.
HURST, D. D., S. FOCEL and R. K. MORTIMER, 1972 Conversion- associated recombination in yeast. Proc. Natl. Acad. Sci. USA
69: 101.
JONES, G. H., 1984 T h e Control of chiasma distribution, pp. 293- 320 in Controlling Events in Meiosis, edited by C. W. EVANS and H. G . DICKINSON. T h e Company of Biologists Ltd., Cambridge. LICHTEN, M., R. H. BORTS and J. E. HABER, 1987 Meiotic gene
conversion and crossing over between dispersed homologous sequences occurs frequently in Saccharomyces cerevisiae. Ge- netics 115: 233-246.
LAURIE, D. A,, 1980 lnterindividual variation in chiasma fre- 3 6 103-126.
43: 1325-1341.
quency and chiasma distribution. A study of Chorthippus brun- neus and man. Ph.D. thesis, University of Birmingham, Bir- mingham, England.
MESSELSON, M. S . , and C. M. RADDING, 1975 A general model for genetic recombination. Proc. Natl. Acad. Sci. USA 72:
MORTIMER, R. K., and S. FOGEL, 1974 Genetical interference and gene conversion, pp. 263-275 in Mechanisms in Recombination, edited by R. F. GRELL. Plenum, New York.
MORTIMER, R. K., D. SCHILD, C. R. CONTOPOULOU and J. A. KANS,
1989 Genetic map of Saccharomyces cerevisiae, edition 10.
Yeast 5: 321-403.
MULLER, H. J., 1916 T h e mechanism of crossing-over. Am. Nat.
50: 193-221.
NICOLAS, A , , D. TRECO, N. P. SCHULTES and J. K. SZOSTAK,
1989 An initiation site for meiotic gene conversion in the yeast Saccharomyces cerevisiae. Nature 338: 35-39.
O’BRIEN, S. J. (editor), 1987 Genetic Maps. Cold Spring Harbor Press, Cold Spring Harbor, N.Y.
ORR-WEAVER, T . L., J. W. SZOSTAK and R. J. ROTHSTEIN,
1981 Yeast transformation: a model system for the study of recombination. Proc. Natl. Acad. Sci. USA 78: 6354-6358.
PRESS, W. H., B. P. FLANNERY, S . A. TEUKOLSKY and W. T .
VETTERLING, 1986 Numerical Recipes, pp. 196-1 97 and pp.
7 14-7 15. Cambridge University Press, New York.
RASMUSSEN, S. W., and P. B. HOLM, 1978 Human meiosis. 11. Chromosome pairing and recombination nodules in human spermatocytes. Carlsberg Res. Commun. 43: 275-327.
SALL, T., and B. 0. BENGTSSON, 1989 Apparent negative inter- ference due to variation in recombination frequencies. Genetics 122: 935-942.
SCHRANTZ, J. P., 1970 Etude cytologique, en microscope optique et electronique, de quelques Ascomycetes. 1. Le noyau. Rev. Cytol. Biol. Veg. 33: 1-100.
SHULTZ, J., and H. REDFIELD, 1933 Constitution of the germinal
material in relation to heredity. Yearbook Carnegie Inst. 32:
298-302.
STADLER, D., 1959 T h e relationship of gene conversion to cross- ing over in Neurospora. Proc. Natl. Acad. Sci. USA 45: 1625- 1629.
STEVENS, W. L., 1936 T h e analysis of interference, J. Genet. 32:
VON WETTSTEIN, D., S. W. RASMUSSEN and P. B. HOLM, 1984 T h e synaptonemal complex in genetic segregation. Annu. Rev. Ge- net. 18: 331-413.
WEINSTEIN, A,, 1918 Coincidence of crossing over in Drosophila
WEINSTEIN, A,, 1936 T h e theory of multiple-strand crossing over.
WHITE, M. J. D., 1977 Animal Cytology and Evolution. Cambridge
358-361.
5 1-64.
melanogaster (ampelophila). Genetics 3: 135-1 72.
Genetics 21: 155-199.
University Press, London.