DNA
Repair and the Evolution of Transformation in the
Bacterium
Bacillus subtilis
Richard
E. Michod, Martin F. Wojciechowski and Mary A. Hoelzer
Department of Ecology and Evolutionary Biology, University of Arizona, Tucson, Arizona 85721
Manuscript received June 12, 1987 Revised copy accepted October 6, 1987
ABSTRACT
The purpose of the work reported here is to test the hypothesis that natural genetic transformation
in the bacterium Bacillus subtilis has evolved as a DNA repair system. Specifically, tests were made to determine whether transformation functions to provide DNA template for the bacterial cell to use in
recombinational repair. The survivorship and the homologous transformation rate as a function of
dose of ultraviolet irradiation (UV) was studied in two experimental treatments, in which cells were
either transformed before (DNA-UV), or after (UV-DNA), treatment with UV. The results show that there is a qualitative difference in the relationship between the survival of transformed cells (sexual cells) and total cells (primarily asexual cells) in the two treatments. As predicted by the repair hypothesis, in the UV-DNA treatment, transformed cells had greater average survivorship than total
cells, while in the DNA-UV treatment this relationship was reversed. There was also a consistent and qualitative difference between the UV-DNA and DNA-UV treatments in the relationship between
the homologous transformation rate (transformed cells/total cells) and UV dosage. As predicted by the repair hypothesis, the homologous transformation rate increases with UV dose in the UV-DNA experiments but decreases with UV dose in the DNA-UV treatments. However, the transformation
rate for plasmid DNA does not increase in a UV-DNA treatment. These results support the DNA repair hypothesis for the evolution of transformation in particular, and sex generally.
S
EXUAL systems in both eukaryotes and prokar- yotes involve two basic components, (1) recom- bination, in the sense of the breakage and reunion of two homologous DNA molecules, and (2) outcrossing, in the sense that the two homologous DNA molecules involved in recombination come from two different individuals (for discussion, see MICHOD and LEVIN 1987). Both recombination and outcrossing occur in natural transformation, a process in which some bac- teria take up, and recombine into their own genome, DNA released from other bacteria or provided exper- imentally.T h e purpose of the work reported here is to test the DNA repair hypothesis (BERNSTEIN, BYERS and MICHOD 198 1 ; BERNSTEIN et a l . 1984,1985a-c; BERN- STEIN, HOPF and MICHOD 1987a, b) as an explanation for the evolution of natural transformation in the eubacterium Bacillus subtilis. Because many of the molecular and cellular details of transformation (for review, see DUBNAU 1982) and DNA repair (for re- view, see YASBIN 1985) have been elucidated, B. sub- tilis provides an ideal organism to experimentally ad- dress predictions of the repair hypothesis. From what is known about the mechanisms involved, natural transformation in B. subtilis appears to be a highly evolved trait. It results from a complex, energy-re- quiring, developmental process and not passive entry of DNA into the cell or artificial manipulation of the
Genetics 118: 31-39 (January, 1988)
cell. Its genetic control involves genes involved in both homologous recombination and DNA repair. However, although much is known about the mecha- nisms involved, the evolutionary function of natural transformation is poorly understood.
T h e repair hypothesis argues that the evolutionary function of transformation lies in its role in providing DNA template for recombinational repair of genetic damages. T o study this hypothesis, we have measured the densities of transformed cells and total cells at different DNA concentrations in the presence of in- creasing levels of UV radiation. Under common lab- oratory conditions, a culture of B. subtilis grown to competence is a mixture of predominately noncom- petent (asexual) cells and a minority of approximately
10-20% competent (sexual) cells (SOMMA and POLSI-
NELLI 1970; DUBNAU 1982). Competence refers to the
32 R. E. Michod, M. F. Wojciechowski and M. A. Hoelzer
cells presumably underestimate the actual differences between sexual and asexual cells.
MATERIALS AND METHODS
Bacterial strains, plasmid and media: We have studied transformation and DNA repair in B. subtilis strain YB886
(trpC2, metB5, amyE, sigB, xin-I, S P Q . This strain is a derivative of the naturally competent, recombination- and repair-proficient (ret+) strain B. subtilis 168, and has been cured of bacteriophage SPB and rendered noninducible for the endogenous prophage PBSX (YASBIN, FIELDS and AN- DERSEN 1980). Strain YBlOl1 (xin-1, SPK), a prototrophic (Trp+, Met+) derivative of strain YB886 (B. FRIEDMAN and R. YASBIN, personal commmunication) was used as a source of homologous chromosomal DNA (donor) for the transfor- mation experiments. Chromosomal DNA was isolated from strain YBlOl 1 using a modification of the method of SIL- HAVY, BERMAN and ENQUIST (1 984).
Plasmid pMK4, an ampicillin-resistant and chloramphen- icol-resistant bifunctional plasmid which replicates in both
B. subtilis and Escherichia coli (SULLIVAN, YASBIN and YOUNG 1984), was obtained from P. E. LOVE. Plasmid DNA (form
I) was isolated from host strain E. coli JM83 (VIEIRA and MESSING 1982) by a modified alkaline lysis procedure and purified by CsCI-ethidium bromide density gradient centrif- ugation as described by MANIATIS, FRITSCH and SAMBROOK (1 982) (propagation of plasmid DNA in E. coli was done to increase the frequency of multimeric forms in the DNA preparation).
Dilutions and suspension of cells were done in SPIZIZEN (1958) minimal salts (IXSS) unless otherwise stated. SPIZI-
ZEN minimal medium plus 0.5% glucose (MG) and compe- tence media GM l and GM2 were prepared as described by YASBIN, WILSON and YOUNG (1975), and supplemented with the appropriate amino acids at a final concentration of 50
Genetic procedures: Liquid cultures of B. subtilis YB886 were grown to maximize competence for chromosomal o r plasmid DNA transformation essentially as described by BOYLAN et al. (1972). An overnight (1 2-1 5 hr) plate culture of the recipient strain, grown on TBAB medium (Tryptose blood agar base, Difco Laboratories, Detroit, MI) at 37", was used as inoculum for GM1 medium. Cultures of recipi- ent cells were grown in GM1 at 37" with vigorous shaking until 90 min following the end of exponential growth (des- ignated as To, growth was monitored using a Klett-Summer- son colorimeter, No. 66 filter). At To
+
90 min the cells were then diluted tenfold into warm GM2 medium and incubated for 60 min with aeration before UV irradiationor the addition of transforming DNA. T h e type and amount($ of DNA added for transformation of competent cells was as follows.
Chromosomal DNA from B. subtilis YBlOl 1 was added to competent cultures at concentrations ranging from 10 ng/ml to 2 rg/ml. After a 30-min incubation at 37" with aeration, DNase I (Sigma, St. Louis, MO) was added to 100 Ig/ml and the cultures were incubated an additional 10 min. Cells were then diluted appropriately and plated im- mediately. Total numbers of viable cells were determined on both TBAB medium and MG minimal medium supple- mented with methionine and tryptophan (denoted as MG+ medium below), since there have been reports of different survival on the two media used (YASBIN 1977). TBAB medium is a rich medium and gives more consistent results, however, MG+ medium is closer to the medium used to screen for the transformed cells as it differs from it only by rg/ml.
the addition of the amino acid tryptophan which allows cells with the trpC.2 mutation to survive. T h e numbers of T r p + revertants were determined on MG medium supplemented only with methionine. Trp+ revertants are unlikely since the
trpC2 mutation is believed to be a small deletion (R. YASBIN, personal communication). Nevertheless, T r p + revertants were assayed for in each experiment by plating a sample of the culture which had n o DNA added on MG medium supplemented only with methionine. Mutation rates were always less than lo". Transformation at the metB5 locus was studied in a similar manner.
Plasmid pMK4 DNA was added to competent cultures at a concentration of either 0.5 or 2.0 rg/ml, and the cultures were incubated with aeration for 10 min prior to the addi- tion of DNase I. Cells transformed with pMK4 DNA (for chloramphenicol-resistant transformants) were diluted ac- cordingly, and poured onto 20-25 ml LB plates (MILLER
1972) in a 2.5-ml semisolid LB agar overlay. Following a subsequent 90 min incubation at 37" these cells were chal- lenged by a second LB semisolid overlay containing 125 Pg of chloramphenicol. Numbers of total viable cells were determined on LB medium. All plates were incubated at 37" for 12-48 hr before being counted.
U V irradiation of competent cultures: For the experi-
ments in which competent cells were UV-irradiated before the addition of transforming DNA (termed UV-DNA ex- periments), the following protocol was used. Samples (8-10 ml) of the competent culture (2-7 X lo7 CFU/ml) were treated with UV light (254 nm) in a 1 00-mm glass petri dish with constant stirring. Immediately after irradiation, the cells were centrifuged (5000 X g, 10 min, 25"), suspended in the same volume of warm (37") GM2 and transformed with either YBlOll DNA or pMK4 plasmid DNA as de- scribed above. Reverse experiments (termed DNA-UV ex- periments), in which cells were transformed with DNA prior to UV irradiation, were performed in the following manner. A competent culture was transformed with YBlOl 1 DNA at the concentrations described above. Following the incu- bation with DNase 1, the cells were collected by centrifuga- tion (5000
x
g, 10 min, 4"), resuspended, irradiated as just described, and plated on the appropriate media.T h e UV light source used in these experiments was a 15- W germicidal lamp (Sylvania G8T5). UV light intensities were determined using a Blak-Ray UV meter (UltraViolet Products, number 5225).
RESULTS
Evolution of Transformation 33
ready taken place before exposure to UV. All previous work involving DNA repair and transformation in B. subtilis that we are aware of (e.g., MITA, SADIE and
KADA 1983; YASBIN 1977) has dealt with competent cells which were transformed prior to treatment with
UV, as was done in our DNA-UV treatments.
Log transformations were taken of all data in Fig- ures 1, 2, and 4 for the purpose of statistical analysis since this transformation made the variances more homoscedastic. Means of the raw data were compared graphically to the means of transformed data and in all cases, the means of the transformed data differed very slightly from the means of the untransformed data. In addition to the means and standard errors, regression curves are also plotted in the figures. Coef- ficients for the regression curves and measures of fit are provided in Table 1. When regression lines are compared to each other in the following paragraphs, they were compared using the tests given in NETER and WASSERMAN (1974, pp. 160-16'7). Regression and analysis of covariance analyses were performed using the GLM and REG procedures of the SAS (Statistical Analysis System) computer package.
Cell survivorship in homologous DNA experi- ments: Survival data for the three classes of cells and for the two treatments is given in Figures 1 and
2
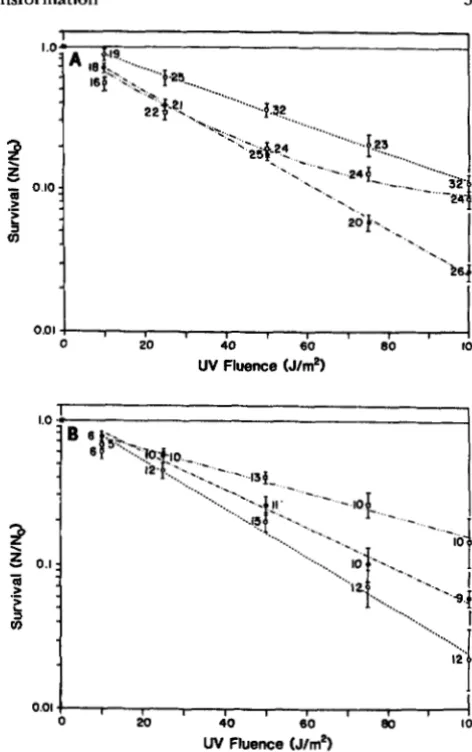
for experiments in which homologous chromosomal DNA was added to cells grown to competence. T h e two treatments are UV-DNA and DNA-UV and the three classes of cells are total cells, plated either on TBAB or MG+, and Trp+ transformants. T h e survival points are given as the average of log(N"v/No), where Nuv is the number of cells surviving a given UV dose and No is the number at zero UV dose. It is important to realize that "survivorship" calculated in this manner could be influenced by other factors in addition to mortality such as induction of transformation by UV.Survival data for the three classes of cells are plotted for the UV-DNA treatment in Figure 1A and for the DNA-UV treatment in Figure 1B. T h e data from experiments using different DNA concentrations (0.01, 0.10, 1 .O and 2.0 pg/ml) are pooled in Figure 1, A and B. As detailed in Table 1, all linear regression lines have an estimated slope which is significantly different from zero whereas the estimated intercept is not different from zero. A linear model for the MG+ data in the UV-DNA treatment (Figure 1A) did not fit the data and a quadratic function with no intercept term was fit to the data. This gave estimated coefficients which were both statistically different from zero (Table 1).
T h e results in Figure 1, A and B, show that there is a qualitative difference in the relationship between the survival of the transformed cells and total cells in the UV-DNA and DNA-UV treatments. As predicted by the repair hypothesis, in the UV-DNA treatment
0.01 4 1 1 I I i
I
0 20 40 60 80
UV Fluence (J/&
too
1
'21
0.01 # , 1 I I 1 I I 1 1
I
0 20 40 60 80 1 0 0
W Fluence (J/rnq
FIGURE l."Survival curves for YB886. Survival curves are given for three classes of cells subjected to the two treatments UV- DNA and DNA-UV. Points plotted are averages of log(N"&Vo) over multiple experiments. The data from experiments using dif- ferent DNA concentrations (0.01, 0.1, 1.0 and 2.0 rg/ml) are pooled. Error bars give mean f the standard error. Sample size is given near each mean. Regressions are graphed for each set of data. See text for further explanation. See Table 1 for information on regressions. Figure l a gives results for UV-DNA treatments. Figure 1B gives results for DNA-UV treatments. Key for means: Total cells plated on TBAB (O), total cells plated on MG+ 0; Trp+ cells transformed with homologous DNA (0). Key for regression: Total cells plated on TBAB (.- .-), total cells plated on MG+ (.
.
.-); Trp+ cells (---).(Figure 1 A), transformed cells had greater average survivorship than total cells, while in the DNA-UV treatment (Figure 1B) this relationship was reversed. T h e three regression lines in Figure lA, and the three regression lines in Figure lB, are different from one another at the P
<
0.001 level. T h e average survival of total cells was greater at higher UV doses when plated on MG+ than when plated on TBAB (Figure34 R. E. Michod, M. F. Wojciechowski and M. A. Hoelzer
0.01 7 9 1 I 1 I I 1
0 20 40 60 eo m
UV Fluence (J/m9
FIGURE 2.”Survival curves for YB886 Trp+ transformants for homologous transformation. Points plotted are averages of log(NUv/ NO) over multiple experiments. Error bars give mean f standard error. Sample size is given by each mean. See text for further exphnation and discussion of statistical tests. In the UV-DNA treatment, results are pooled for 0.01 and 0.1 gg/ml and for 1.0 and 2.0 pg/ml. All DNA concentrations are pooled for DNA-UV treatment. For information on plotted regressions see Table 1. Key for means: UV-DNA, Trp+, 0.01 and 0.1 pg/ml pooled (0); UV- DNA, Trp+, 1.0 and 2.0 pg/ml p o o l e d (0); DNA-UV, Trp+, 0.1 and 1.0 and 2.0 Pg/ml pooled 0. Key for regressions: UV-DNA,
Trp+, 0.0 1 and 0.1 cg/ml pooled (.
-.
-); UV-DNA, Trp+, 1 .O and 2.0 pg/ml pooled (..
.
-); DNA-UV, Trp+, 0.1 and 1 .O and 2.0 pg/ml pooled (-).
an additional 40 min of growth in transformation medium in the DNA-UV treatment as compared to
the UV-DNA treatment. This additional time results in higher cell densities and hence lower effective killing in the DNA-UV treatments (data not shown). In spite of this fact that there is less killing in the DNA-UV treatment for a specified UV dosage, the Trp+ cells did worse at each UV dosage in the DNA- UV treatments than in the UV-DNA treatments (Fig- ure 1, A and B; see also Figure 2). T h e two regression lines for Trp+ cells in Figure 1, A and B (UV-DNA and DNA-UV treatments respectively), are statistically different in slope at the P
<
0.001 level. In addition, using an analysis of covariance, we found that the interaction of treatment (UV-DNA and DNA-UV) with UV was statistically significant for Trp+ cells at theP
<
0.0001 level.In Figure 2, the survival of
Trp+
cells only are plotted for the UV-DNA and DNA-UV treatments (same data as in Figure 1). T h e two highest (1 .O and2.0 Ng/ml) and two lowest (0.01 and 0.10 pg/ml) DNA concentrations are pooled separately for the UV-DNA treatments, whereas all DNA concentrations are pooled for the DNA-UV treatment. There was no detectable effect of DNA concentration on cell sur- vival except for the Trp+ cells in the UV-DNA treat- ments (Figure 2). As detailed in Table 1, all regres- sions have an estimated slope which is significantly different from zero while the estimated intercept did
TABLE 1
Regression analyses for data in figures 1,2,4 and 5
Coefficients T 4
Survivorship UV-DNA
MG+ -0.0180****, 0.000081**** 0.91
TBAB -0.0160**** 0.84
TRP+ (all)b -0.0099**** 0.54
TRP+ (low)’ -0.0086**** 0.50
TRP+ (high)d -0.01 lo**** 0.64
MG+ -0.0070**** 0.39
TBAB -0.0130**** 0.77
TRP+ (all) -0.0170**** 0.62
DNA-UV
Transformation Rate UV-DNA
TBAB (high) 0.0035** 0.23
TBAB (low) 0.0077**** 0.43
MG+ (high)’ MG+ (Iow)’
Plasmid DNA 0.00 14 0.04
TBAB (all) -0.0028**** 0.43
MG+ (all) -0.0083**** 0.52
Data are for homologous DNA experiments except where noted otherwise. Tests for differences between regressions are discussed in the text. In all cases the estimated intercept term of the regression was not different from zero.
**
P < 0.01;****
P < 0.0001,The coefficients correspond to the x and x‘ terms, respectively. Low DNA concentrations, 0.1 and 0.01 $g/ml, pooled.
High DNA concentrations, 1.0 and 2.0 $g/ml pooled. DNA-UV
*
All DNA concentrations are pooled.‘ No regressions could be fit with coefficients significantly differ- ent from zero.
not differ significantly from zero (1 .O on a log scale). As shown in Figure 2, the concentration of DNA affected a transformed cell’s survival in the UV-DNA treatment, with increased survival in the face of UV at lower DNA concentrations (see also Figure 4). In an analysis of covariance, this interaction effect of DNA concentration and UV in the UV-DNA treat- ment is statistically significant at the P
<
0.0001 level. T h e two regression lines for the two pooled DNA concentrations in the UV-DNA treatments are statis- tically different in slope at the P<
0.001 level, There- fore the greater survivorship of Trp+ cells as com- pared to total cells shown in Figure l a obscures the even greater differences which exist at lower DNA concentrations.Transformation rates for homologous
DNA
ex-periments Figure 3 shows that the absolute transfor- mation rates increased with the concentration of ho- mologous DNA over the range of DNA concentra- tions from 0.01, pg/ml to 2.0 pg/rnl, with saturation at levels greater than I .O p g f m l . Although not shown here, transformation rates at the metB.5 locus were similar.
Evolution of Transformation
nl.
"1
J1
00001
o a2 0 4 0.6 0.8 to 1 2 14 1.6 1 8 2 0
DNA Concentration (pglrnl)
FIGURE 3.-Transformation rate as a function of homologous DNA concentration. Results are given for total viable cells plated on MG+. Similar results were obtained on TBAB. Error bars give mean f standard error. Sample size is given by each mean. See text for further explanation. Key: strain YB886 at 0 J/m' (0); strain YB886 at 50 J/m' (0) in UV-DNA treatment.
the transformation rate and UV dosage for the same experiments plotted in Figures 1 and 2, since the transformation rate preserves the relationship be- tween the numbers of transformed cells and the num- bers of total cells at each UV dose for each particular experiment. This relationship is lost when only the survivorships of cells are compared (Figures 1 and
2).
The transformation rate at a given UV dosage is the following ratio,
N T ~ + , u v NTot,UV '
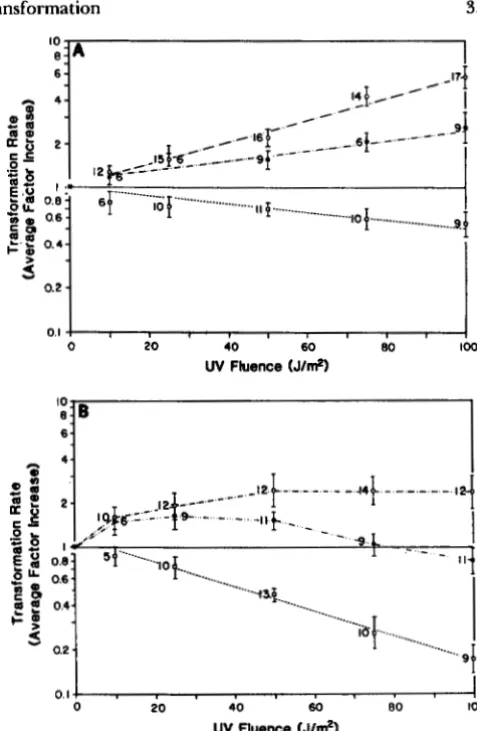
in which NTrp+,uv and N T ~ ~ , u v are the numbers of transformants and total cells (either on MG+ or TBAB), respectively, which survive a given UV dose. Because of the difference in the absolute magnitude of the transformation rate at different concentrations of transforming DNA (Figure 3), we calculated for each experiment the ratio of the transformation rate at each UV dose to the transformation rate at 0 J/m' UV dose. Averages of the log of this ratio over mul- tiple experiments are termed "average factor in- crease" in Figure 4. Values greater than 1.0 indicate an increase, and values less than 1.0 indicate a de- crease, in the transformation rate after UV treatment from what it was with no UV (0 J/m').
Figure 4, A and B, plots the average factor increase for the two kinds of media used to determine total cells. As indicated in Figure 4, there is a consistent and qualitative difference between the UV-DNA and DNA-UV treatments in the relationship between the transformation rate and UV dosage for the rec+ strain (YBSSS). In this strain, the transformation rate in- creases with UV dose in the UV-DNA experiments but decreases with UV dose in the DNA-UV treat- ments. This explains the positive association of com-
10 .3p
0 20 40 60 BO 1 0 0
0.1 J I
0 20 40 60 BO 1 0 0
UV Fluence (Jim21
FIGURE 4.-Change in transformation rate as a function of UV dosage for YB886 for homologous DNA transformation. Points given are averages of the log of the ratio of the transformation rate at the specified UV dose divided by the transformation rate at the no UV dose for the same experiment. Transformation rate at a given UV dose is defined as NT~+,uv/NT~.uv. Total cells counted on TBAB (A) and total cells counted on MG+ (B). Error bars give mean f standard error. Sample size is given by each mean. See text for further explanation and discussion of statistical tests. See Table 1 for information on regression equations. Key for means: UV-DNA treatment, 0.01 and 0.1 & n l pooled (0); UV-DNA treatment, 1 .O
and 2.0 pg/ml pooled (0); DNA-UV treatment, 0.1 and 1.0 and
2.0 &nl pooled 0. Key for regressions: UV-DNA treatment, 0.01 and 0.1 & n l pooled (.-.-); UV-DNA treatment, 1.0 and 2.0 Pg/ml pooled (.
.
e-); DNA-UV treatment, 0.1 and 1.0 and 2.0pg/ml pooled (-).
petence and damage demonstrated by YASBIN (1 977),
LOVE and YASBIN (1 984) and LOVE, LYLE and YASBIN
(1 985) by showing that damage causes increased trans- formation rather than transformation causing in- creased repair.
In the UV-DNA treatments, the concentration of DNA affects the magnitude of this increase with lower DNA concentrations giving a steeper rise in the av- erage factor increase with increasing UV dose (Figure
36 R. E. Michod, M. F. Wojciechowski and M. A. Hoelzer
UV-DNA regressions have an estimated slope which is different from zero and an estimated intercept which is not significantly different from zero (one on a log scale). These two regressions for high DNA concentration (1 .O and 2.0 pg/ml) and low DNA con- centration (0.0 1 and 0.10 pg/ml) are statistically dif- ferent from each other in slope (P
< 0.001). T h e
regressions for 0.0 1 and 0.10 pg/ml were not statisti- cally different from one another, nor were the regres- sions for 1.0 and 2.0 pglrnl. For this reason the data in the UV-DNA treatment were pooled as indicated. In the DNA-UV treatment on TBAB (Figure 4A), the slope differs from zero at the P<
0.001 level (Table 1). For MG+ medium in the DNA-UV treatment the slope is statistically different from zero at the P<
0.0001 level and the intercept does not differ from one. On MG+ medium in the UV-DNA treatment no statistical model could be found which fits the data in the sense that the estimated coefficients were all sig- nificantly different from zero. Consequently, the
means are simply connected by straight lines in Figure 4B. In Figure 4B, there appears to be a maximum transformation rate in the 25-50 J/m' range depend- ing on DNA concentration. It is worth noting that UV induction of the major Rec protein (recE gene product) in B. subtilis is maximal in this UV range (P. LOVE and C. LOVETT, personal communication).
Upon comparing transformation rates between UV- DNA and DNA-UV experiments (Figure 4) one result is consistent. T h e transformation rate in UV-DNA experiments increases with increasing UV, while in the DNA-UV experiments the transformation rate decreases with increasing UV. Similar results were obtained for transformation at the metB5 locus (un- published results). We have attributed this result to the difference between the order of UV irradiation and addition of DNA in the two treatments. However, there is another difference between the two treat- ments. In the UV-DNA experiments, cells were given 30 min incubation in GM2 medium after UV irradia- tion to allow for transformation, whereas in the DNA- UV experiments the cells were transformed first then plated immediately after UV irradiation. It is possible that in the UV-DNA treatment, the 30-min postirra- diation incubation period might allow time for some process, such as excision repair, to occur preferentially in competent cells. This could result in the differential survival of competent cells relative to the noncompe- tent or total population (R. YASBIN, personal com- munication). T o determine whether this could ac- count for our results, several sets of DNA-UV exper- iments, similar to those described in the experimental procedures, were performed. YB886 cells were grown
to competence in GM1-GM2, transformed with 1 pg/ ml of YBlOl 1 DNA for 30 min and then exposed to UV doses of 25, 50, 75 and 100 J/m'. A sample of
these cells were then diluted and plated. A second sample was resuspended in GM2 and incubated with aeration for 30 min before plating. We find no de- tectable difference in the survival of transformed cells between those plated immediately after UV damage and those given a 30 min incubation in growth me- dium before plating (data not shown). These results indicate that the difference in survival of transformed cells @ e . , competent cells), as well as total cells, in the UV-DNA and DNA-UV experiments was not due to this aspect of the experimental procedure.
In the DNA-UV treatments, it is possible that trans- forming DNA was damaged by the UV irradiation. We think that this is an unlikely possibility, since studies on the kinetics of transformation indicate that transformation takes only a few minutes to be com- pleted (DUBNAU 1982). Consequently, we expect transformation to be completed at the time of the UV treatment. Nevertheless, it is conceivable that UV- damaged DNA could be taken up by competent cells and integrated thereby resulting in a decrease in the transformation rate in our DNA-UV treatment. To test this hypothesis, competent cells were incubated with YBlOll DNA at 1 pg/ml, UV-irradiated at 50 J/m' at various times from 10 to 120 min after the
addition of transforming DNA, and then plated as described previously. Transformation frequencies were maximal when cells were incubated with trans- forming DNA for 30-45 min prior to UV irradiation (data not shown) as was done in our standard DNA- UV treatment. This same period of time also resulted in maximal transformation rates in the un-irradiated controls. Thus, under the conditions employed in our standard DNA-UV treatment, the transformation rate was not decreased as a result of the incoming DNA being subject to UV-induced damage prior to its in- corporation into the recipient chromosome.
Evolution of Transformation 37
UV-DNA experiments. In B. subtilis, plasmid DNA- mediated transformation proceeds by the same path- ways of binding, uptake, and processing as linear duplex chromosomal DNA, but does not require ho- mologous recombination (rec) functions to achieve transformation, since the transforming DNA is not recombined into the bacterial chromosome but simply resides in the cell as an extrachromosomal DNA ele- ment (DUBNAU 1982). Therefore, transforming plas- mid DNA should not result in any repair benefit to a competent cell which depends upon homology nor should plasmid transformation rates increase as a di- rect result of increased synthesis of proteins involved in homologous recombination.
There is no statistically significant effect of UV dose on plasmid transformation rates (Table 1). A plot of the means over ten experiments suggests a trend of increasing transformation rate with increasing UV (data not shown). However, this trend is not even close to significance at the P = 0.05 level.
DISCUSSION
The central result of our experiments is that an increased level of UV radiation increased the homol- ogous DNA transformation rate in the case of the UV-DNA experiments and decreased the transfor- mation rate in the case of the DNA-UV treatments. We suggest three hypotheses for why the transfor- mation rate might change with increasing prior dose of a damaging agent. (1) Transformation may be inducible by DNA damage. For example, the trans- formation rate might be higher at a higher UV dose because cells bind, take up or recombine more DNA at the higher dose than at a lower dose. (2) Competent cells and noncompetent cells may have different sur- vivals in a damaging environment. For example, com- petent cells might have a lower survival than non- competent cells because competence is costly (this appears to be a factor) (NESTER and STOCKER 1963;
M. A. HOELZER, unpublished data). On the other hand, competent cells might have a higher survival than noncompetent cells either (2a) because of trans- formational repair or (2b) because competent cells have more effectively induced SOS-associated DNA repair (not involving transformational repair) than non-competent cells. This induced SOS-associated re- pair could result from the competence-specific ampli- fication of cellular levels of the major recombination protein in B. subtilis (recA analog) that is independent of any DNA damage (LOVE 1986; P. LOVE and C. LOVETT, personal communication). (3) The cells which become competent may be more hcrdy cells to begin with and so survive a challenge like UV radia- tion better than noncompetent cells.
We think that the third hypothesis is an unlikely explanation for our results. It is difficult to see how
differences in the initial health of cells could explain the qualitative difference between the DNA-UV and UV-DNA results, since these differences should be present in both treatments.
It is also difficult to see how hypothesis (2b) could explain the difference between the DNA-UV and UV- DNA treatments. To explain the difference, in partic- ular the decreasing transformation rate in the DNA- UV experiments, hypothesis (2b) would have to pos- tulate that transformation of competent cells results in an inhibition of the UV-inducible SOS response and/or normal levels of excision repair in competent cells. However, just the opposite is more likely to be
the case, because of the higher levels of the major recombination protein with concomitant induction of the SOS response (P. LOVE and C. LOVETT, personal communication) and higher levels of single-stranded gapped regions (HARRIS and BARR 1971) in compe- tent cells.
This leaves transformation induction by UV (hy- pothesis 1) or direct fitness differences due to trans- formational repair (hypothesis 2a) as likely explana- tions for our results. Note that there is the possibility of transformation induction or a fitness benefit from transformational repair in the UV-DNA treatments but not in the DNA-UV treatments. As already pointed out either hypothesis supports the view that transformation functions in DNA repair. In the case of transformation induction by damage, cells are in- ducing sex in precisely the environment predicted by the repair hypothesis.
The lack of any significant effect of prior UV dos- age on the plasmid transformation rate (Table 1) rules out UV induction mediated through increased bind- ing and/or uptake of DNA as the explanation for our homologous DNA results. However, it does not rule out UV induction mediated through a homologous recombination pathway, since plasmid transformation does not depend on homologous recombination func- tions. The plasmid result is also consistent with hy- pothesis (2a), since there should be no fitness benefit from plasmid DNA, and, indeed, the effect of UV dose on transformation, which is so apparent in the homologous UV-DNA experiments, goes away in the plasmid UV-DNA experiment. Thus, although our empirical results do not conclusively distinguish be- tween transformation induction or transformation re- pair, they clearly support the repair hypothesis.
38 R. E. Michod, M. F. Wojciechowski M. and A. Hoelzer
transformational repair of a particular lethal damage should approximately equal the transformation rate. Assuming that transformational repair benefits a cell by repairing a single lethal damage and that the dis- tribution of damages is Poisson, a simple calculation shows the benefit of transformational repair to be only 1 +p, where p is the mean number of lethal DNA damages per cell and x is the transformation rate. Since x is 1 O-*- 1 0-4 (Figure 3) and p can be calculated to be between 1 and 3 in our experiments, the calcu- lated benefit on these assumptions is small. However, there are several factors which are ignored by this calculation. First, competent cells may take in more DNA after they are damaged then when they are undamaged, although this appears unlikely in light of our plasmid DNA results discussed above. Second, there may be targeted uptake of DNA homologous to damaged sites. Nevertheless, it seems unlikely based on first principles that fitness differences directly ex- plain the differences in transformation rates observed here in the DNA-UV and UV-DNA experiments. However, such small fitness differences may be indi- rectly responsible for our results. When operative over long periods of time, small fitness effects can select for large phenotypic responses, such as induction of transformation in damaging environments.
Since competent cells bind DNA, it is not surprising that there is an effect of the level of DNA concentra- tion on the change in transformation rate with prior
UV. It appears that saturating amounts of transform- ing DNA (1 and
2
pg/ml experiments) are less bene- ficial, or possibly deleterious, to competent cells when they are in a DNA-damaging environment. It can be estimated that these saturating levels of DNA corre- spond to the equivalent of four to eight chromosomes(ca. 5000 kilobase pairs of DNA per chromosome) on a per cell basis, whereas, in our 0.01 and 0.1 Hg/ml treatments there are approximately 0.025 to 0.25
chromosome equivalents for every cell. We believe that the lower DNA concentrations more closely a p proximate natural and physiologically relevant levels of DNA, however the exact nature of the DNA effect remains unresolved by our experiments.
We have used a strain of B. subtilis which has no DNA damage-inducible prophages. Such phages oc- cur in laboratory strains (1 68 and derivatives) and in natural strains and are induced by UV more efficiently in competent than in noncompetent cells (YASBIN
1977; F. COHAN, unpublished data). Consequently they represent an additional cost of sex which is not addressed in the work reported here. We have chosen to ignore this effect in the present work for two reasons. First, we wish to test whether there is a benefit and/or induction of transformation in a dam- aging environment. It is another matter, one which we intend to address in subsequent work, whether any
benefit and/or induction of transformation is over- come by the cellular costs of transformation. Second, although prophage induction appears to be a cost of competence in this particular organism and perhaps in other species of naturally competent bacteria, we do not see it as a cost of sex in general. By the repair hypothesis the benefit of repair should be a general one and, in an initial study, we do not wish to study its effects when they are confounded by factors which do not generalize in a similar manner.
We have chosen UV radiation as a damaging agent for several reasons. First, it occurs naturally and pre- sumably is an important factor in the survival of B.
subtilis, which has evolved a variety of mechanisms to cope with it (for review see YASBIN 1985). Second, UV radiation is easy to work with and pulse dosage is possible. Finally, although UV induced damages are primarily of the single-strand variety (HARM 1980),
there appears to be sufficient numbers of double- strand damages introduced by UV for them to be a major source of cell mortality. For example, we expect
(R.
E. MICHOD, unpublished calculations) an average of 2-3.3 cross-links per genome for the lower UV fluences used in our experiments. Only a single un- repaired interstrand cross-link is sufficient to kill anE. coli cell (MAGANA-SCHWENCKE et al. 1982). Conse- quently, double-strand damages introduced by UV are expected to be an important source of mortality in our populations.
The work reported here was primarily undertaken with the aim of testing predictions of the repair hy- pothesis and was not intended to conclusively distin- guish between the repair hypothesis and variation hypotheses (see appropriate chapters in MICHOD and LEVIN 1987) or food hypotheses (STEWART and CARL-
SON 1986) as explanations for natural transformation. However, it is worth noting that a variation based hypothesis could not explain the differences observed here, since the cultures used were clonal derivatives of a common ancestor and differed at few loci. Like- wise it is difficult to see how the hypothesis that transformation functions to take in exogenous DNA
for use as “food” could explain the difference ob- served between our UV-DNA and DNA-UV treat- ments.
level is needed to put our interpretation of our results on firm ground.
This work was supported by National Institutes of Health grants R 0 1 GM 36410 (R.E.M.) and KO4 HD00583 (R.E.M.). We are especially grateful to HARRIS BERNSTEIN for the many discussions we have had with him concerning this project. We thank STEVE
ABEDON. CAROL BERNSTEIN, JIM BROWN, FRED COHAN, VIVIAN
GAGE, DONAL HICKEY. CONRAD ISTOCK, BRUCE LEVIN, JOHN LIT-
TLE, PAUL LOVE, JUDY MACDOUGALL, NEIL MENDELSON. ROSEMARY
REDFIELD, JOHN SPIZIZEN, BRUCE WAISH, TOM WHITTAM and
RONALD YASBIN for discussion and comment on this work. We thank two anonymous reviewers for their helpful suggestions on the manuscript. The work reported here stems from a project begun by one of us (R.E.M.) with FRED COHAN in the laboratory of
JOHN SPIZIZEN in the Department of Microbiology and Immunol-
ogy, University of Arizona. We gratefully acknowledge HARRIS BERNSTEIN, FRED COHAN, VIVIAN GAGE, JOHN SPIZIZEN and the Department of Microbiology and Immunology for their roles in initiating this project. We thank PAUL LOVE, RONALD YASBIN and
JOACHIM MESSING for the gift of the strains used in this work.
L I T E R A T U R E C I T E D
BERNSTEIN, H., G. S. BYERS and R. E. MICHOD, 1981 Evolution of sexual reproduction: importance of DNA repair, comple- mentation and variation. Am. Nat. 117: 537-549.
BERNSTEIN, H., F. A. HOPF and R. E. MICHOD, 1987a Is meiotic recombination an adaptation for repairing DNA, producing genetic variation, or both? pp. 139-160 In: The Evolution of
Sex: An Examination of Current Ideas, Edited by R. E. MICHOD and B. LEVIN. Sinauer Associates, Sunderland.
BERNSTEIN, H., F. A. HOPF and R. E. MICHOD, 1987b The molec- ular basis of the evolution of sex. Adv. Genet. 24: 323-370. BERNSTEIN, H., H. C. BYERLY, F. A. HOPF and R. E. MICHOD,
1984 Origin of sex. J. Theor. Bioi. 1 1 0 323-351.
BERNSTEIN, H., H. C. BYERLY, F. A. HOPF and R. E. MICHOD, 1985a The evolutionary role of recombinational repair and sex. Int. Rev. Cytol.
96.
1-24.BERNSTEIN, H., H. C. BYERLY, F. A. HOPF and R. E. MICHOD, 1985b Genetic damage, mutation and the evolution of sex. Science 2 2 9 1277-1281.
BERNSTEIN, H., H. C. BYERLY, F. A. HOPF and R. E. MICHOD, 1985c DNA repair and complementation: The major factors in the origin and maintenance of sex. pp. 29-45. In: Origin and Evolution of Sex, Edited by H. 0. HALVORSON. Alan R. Liss, New York.
BOYLAN, R. J., N. H. MENDELSON, D. BROOKS and F. E. YOUNG, 1972 Regulation of the bacterial cell wall: analysis of a mutant of Bacillus subtilis defective in biosynthesis of teichoic acid. J. Bacteriol. 110: 281-290.
DUBNAU, D., 1982 Genetic transformation in Bacillus subtilis. pp. 148-175. In: The Molecular Biology of the Bacilli, Vol. 1. Edited by D. A. DUBNAU. Academic Press, New York.
HARM, W., 1980 Biological Effects of Ultraviolet Radiation. Cam- bridge University Press, Cambridge.
HARRIS, W. J., and G. C. BARR, 1971 Structural features of DNA in competent Bacillus subtilis. Mol. Gen. Genet. 113: 316-330. LOVE, P. E., 1986 Characterization of the inducible SOS-like
response in Bacillus subtilis. Ph.D. thesis University of Roches- ter, Rochester, N.Y.
LOVE, P. E., and R. E. YASBIN, 1984 Genetic characterization of the inducible SOS-like system of Bacillus subtilis. J. Bacteriol.
LOVE, P. E., M. J. LYLE and R. E. YASBIN, 1985 DNA-damage- inducible (din) loci are transcriptionally activated in competent
Bacillus subtilis. Proc. Natl. Acad. Sci. USA 82: 6201-6205. MAGANA-SCHWENCKE, N., J-A. P. HENRIQUES, R. CHANET and E.
MOUSTACCHI, 1982 The fate of 8-methoxypsoralen photoin- duced crosslinks in nuclear and mitochondrial yeast DNA: comparison of wild-type and repair deficient strains. Proc. Natl. Acad. Sci. USA 7 9 1722-1726.
MANIATIS, T., E. F. FRITSCH and J. SAMBROOK, 1982 Molecular Cloning. A Laboratory Manual. Cold Spring Harbor Laboratory, Cold Spring Harbor, N.Y.
MICHOD, R. E., and B. R. LEVIN (editors), 1987 The Evolution of
Sex: An Examination of Current Ideas. Sinauer Associates, Sun- derland.
MILLER, J. H., 1972 Exferiments in Molecular Genetics. Cold Spring Harbor Laboratory, Cold Spring Harbor, N.Y.
MITA, I., Y. SADAIE and T. KADA, 1983 DNA repair in competent cells of Bacillus subtilis. J. Bacteriol. 155: 933-936.
NESTER, E. W., and B. A. D. STOCKER, 1963 Biosynthetic latency in early stages of deoxyribonucleic acid transformation in Ba- cillus subtilis. J. Bacteriol. 8 6 785-796.
NETER, J.. and W. WASSERMAN, 1974 Applied Linear Statistical Models. Richard D. Irwin, Inc. Homewood, Ill.
SILHAVY, T. J., M. L. BERMAN and L. W. ENQUIST, 1984 Experiments With Gene Fusions. Cold Spring Harbor Laboratory, Cold Spring Harbor, N.Y.
SOMMA, S., and M. POLSINELLI, 1970 Quantitative autoradi- ographic study of competence and deoxyribonucleic acid in- corporation in Bacillus subtilis. J. Bacteriol. 101: 851-855. SPIZIZEN, J., 1958 Transformation of biochemically deficient
strains of Bacillus subtilis by deoxyribonucleate. Proc. Natl. Acad. Sci. USA 44: 1072-1078.
STEWART, G. J., and C. A. CARLSON, 1986 The biology of natural transformation. Annu. Rev. Microbiol. 4 0 21 1-235.
SULLIVAN, M. A., R. E. YASBIN and F. E. YOUNG, 1984 New shuttle vectors for Bacillus subtilis and Escherichia coli which allow rapid detection of inserted fragments. Gene 2 9 21-26. VIEIRA, J., and J. MESSING, 1982 The pUC plasmids, an M13mp7-
derived system for insertion mutagenesis and sequencing with synthetic universal primers. Gene 1 9 259-268.
YASBIN, R. E., 1977 DNA repair in Bacillus subtilis. 11. Activation of the inducible system in competent bacteria. Mol. Gen. Genet.
YASBIN, R. E., 1985 DNA repair in Bacillus subtilis. pp. 33-52. In: The Molecular Biology of the Bacilli, Vol 2. Edited by D. A.
DUBNAU. Academic Press, New York.
YASBIN, R. E., P. I. FIELDS and B. J. ANDERSEN, 1980 Properties of Bacillus subtilis 168 derivatives freed of their natural pro- phages. Gene 12: 155-159.
YASBIN, R. E., G. A. WILSON and F. E. YOUNG, 1975
Transformation and transfection in lysogenic strains of Bacillus subtilk evidence for selective induction of prophage in com- petent cells. J. Bacteriol. 121: 296-304.
1 6 0 910-920.
153 219-225.