Volume 2010, Article ID 981045,10pages doi:10.1155/2010/981045
Research Article
Active Sonar Detection in Reverberation via
Signal Subspace Extraction Algorithm
Wei Li,
1QinYu Zhang,
1Xiaochuan Ma,
2and Chaohuan Hou
21Communication Engineering Research Center, Shenzhen Graduate School, Harbin Institute of Technology, Shenzhen,
Guangdong 518055, China
2Institute of Acoustics, Chinese Academy of Sciences, Beijing 100190, China
Correspondence should be addressed to Wei Li,[email protected]
Received 29 November 2009; Revised 26 March 2010; Accepted 3 June 2010 Academic Editor: Zheng Zhou
Copyright © 2010 Wei Li et al. This is an open access article distributed under the Creative Commons Attribution License, which permits unrestricted use, distribution, and reproduction in any medium, provided the original work is properly cited.
This paper presents a new algorithm called Signal Subspace Extraction (SSE) for detecting and estimating target echoes in reverberation. The new algorithm can be taken as an extension of the Principal Component Inverse (PCI) and maintains the benefit of PCI algorithm and moreover shows better performance due to a more reasonable reverberation model. In the SSE approach, a best low-rank estimate of a target echo is extracted by decomposing the returns into short duration subintervals and by invoking the Eckart-Young theorem twice. It was assumed that CW is less efficiency in lower Doppler than broadband waveforms in spectrum methods; however, the subspace methods show good performance in detection whatever the respective Doppler is. Hence, the signal emitted by active sonar is CW in the new algorithm which performs well in detection and estimation even when low Doppler is low. Further, a block forward matrix is proposed to extend the algorithm to the sensor array problem. The comparison among the block forward matrix, the conventional matrix, and the three-mode array is discussed. Echo separation is also provided by the new algorithm. Examples are presented using both real, active-sonar data and simulated data.
1. Introduction
A major problem in moving platform active sonar systems is the detection of targets in reverberation. Reverberation is caused mainly by the multiple reflections, diffusions, or diffractions of the transmitted signal by the surface and bottom interfaces. When the target is close to one interface, the target echo is hidden in the reverberation resulting in a low signal-to-reverberation ratio (SRR). Moreover, since the reverberation is strongly correlated with the signal, classical detection methods like matched filtering (MF) are inefficient. In order to improve detection, we can use a model of reverberation, but a correct model is difficult to find because reverberation contains both diffuse components (which look like noise) and also more discrete components (which look like signal). If a global statistical description of reverberation is available, like a reverberation scattering function, the structure of the theoretical optimal receiver is known [1]. Generally, this is not the case and a simplified model is used.
One often used statistical model considers reverberation as nonstationary, colored noise. This approach is used in [2] for monochromatic transmitted signals and in [3] for wide-band signals. In [4], they show that algorithms based on this approach have some problems when the Doppler shifts of reverberation and target echo are similar. Further, this model does not take advantage of the connection between reverberation and the transmitted signal.
This algorithm originally assumes that noise is completely different from the searched signal. But [4] shows that PCI algorithm can separate several similar echoes (which means echoes with slight time shift or/and Doppler shift) differing in powers.
PCI is applied to detection in presence of reverberation by taking reverberation as a sum of echoes with higher power than target echoes. PCI algorithm separates the received data into two parts: reverberation and target echoes. By this means we detect targets. However, even when rever-beration power is high, there are still some reverrever-beration echoes with lower power. The sum of these lower rever-beration echoes sometimes makes a strong confusion with targets.
In this paper, we present a new algorithm named Signal Subspace Extraction (SSE) based on a more real-life model. The SSE algorithm divides the reverberation with target echoes into three parts: higher reverberation echoes, target echoes, and lower reverberation echoes. It makes use of a low rank characteristic of the target echo subspace and separates the signal subspace via the singular value decomposition (SVD) method. PCI separates the reverberation and the target echo by invoking Eckart-Young theorem [7] while SSE extracts the signal by invoking Eckart-Young theorem twice.
Broadband waveforms are generally preferred to contin-uous wave (CW) in low Doppler [8] when using spectrum methods. However, the subspace algorithms are efficient in whatever the respective Doppler is [4, 9]. Hence, in this paper, CW is brought back into use and shows good per-formance in signal extraction and estimation by experiments with real and simulated reverberation.
In [10], a three-mode array is brought for PCI for sensor array problem, and the detection is improved by the three-mode array. However, the three-three-mode array is a kind of a three dimension matrix. To make it work, the Eckart-Young theorem and SVD have to be extended to a three-dimension problem, too. In this paper, we provide a block forward matrix which is a two-dimension matrix, but this matrix still extends SSE into sensor array problem. SSE with the block forward matrix can be regarded as a new algorithm of Space Time Adaptive Process [11] which jointly processes received data in angle and Doppler to improve the separation of target echo and reverberation. The comparison among block forward matrix, traditional matrix, and three-mode array is also presented.
Section 2 quickly reviews the classical
detection/esti-mation hypothesis, the Block Normalized Matched Filter (BNMF). Section 3 presents the SSE algorithm and gives results with adapted real temporal data.Section 4presents the block forward matrix and extends the algorithm to sensor array problem and discusses the property of the new matrix in comparison with the conventional matrix in [4] for PCI.
InSection 4.3, experiments are taken by simulation of space
time reverberation in comparison between PCI and SSE. We also give the examples of comparison results among block forward matrix, traditional matrix, and three-mode array.
2. Detection/Estimation Problem in
the Presence of Reverberation
The detection problem is written as follows:
H0:x(t)=n(t) +r(t),
H1:x(t)=s(t) +n(t) +r(t),
(1)
where x(t) is the observed or received signal, r(t) is the reverberation noise generated by the transmitted signal, and n(t) represents white noise. The signal emitted by the active sonar is assumed to be a CW.s(t) is the signal to be detected. We assume here that it is linked to the emitted signale(t) in a simple way:s(t) is differed from the emitted signal by a time delayτ, a Doppler shift fd, and an amplitude attenuationA
in the block where signal presents
s(t)=Ae(t−τ) exp2π j fdt
, (2)
and letxnbe the sampled vector of x(t) and let sn be the
sampled signal, whereT =1/ fsis the the sampling interval
and we sampled at timet=nT:
where fd/ fsis named as normalized Doppler Frequency. All
signals are complex valued and represent the sonar output after complex demodulation. We work with time-sampled signals.
2.1. Detection/Estimation Algorithms. As the reverberation
is nonstationary, we propose to build a block-by-block detector. The received signal is divided into blocks for processing. The reverberation is assumed stationary in each block. This means that A and fd are not changed during
the block time. The detection and estimation are performed block by block. The length of each block isN. The statistic test of the Block Normalized Matched Filter (BNMF) [4] is applied to each block after SSE for detection and estimation. For theithblock, the statistic test of the BNMF is written as
Li
common divisor of the nominator and denominator, it is deleted from the equation.τ is decided due to the block in which a target is detected. Hence,fdis the only parameter we
need to estimate from (5).Li(fd) is computed on each block
and for different Doppler shifts fd = kdfs. The parameter
fs (sampling rate for the estimation of fd) is determined
and it is also the number of Doppler samples. The BNMF algorithm allows one to obtain a vectorLi(fd). Hypothesis
H1 is chosen if maxkdLi(fd) is larger than a given threshold
η. In addition, this maximum estimates the corresponding Doppler frequency.
3. One-Dimensional Signal Subspace Extraction
We model reverberation as a sum of echoes issued from the transmitted signal which implies that reverberation and the target echoes share almost the same properties.
By cuttingxintoXi, the forward matrixYi is generated
by
whereNis the block length andpis chosen close toN/2. It is well known that a vector, which is a linear combination of k complex exponentials, can be made into the forward matrix above, and the matrix will have rankk, if min(p,N−
p+ 1) ≥k[5]. However, since for the reverberation echoes k min(p,N−p+ 1), reverberation echoes span the full space of matrixYi. In the context of the real data of interest,
if one assumes that the reverberation or target echoes are well approximated by a series of CW suitably scaled, the rank of target echoes subspace is low because for target echoes k≤min(p,N−p+ 1) in the matrix in most detection cases. The SSE algorithm consists of decomposingYiinto three
matricesYri1,Ysi, andYri2:
Yi=Yri1+Yoi =Yir1+Ysi+Yri2, (7)
whereYr
i = Yri1+Yri2 is the reverberation plus white noise
subspace and Ys
i is the received signal dominant subspace.
As reverberation power is stronger than received signal in most cases, according to Eckart-Young theorem and [4], Yri1 is the bestr-rank approximation ofYi if r is the rank
of dominant reverberation subspace. After we delete the dominant reverberationYri1, the residual matrix contains the target echoes, residual reverberation, and noise, and target echoes become the principal component in the residual matrix. Then we use Eckart-Young theorem for the second time. Ysi is the best s-rank approximation ofYoi if s is the rank of target echo subspace. The result is obtained via the Singular Value Decomposition(SVD) ofYi:
Yi=UΣVH=
whereUis the left singular-vector matrix ofYi,Vis the right
singular-vector matrix ofYi, andΣis a diagonal matrix which
contains the decreasing singular values ofYi,{σi}(σ1> σ2>
· · ·). VectorXsiis then collected fromYsi. The subspace signal estimation is obtained and thenXsicontains only the signal. The detection processing is done on the vectorXsi.
The rank used to partition the matrix is not known and must be estimated. In the SSE approximation it is determined by following the method suggested in [13]. This procedure uses the partial sums of squared singular values from the SVD of the data matrix as its test statistic. We start testing from the smallest sum and work our way upwards till, for someI, the partial sum exceeds a specified threshold. The singular values are in descending order,{σi}(σ1> σ2>· · ·).
We seek the smallestI,Iminfor which
Imin
i=0
σRY2 −i> Q, (9)
whereRY is the rank ofYi. Following this method, we also
seek the largestJ,Jmaxfor which
Jmax
i=1
σ2
i < P, (10)
whereQandPare the SSE threshold values.Qis related to the higher power of reverberation. The sum ofQandP is related to the whole power of reverberation [4]. The rank is then chosen asr =Jmaxands=RY −Jmax−Imin. From real
cases studied, usuallyQis simplified to the higher power of reverberation, sinceQ P. Hence, the first step of SSE is the same as the PCI procedure including the threshold. And sapproximates to the number of target echoes since for target echoesk≤min(p,N−p+1) in the matrix, if the transmitted signal is CW, and the target echo is present in the block.
The SSE thresholds used here are based upon the background reverberation power and may be set using prior knowledge or derived from the data. IfImin+Jmax≥RY, SSE
does not treat this block. And only whenImin+Jmax ≤ RY,
the SVD is required to determine the signal subspace. A hypothesis is necessary for a correct running of SSE: the rankr1 ofYr1
i must be small. This hypothesis is the same
to PCI and indicates that SSE will fail when SRR is extremely low.
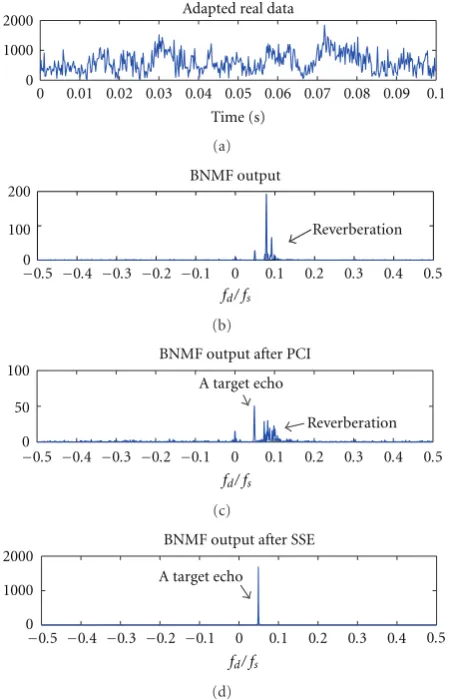
3.1. Experiments. The experiments are performed by
com-parison. They are based on the real data taken from a sea trial in South China Sea. The transmitted signal is CW. Data is received by active sonar. A moving target presents in this trial. The sampling frequency fs is 5 kHz. The normalized
Doppler frequency fd/ fsdue to the moving target is 0.049.
Here we use the normalized Doppler frequency to plot the detection/estimate results. Reverberation is mainly caused by bottom echoes. The BNMF algorithm is applied after PCI and SSE to see the detection improvement. The time series is cut into 0.1 s in each block.
0
0.01 0.02 0.03 0.04 0.05 0.06 0.07 0.08 0.09 0.1 1000
2000 Adapted real data
Time (s) 0
(a)
0.5 0
−0.5 −0.4 −0.3 −0.2 −0.1 0 0.1 0.2 0.3 0.4 100
200
Reverberation BNMF output
fd/ fs
(b)
0.5 −0.5 −0.4 −0.3 −0.2 −0.1 0 0.1 0.2 0.3 0.4
fd/ fs
0 50 100
A target echo
Reverberation BNMF output after PCI
(c)
0.5 −0.5 −0.4 −0.3 −0.2 −0.1 0 0.1 0.2 0.3 0.4
fd/ fs
0 1000 2000
A target echo
BNMF output after SSE
(d)
Figure 1: Adapted active sonar data, BNMF outputs without
processing, and after PCI and SSE with SSR= −12 dB, fd/ fs =
0.049.
Figure 1 shows the results of BNMF outputs without
processing and after PCI and SSE with SRR−12 dB. For PCI and SSE, they both detect the target and give right estimation of normalized Doppler frequency fd/ fs of the target echo
which is 0.049. However, many false alarms appear with PCI while no false alarm is present with SSE in this experiment.
Figure 2 shows the results of BNMF outputs without
processing and after PCI and SSE with SRR −17 dB. It is observed that the target would not be detected with the PCI if only the largest peak is chosen. The false alarms are the consequence of a lack of lower reverberation removal.
Figure 3 shows the results of BNMF outputs without
processing and after PCI and SSE with SRR−22 dB. When SRR is lower, the detection becomes worse: both PCI and SSE give false alarms. But the false alarms are still less and lower with SSE than PCI. The target would not be detected with the PCI if only the largest peak is chosen.
4. Two-Dimensional Signal Subspace Extraction
4.1. Sensor Array BNMF. Consider that the signal is received on a linear array of M sensors. The detectionproblem is
0.1 0
2000 4000
0 0.01 0.02 0.03 0.04 0.05 0.06 0.07 0.08 0.09 Adapted real data
Time (s)
(a)
−0.5 −0.4 −0.3 −0.2 −0.1 0 0.1 0.2 0.3 0.4 0.5
fd/ fs
0 100 200
Reverberation BNMF output
(b)
20 40
Reverberation Target echo
−0.5 −0.4 −0.3 −0.2 −0.1 0 0.1 0.2 0.3 0.4 0.5
fd/ fs
0
BNMF output after PCI
(c)
Target echo
−0.5 −0.4 −0.3 −0.2 −0.1 0 0.1 0.2 0.3 0.4 0.5
fd/ fs
0 1000 2000
BNMF output after SSE
(d)
Figure 2: Adapted active sonar data, BNMF outputs without
processing, and after PCI and SSE with SSR= −17 dB, fd/ fs =
0.049.
described as follows:
H0:xn,m=nn,m+rn,m,
H1:xn,m=sn,m+nn,m+rn,m,
(11)
wherexn,m is the received signal on themthsensor at time
samplen. Let us consider a linear array ofM sensors with equally interelement spacing d. The signal emitted by the active sonar is CW. Then each element ofsn,mis written as
sn,m=Ae(nT−τ) exp
2π j
fd
fs
n+mdcosβ λ
, (12)
whereβ is the direction of target andλ is the wavelength. e(t) is the emitted signal. τ is the time delay. fd is the
Doppler shift.fsis the sampling frequency. Hencefd/ fsis the
normalized Doppler frequency.
and H1 but also estimates the Doppler frequency fd and
azimuthβ. The estimation of the delayτis quantified by the shift between two blocks. For theith block, the statistic test of the BNMF for space time GLRT is
Li
This detector requires the estimation of new parameterβ.H1
is chosen if maxfd,βLi(fd,β)> η.ηis a given threshold.
4.2. Extension of SSE to Senor Array Data. For the sensor
array problem, the SSE algorithm is the same. Only the arrangement of matrixYichanges. Here we propose a block
forward matrix for SSE. The block forward matrix is similar to the block Hankel matrix [15, 16]. The block forward matrix ofxn,mis defined as
where p is chosen close to M/2 and q is chosen close to N/2. If xn,m is composed of one complex exponential, the
block forward matrix has rank one, because each row can be expressed as a complex scale factor times the first row. Matrices (14) and (6) share similar structure: for matrix (6), the shift between two rows or two columns is equal to one sample, and so it is for matrix (14). Hence the rank analysis is the same. The additional degree of freedom given by the spatial dimension leads to easier separation of different echoes.
We are now interested in the separation of two echoes issued from the transmitted signal. As we have known, two different target echoes are represented by different time delays, different directions, or different Doppler frequencies. The consideration of different time delays of echoes turns to the signal present or not after we divide the received data into short time duration. If time delays of two different echoes are the same, which means that two target echoes appear in the same block, it is obvious that two echoes have to be described by different singular values in order to separate them. We have shown that rank of signal subspace is related to number of target echoes differed by frequencies and directions since for CW the target echo vector is composed of different complex exponentials. Then it is easy to separate different target echoes.
BNMF output after PCI
(c)
0
−0.5 −0.4 −0.3 −0.2 −0.1 0 0.1 0.2 0.3 0.4 0.5
fd/ fs
A target echo
BNMF output after SSE
200 400
(d)
Figure 3: Adapted active sonar data, BNMF outputs without
processing, and after PCI and SSE with SSR= −22 dB, fd/ fs =
0.049.
Here we also present the matrix derived in [4]. It is built from the data received on all sensors and has the general form:
whereNis the block length, andMis the number of sensors. Every column corresponds to the output of one sensor. The algorithm described in this section is applied to this matrix. We present the arrangement of the first block to illustrate the structure of this matrix. The matrix is then written as follows:
Yi=
In matrix (17), the shift between two rows is the same and so is between two columns.
−0.4−0.3−0.2−0.1 0 0.1 0.2 0.3 0.4 0.5 20
40 60 80 100 120 140 160 180
fd/ fs
PCI
10 20 30 40 50 60 70 80 90 100
Residual reverberation echoes
A target echo
A
zim
uth
(deg)
(a) PCI output
SSE
0.5 1 1.5 2 2.5
−0.4−0.3−0.2−0.1 0 0.1 0.2 0.3 0.4 0.5 20
40 60 80 100 120 140 160 180
fd/ fs
A target echo
A
zim
uth
(deg)
(b) SSE output
Figure4: PCI and SSE outputs on simulated space-time reverberation.
the block forward matrix is higher than the second matrix. Hence for the full-rank matrix, echoes could be represented by more singular values in block forward matrix. The separation of echoes will be easier. Then, the lengths of the column and the row are nearly the same in block forward matrix but can be quite different in the second matrix in which they completely depend on the number of the sensors and the block length. The number of singular values depends on the shorter one, which means that the data cannot be used in the most efficient way in (16), if the lengths of column and row are different.
4.3. Experiments. Simulations are performed to check the
proposed algorithms in array data in this section. We first consider the reverberation containing one target echo with block forward matrix. Then, reverberation with two target echoes will be used to perform the separation. Finally, the comparison of different matrices will be presented.
4.3.1. Space Time Reverberation Model. Consider a
nar-rowband, M element linear sonar array with a constant intersensor spacing d towed along the x-direction with a velocity v. The complex envelope of the Doppler-shifted reverberation data received at themthsensor at (xm,ym)=
((m−1)d, 0), (x0,y0)=(0, 0) at timetn =τ0+nT, can be
written as [17]
rmn=
θiφl
αθi,φl
ej(2π/λ) cosφl(sinθi(m−1)d+2vsinθinT),
(18)
whereT =1/ fsis the the sampling interval, azimuth−π ≤
θi < π, 1 ≤ i ≤ Mθ, and elevation angle |φl| ≤ φmax,
whereφmax is the multipath elevation angle spread defined
by the critical angle of the ocean acoustic channel.α(θi,φl)
is the complex scatter amplitude from a reverberation patch at rangecτ0/2, wherecis the propagation speed of sound in
water. The total number of reverberation patchesMθNφ
MN.
4.3.2. Signal Extraction. In this experiment, suppose that
there is one target echo with an SRR of−18 dB, normalized Doppler frequency fd/ fs = 0.05, and azimuth β = π/4.
The number of sensors is M = 16 and number of time samples isN=64 in each block. The results of the detector in which block the target is detected are shown inFigure 4. The target is detected after both PCI and SSE. Both show right estimates of the true parameters. However, a lot more false alarms appear with PCI. The superiority of SSE is easily shown.
4.3.3. ROC. The superiority of the proposed detection
scheme is demonstrated from the experiments above. However, to make this claim more precise, we evaluate the experimental performance of the detectors by receiver operating characteristic (ROC) curve where the detection rate is plotted versus the false alarm probability inFigure 6. Monte Carlo simulations were performed comprising 1500 realizations with one target echo present with an SRR of
−12 dB and equally many with reverberation and noise only. The number of sensors is M = 16 and number of time samples isN=16 in each block. The ROC curves are shown
inFigure 6for the detectors using PCI and for the proposed
detectors using SSE. Comparing the two curves, we see that SSE has a higher probability of detection when probability of false alarm is low.
4.3.4. Separation. In the following experiments, the separa-tion performance of SSE will be demonstrated.
−0.4−0.3−0.2−0.1 0 0.1 0.2 0.3 0.4 0.5 0
20 40 60 80 100 120 140 160 180
fd/ fs
1 2 3 4 5 6 7 8 9
A
zim
uth
(deg)
(a) SSE outputs
1 2 3 4 5 6
−0.4−0.3−0.2−0.1 0 0.1 0.2 0.3 0.4 0.5 20
40 60 80 100 120 140 160 180
fd/ fs
A
zim
uth
(deg)
(b) One echo withfd/ fs= −0.05 andβ=3π/8
A
zim
uth
(deg)
−0.4−0.3−0.2−0.1 0 0.1 0.2 0.3 0.4 0.5 20
40 60 80 100 120 140 160 180
fd/ fs
0.2 0.4 0.6 0.8 1 1.2 1.4 1.6 1.8
(c) One echo withfd/ fs=0.05 andβ=π/4
Figure5: Separation performance via SSE with signal power ratio 1 : 0.97.
clearly detected. After we perform a separation on the signal subspace via SVD with different singular values, Figures5(b) and5(c)show a good separation of the two target echoes with different power. And results show good estimates of both target echoes.
In the second experiment of separation, the ratio of amplitude of two target echoes is changed into 1 : 0.5. The result of the detector after SSE is shown inFigure 7(a). When we apply SSE, a few false alarms appear. The echo with higher power is easy to detect, but the less powerful echo is no stronger than the false alarms. However, after the separation performance in Figures7(b)and7(c), the two target echoes are well detected and estimated. This step of performance requires the preknowledge of the power level of each target echo.
4.3.5. Matrix Comparison. We use the conventional matrix
in (16) with the same data as in the first experiment for
Section 4.3.4 above. Results are shown in Figure 8. False
alarms appear with PCI in Figure 8(a). Even with SSE,
0 0.2 0.4 0.6 0.8 1
0 1
0.1 0.2 0.3 0.4 0.5 0.6 0.7 0.8 0.9
Probability of false alarm
P
robabilit
y
o
f
d
et
ec
tion
SRR= −12 (dB)
PCI SSE
Figure6: Experimental ROC curves for PCI and SSE with an SRR
−0.4−0.3−0.2−0.1 0 0.1 0.2 0.3 0.4 0.5 20
40 60 80 100 120 140 160 180
fd/ fs
10 20 30 40 50 60 70 80 90
A
zim
uth
(deg)
(a) SSE outputs
−0.4−0.3−0.2−0.1 0 0.1 0.2 0.3 0.4 0.5 20
40 60 80 100 120 140 160 180
fd/ fs
1 2 3 4 5 6 7 8
A
zim
uth
(deg)
(b) One echo of separation outputs withfd/ fs =0.05 andβ=
π/4
−0.4−0.3−0.2−0.1 0 0.1 0.2 0.3 0.4 0.5 20
40 60 80 100 120 140 160 180
fd/ fs
0.1 0.2 0.3 0.4 0.5 0.6 0.7 0.8 0.9
A
zim
uth
(deg)
(c) One echo of separation outputs withfd/ fs= −0.05 andβ=
3π/8
Figure7: Separation performance via SSE with signal power ratio 1 : 0.5.
the detection in Figure 8(b) is not improved much. The separation of the echoes in Figures8(c)and8(d)fails.
We also show the result of PCI with the three-mode array
[10] in Figure 9. The experiment is arranged in the same
condition withSection 4.3.2. Comparing withFigure 4, the detection/estimation capability is equally the same with the block forward matrix using PCI. And since the three-mode array is a three-dimension matrix, SSE is too complicated to be applied to it and so is the echo separation which [10] is not mentioned either. Hence block forward matrix still performs the best among the three matrices in efficiency and detection/estimation capability.
5. Conclusions
In this paper, we present a new algorithm Signal Subspace Extraction to extract the signal subspace from reverberation. SSE is tested by adapted real signal-channel data and shows good results. Then we derive a block forward matrix and
extend the method to the sensor array problem. Experiments by simulations show the block forward matrix works well with the new algorithm not only in detection of target echoes but also in separation of target echoes.
Appendices
A. Singular Value Decomposition
Given a matrix Am×n whose rank is r and m× n, there
exist two orthogonal matrixesUm×m = (u1,u2,. . .,un) and
Vn×n=(v1,v2,. . .,vn):
A=UΣVT
= r
i=1
ui·σi·viT,
(A.1)
whereΣ=diag(σ1,σ2,. . .,σn)∈Rm×nandσiis the singular
10
Figure8: PCI, SSE, and separation via SSE with conventional matrix.
10
Figure9: PCI output with the three-mode array.
{σi}(σ1 > σ2 > · · ·). (A.1) is called the Singular Value
Decomposition (SVD) ofA.
B. Eckart-Young Theorem
Let the SVD ofAbe given by (A.1) withr =rank(A)≤p=
min{m,n}and the singular values are in descending order,
{σi}(σ1> σ2>· · ·), and define
wherek < p; thenAkis the optimal approximation ofAin
the view of
no. 60702034 and the National Basic Research Program of China under Grant no. 2007CB310606.
References
[1] H. Trees,Detection,Estimation and Modulation Theory, vol. I and III, John Wiley & Sons, New York, NY, USA, 1968. [2] S. Kay and J. Salisbury, “Improved active sonar detection using
autoregressive prewhiteners,”Journal of the Acoustical Society of America, vol. 87, no. 4, pp. 1603–1611, 1990.
[3] V. R. Carmillet, P.-O. Amblard, and G. Jourdain, “Detection of phase—or frequency-modulated signals in reverberation noise,”Journal of the Acoustical Society of America, vol. 105, no. 6, pp. 3375–3389, 1999.
[4] G. Ginolhac and G. Jourdain, “‘Principal component inverse‘ algorithm for detection in the presence of reverberation,”IEEE Journal of Oceanic Engineering, vol. 27, no. 2, pp. 310–321, 2002.
[5] D. W. Tufts, R. Kumaresan, and I. P. Kirsteins, “Data adaptive signal estimation by singular value decomposition of a data matrix,”Proceedings of the IEEE, vol. 70, no. 6, pp. 684–685, 1982.
[6] I. P. Kirsteins and D. W. Tufts, “Adaptive detection using low rank approximation to a data matrix,”IEEE Transactions on Aerospace and Electronic Systems, vol. 30, no. 1, pp. 55–67, 1994.
[7] C. Eckart and G. Young, “The approximation of one matrix by another of lower rank,”Psychometrika, vol. 1, no. 3, pp. 211– 218, 1936.
[8] K. Mio, Y. Chocheyras, and Y. Doisy, “Space time adaptive processing for low frequency sonar,” in Proceedings of the MTS/IEEE Conference and Exhibition (Oceans ’00), vol. 2, pp. 1315–1319, Providence, RI, USA, September 2000.
[9] Y. Li, H. Huang, C. Zhang, and S. Li, “New Schur-type-based PCI algorithms for reverberation suppression in active sonar,” inProceedings of the IEEE International Conference on Acoustics, Speech, and Signal Processing (ICASSP ’05), vol. 4, pp. 641–644, March 2005.
[10] N. L. Le Bihan and G. Ginolhac, “Three-mode data set analysis using higher order subspace method: application to sonar and seismo-acoustic signal processing,”Signal Processing, vol. 84, no. 5, pp. 919–942, 2004.
[11] R. Klemm,Applications of Space-Time Adaptive Processing, The Institution of Electrical Engineers, London, UK, 2004. [12] G. Ginolhac and G. Jourdain, “Detection in presence of
reverberation,” inProceedings of the MTS/IEEE Conference and Exhibition (OCEANS ’00), pp. 1043–1046, Providence, RI, USA, September 2000.
[13] D. W. Tufts and A. A. Shah, “Rank determination in time-series analysis,” in Proceedings of the IEEE International Conference on Acoustics, Speech, and Signal Processing (ICASSP ’94), vol. 4, pp. 21–24, IEEE Computer Society, Washington, DC, USA, April 1994.
[14] W. Li, X. Ma, Y. Zhu, J. Yang, and C. Hou, “Detection in reverberation using space time adaptive prewhiteners,”Journal of the Acoustical Society of America, vol. 124, no. 4, pp. EL236– EL242, 2008.
[15] Y. Hua, “Estimating two-dimensional frequencies by matrix enhancement and matrix pencil,”IEEE Transactions on Signal Processing, vol. 40, no. 9, pp. 2267–2280, 1992.
[16] H. H. Yang and Y. Hua, “On rank of block Hankel matrix for 2-D frequency detection and estimation,”IEEE Transactions on Signal Processing, vol. 44, no. 4, pp. 1046–1048, 1996.