Visualization, characterization and modulation of
calcium signaling during the development of
slow muscle cells in intact zebrafish embryos
CHRIS Y. CHEUNG
1,#,
SARAH E. WEBB
1, DONALD R. LOVE
2and ANDREW L. MILLER*
,1,3 1Division of Life Science and State Key Laboratory of Molecular Neuroscience, The Hong Kong University ofScience and Technology, Hong Kong, PRC, 2School of Biological Sciences, University of Auckland, Auckland, New Zealand and 3MBL, Woods Hole, MA, USA
ABSTRACT Intact zebrafish embryos were used as an in vivo animal model to investigate the role of Ca2+ signaling during the differentiation of slow muscle cells (SMCs) within forming skeletal muscle. Transgenic zebrafish were generated using an -actin promoter that targeted apoaequorin expression specifically to muscle cells. Two distinct Ca2+ signaling periods (CSPs) were visualized in the developing SMCs: between ~17.5-19.5 hours post-fertilization (hpf) and after ~23 hpf, separated by a ~3.5 h Ca2+ signaling quiet period. Further spatial characterization of these Ca2+ signals using confocal fluorescent microscopy and calcium green-1 dextran as a reporter, indicated that the earlier CSP displayed distinct nuclear and cytoplasmic components, whereas the later CSP was predominantly cytoplasmic. Both CSPs consisted of a series of oscillating Ca2+ waves generated at distinct frequencies, while the earlier CSP also displayed a slow rise then fall in the Ca2+ baseline-level. Imaging of cyclopamine- and forskolin-treated wild-type, or smo-/- mutant embryos, where SMCs do not form, confirmed the specific cell population generating the signals. Treating embryos with antagonists indicated that both IP3Rs and RyRs are responsible for generating the temporal characteristics of the Ca2+ signaling signature, and that the latter plays a necessary role in SMC differentiation and subsequent myotome patterning. Together, these data support and extend the proposition that specific spatiotemporal patterns of spontaneous Ca2+ signals might be used for different as well as combinatorial regulation of both nuclear and cytosolic signal transduction cascades, resulting in myofibrillogenesis in SMCs as well as myotome patterning.
KEY WORDS:
Ca
2+imaging, IP
3
R, RyR, slow muscle cell, transgenic zebrafish
BIOLOGY
www.intjdevbiol.com*Address correspondence to: Andrew L. Miller. Division of Life Science, The Hong Kong University of Science and Technology, Clear Water Bay, Hong Kong SAR, PRC. Fax: +852-2358-1559. e-mail: [email protected] - web: http://ihome.ust.hk/~aequorin/
# Present address: Department of Anatomical and Cellular Pathology, Chinese University of Hong Kong, Prince of Wale’s Hospital, Shatin, Hong Kong, PRC.
Supplementary Material (a movie and figure) for this paper is available at: http://dx.doi.org/10.1387/ijdb.103160cc Accepted: 23 August 2010. Final author corrected PDF published online: 23 February 2011. Edited by: Makoto Asashima
ISSN: Online 1696-3547, Print 0214-6282 © 2011 UBC Press
Printed in Spain
Abbreviations used in this paper: CSP, calcium signaling period; DMSO, dimethyl sulphoxide; E-CC, excitation-contraction coupling; FMCs, fast muscle cells; hpf, hours post-fertilization; IP3Rs, inositol 1,4,5-trisphosphate receptors; QP, calcium signaling quiet period; RLU, relative light units; RyRs, ryanodine receptors; SMCs, slow muscle cells; SP1, calcium signaling period 1.
Introduction
The regulation of intracellular Ca2+ concentration, [Ca2+] i, has been reported to play a critical role in many aspects of muscle development and function (Ferarri et al., 1996; Brennan et al.,
2005; Campbell et al., 2006). While the majority of Ca2+-muscle studies has been conducted in vitro, with cells or explants in
culture, relatively few have been conducted in vivo, i.e., using
intact, normally developing animals. For example, using the C2C12 mouse muscle cell line, it has been shown that three different patterns of Ca2+ signals are generated during in vitro myogenesis (Lorenzon et al., 1997) and that the frequency of the
Ca2+ transients determines the time required for de novo sarcom-ere assembly (Fujita et al., 2007). In isolated chick skeletal
myoblasts, David et al. (1981) showed that a net movement of
reported that spontaneous Ca2+ signals are generated during just the first 15 hours in culture. These Ca2+ signals were shown to be generated by Ca2+ release from intracellular stores via ryanodine receptors (RyRs) and it was proposed that the signals play a role in the assembly of the myosin thick filaments (Ferrari et al., 1996;
1998). Ferrari and Spitzer, (1999) subsequently showed that similar Ca2+ dynamics also occur in the exposed myotome of dissected embryos and that these Ca2+ events seem to be correlated with somite formation and myocyte maturation. Li et al.
(2004) then reported that spontaneous Ca2+ signals appear to regulate patterned actin assembly during myofibrillogenesis in cultured Xenopus myocytes, where blocking these signals
dis-rupted the assembly of the actin thin filaments and the actin-associated z-disc affiliated proteins, titin and capZ. More recently, Brennan et al. (2005) reported that in intact zebrafish embryos,
the release of intracellular Ca2+ from RyRs drives the initial contraction of slow muscle cells (SMCs) and that these contrac-tions are responsible for the embryonic movements that occur at ~17 - 22 hpf. They also reported that this process is regulated by acetylcholine and results from spontaneous neuronal activity. Furthermore, blocking Ca2+ release with antagonists of either the acetylcholine receptor (AChR) or RyR disrupted the organization of the myofibrils without affecting the number of SMCs, or their elongation or migration. They thus proposed a critical role for nerve-mediated Ca2+ signals in the formation of physiologically functional slow muscle during zebrafish development (Brennan et al., 2005). Most recently, Campbell et al. (2006) reported ryanodine
receptor (RyR)-mediated generation of both localized (i.e., in the subsarcolemma space), short duration Ca2+ transients (SDTs; lasting ~2 secs), as well as spontaneous global Ca2+ transients of long duration (LDTs; lasting ~80 sec) in embryonic myocytes prepared from neural plate (stage 15) Xenopus embryos. They
proposed that the distinct spatiotemporal patterns of SDTs vs LDTs may be used for differential regulation of cytosolic signaling cascades, control of nuclear gene expression, and localized activation of assembly events at the sarcolemma (Campbell et al.,
2006).
In this current study, we used intact zebrafish embryos as an
in vivo animal model in order to extend our holistic understanding
of the role of Ca2+ signaling during the differentiation of the SMCs of skeletal muscle. The various different types of skeletal muscle are all derived from the myotome region of the somites and their development is regulated by the interaction of a number of complex signaling networks (Weinberg et al., 1996; Brennan et al., 2002; Ochi and Westerfield, 2007). SMCs develop from a
population of muscle precursor cells, termed adaxial cells, which lie adjacent to the notochord before segmentation begins (Devoto
et al., 1996; Barresi et al., 2001). The adaxial cells are formed
from the paraxial mesoderm when the notochord precursors secrete signaling molecules such as Hedgehog proteins (Currie
and Ingham, 1996; Blagden et al., 1997; Stickney et al., 2000)
following the convergence and extension cell movements that start in the earlier Gastrula Period (Kimmel et al., 1989; 1990).
Shortly after somite formation, the adaxial cells, which are initially cuboidal in shape, elongate to extend across the anterior-poste-rior axis of the somite and then the majority migrate from the medial to lateral region of the somite to ultimately form a superfi-cial monolayer of ~20 cells at the periphery of the myotome (Devoto et al., 1996; Du et al., 1997). Devoto et al. (1996)
demonstrated that in the rostral trunk this process takes ~5 hours (i.e., from ~17 hpf to ~23 hpf or the 16- to 28-somite stages), during which time the adaxial cells differentiate into SMCs. The adaxial cells that do not migrate are called muscle pioneer cells; these remain in a medial location within the somite and form the horizontal myoseptum, which separates the dorsal and ventral regions of the myotome (Halpern et al., 1993). The non-adaxial
cells in the myotome (called the lateral presomitic cells) also do not migrate and these differentiate into the fast muscle cells (FMCs; Devoto et al., 1996), via a process reported to be induced
by the medial-to-lateral migration of the SMCs through the somite (Wolff et al., 2003; Henry and Amacher, 2004).
The first spontaneous contractions occur in the trunk muscle at ~17 hpf (i.e., 16-somite stage; Liu and Westerfield, 1992; Saint-Amant and Drapeau, 1998; Drapeau et al., 2002), when the
individual myotome blocks are innervated by axons of the caudal primary motoneurons (Eisen et al., 1986; Westerfield et al., 1986;
Myers et al., 1986; Brennan et al., 2005). The spontaneous
muscle contractions reach a peak frequency of ~1 Hz by ~19 hpf and then decline again over the next few hours to reach a frequency of ~0.1 Hz by ~26 hpf (Saint-Amant and Drapeau, 1998). These initial spontaneous muscle contractions are fol-lowed sequentially by touch-evoked rapid coils and organized swimming behavior, which start at ~21 hpf and ~30 hpf, respec-tively (Saint-Amant and Drapeau, 1998).
In order to extend our understanding of the role of Ca2+ signaling during embryonic muscle development, complemen-tary aequorin-based and fluorescence-based confocal Ca2+ im-aging techniques were applied. With regard to the former, we developed a new line of transgenic zebrafish that express apoaequorin specifically in the trunk musculature. Active aequorin in these transgenic zebrafish embryos was then reconstituted by incubation in a solution containing the apoaequorin co-factor, coelenterazine (Cheung et al., 2006). While aequorin-based
imaging allows for the continuous, non-disturbing visualization of intact zebrafish embryos for long-duration developmental studies (for example, during the entire development of the embryonic trunk musculature), a drawback of this technique is that it only allows for two-dimensional and low resolution Ca2+ imaging. Thus, after we applied aequorin-based imaging to establish where and when Ca2+ transients arose in the developing muscu-lature, we then examined the signals at higher spatial resolution using the fluorescent Ca2+ reporter, calcium green-1 dextran, in conjunction with confocal microscopy. The use of these two imaging techniques allowed us to add new spatial information, from both a rostrocaudal perspective, as well as at a sub-cellular level, to what is known about Ca2+ signaling in SMCs in an intact vertebrate system. In addition, it has allowed us to extend our understanding of the various Ca2+-release mechanisms respon-sible for generating the signals as well as to investigate (via their
inhibition) the possible functional roles of these signals during SMC differentiation and myotome development.
Results
Visualizing Ca2+ signals from transgenic fish that express
apoaequorin in the musculature
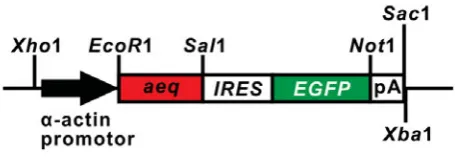
Transgenic zebrafish that express the apoaequorin (aeq) gene
(Inouye et al., 1989) exclusively in the musculature were
gener-ated by microinjecting an aeq construct driven by an -actin promoter (Higashijima et al., 1997) into embryos at the 1-cell
stage (Fig. 1). This plasmid also contained an EGFP marker
gene, which was regulated by the IRES-sequence (a short
se-quence of DNA that initiates the internal translation of RNA) for the subsequent identification of transgenic fish. We have termed this
-actin-apoaequorin-IRES-EGFP transgenic line of fish, -actin-aeq. Use of the IRES-sequence enables the translation of both aeq and EGFP from a single mRNA, thus the expression level
and distribution of EGFP reflects the expression level and distri-bution of apoaequorin (Jang et al., 1988; Fahrenkrug et al., 1999;
Wang et al., 2000).
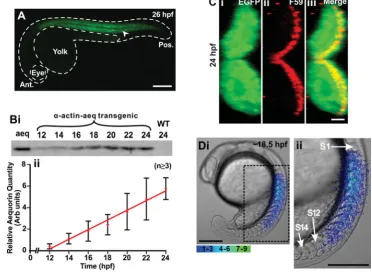
Using this plasmid, a single transgenic founder fish (F0) was identified from 85 candidate fish. This F0 fish was then out-bred with a wild-type fish to establish the F1 transgenic line. The F1 embryos that expressed EGFP (Fig. 2A) were identified and raised to adults for the generation of a stable homozygous F2 line. In this transgenic line, the EGFP and thus the apoaequorin were expressed at low levels at ~12 hpf (i.e., ~6-somite stage; Fig. 2B)
and the level of expression increased in an approximately linear manner over the time range measured, i.e., up to ~24 hpf. Fig. 2C shows a transverse cross section through the myotome of a representative (n=5) transgenic zebrafish embryo at ~24 hpf and shows that the EGFP (Fig. 2Ci) and thus apoaequorin were expressed throughout the entire musculature including the slow muscles (the myosin of which was labeled with the F59 antibody; Fig. 2Cii and 2Ciii). Together, these results suggest that this -actin-aeq fish line can be used to visualize and characterize the Ca2+ signals generated in the developing trunk musculature (Fig. 2D) between approximately 16 hpf and 25 hpf, (i.e., the period reported in this study).
Characterizing the trunk Ca2+ signals in zebrafish with
aequorin-based Ca2+ imaging
Transgenic embryos (n=6) were incubated in f-coelenterazine
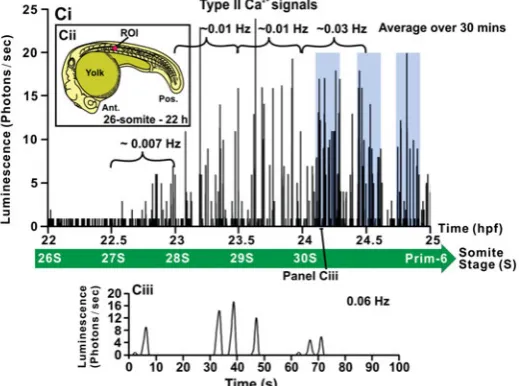
solution to reconstitute active aequorin, and the Ca2+ signals generated in the developing trunk between ~17 hpf to ~24.5 hpf were visualized using our PIMS (Fig. 3Ai). Using a region of interest (ROI) that covered the entire embryo (Fig. 3Aii), and acquiring the luminescent data in photons/sec, two distinct peri-ods of Ca2+ signaling were observed in the developing anterior trunk (Fig. 3Ai). The first period of Ca2+ signaling was comprised of two main components: The first to appear was rapid Ca2+ spiking, which began suddenly at ~17.5 hpf (i.e., the 17-somite stage), where the maximum amplitude of signaling was detected almost immediately. Spiking activity lasted until ~19.5 hpf (i.e., the 21-somite stage). The spiking frequency was not, however,
Fig. 2. Characterization of the trans-genic zebrafish line that expresses the apoaequorin and EGFP genes, which are targeted to the skeletal muscle via a muscle specific -actin promoter. (A)
Expression of EGFP (see arrowhead) in the trunk musculature of a representative
-actin-aeq transgenic (F1) embryo at 26
hpf. This embryo was bred by crossing the
single p-KS-Aeq-IRES-EGFP
plasmid-in-jected founder fish (F0) generated, with a
wild-type fish. Ant. and Pos. are anterior
and posterior, respectively. (B) Profile of
apoaequorin expression in the F1
trans-genic embryos from 12 hpf to 24 hpf. (Bi)
Representative example (n=3) of a
West-ern blot and (Bii) a line graph (mean
SEM; n3) to illustrate the relative level
and temporal expression profile of apoaequorin in extract prepared from the transgenic embryos. Aeq, aequorin con-trol; WT, wild-type embryos. Extract pre-pared from 3 embryos was loaded into
each lane. (C) Cross section of the
myo-tome of a representative (n=5) transgenic
zebrafish embryo at 24 hpf illustrating (Ci)
the expression of EGFP, (Cii) the slow
muscles (labeled via
immunohistochemis-try with the F59 myosin heavy chain antibody), and (Ciii) the EGFP and F59-labeled images when merged, such that the yellow color indicates the
region of overlap. (Di) A representative example (n=4) of the spatial pattern of Ca2+ transients generated in the trunk of an apoaequorin expressing
transgenic embryo at ~18.5 hpf. This image represents 10 sec of accumulated light superimposed on to the appropriate bright-field image. The region of the embryo bounded by the black dashed square is shown at higher magnification in Dii. S1, S12 and S14 are somites 1, 12 and 14, respectively.
constant during this time, but altered in a distinct and highly reproducible manner. Unlike the sudden initiation of the spiking activity, its termination was the result of a steady decline in spiking amplitude (Fig. 3Ai). The second main component of the Ca2+ signaling activity was related to the baseline level of the Ca2+ spiking. This did not remain constant during the spiking period, but displayed a gradual increase, which started at ~18 hpf, reached a maximum at ~18.75 hpf and then returned to its original resting value by ~19.5 hpf. This was concomitant with the cessation of the Ca2+ spiking activity. Thus, from ~18 hpf onwards, the Ca2+ spiking activity was superimposed on top of this baseline modu-lation. We have termed this second Ca2+ signaling feature the “slow rising component”. We have called the combination of Ca2+ spiking and the slow rising component, “Ca2+ Signaling Period 1” (or SP1).
Between ~19.5 hpf and ~23 hpf, the Ca2+ signaling activity (both the Ca2+ spiking and baseline modulation) returned to pre-SP1 levels. We have called this the “Ca2+ Signaling Quiet Period” (or QP). This was followed at ~23 hpf (i.e., the 28-somite stage), beginning with a gradual build-up (rather than a sudden initiation as was the case with the SP1 Ca2+ signals), of a second phase of Ca2+ signaling activity. This was comprised of a second period of Ca2+ spiking with no slow rising component. We have termed this “Ca2+ signaling period 2” (or SP2). This second phase was ongoing when our observations ended at ~24.5 hpf. The onset of SP2 at ~23 hpf indicated that the earlier fall in Ca2+ signaling activity (which was complete by ~19.5 hpf) was not due to the consumption of active aequorin in the trunk muscle cells.
The SP1 and SP2 Ca2+ spikes were analyzed in further detail (Fig. 3B and 3C, respectively). For this analysis, an ROI restricted
Fig. 3. The changes in [Ca2+]
i that occur in -actin-aeq transgenic
embryos from ~17 hpf to ~24.5 hpf (i.e., the ~16-somite stage to ~Prim-5 stage). (Ai) Representative (n=6) profile of aequorin-generated light from ~17 hpf to 24.5 hpf. Data were plotted every 10 s, each data point representing 10 sec of accumulated luminescence in a region of
interest (ROI) of ~1.24 mm2 (see panel Aii). This trace clearly illustrates
two distinct periods of Ca2+ signaling activity. The first Ca2+ signaling
period, termed Signaling Period 1 (SP1), occurs from ~17.5 hpf to 19.5
hpf, and the second Ca2+ signaling period, termed Signaling Period 2
(SP2), starts at ~23 hpf and runs at least to the end of the imaging period at 24.5 hpf. Between SP1 and SP2 (i.e., from ~19.5 hpf to ~23 hpf) a
period of significantly reduced Ca2+ activity was consistently observed.
We have termed this the Ca2+ signaling quiet
period (QP). (Bi) Profile of the SP1 Ca2+ signals
alone (i.e., from 17 hpf to 20 hpf). (Biii, Biv, Bv,
Bvi) Profiles of the Ca2+ signals generated over a
period of 100 sec from 17.5-18 hpf, 18-18.5 hpf, 18.5-19 hpf and 19-19.5 hpf, respectively, as indi-cated in panel (Bi). (Ci) Profile of the Ca2+ signals generated at the end of the QP and start of SP2 (i.e., from 22 hpf to 25 hpf). The shaded regions show bursts of Ca2+ signaling activity. (Ciii) Profile
of the Ca2+ signals generated over a period of 100
sec from 24-24.5 hpf, as shown in panel (Ci). For the profiles in B and C, data were plotted every 1
s, each data point representing 1 sec of accumulated luminescence for ROIs located in somite 8 (i.e., ~5000 m2; see panels Bii and Cii, respectively).
to somite 8 was used (Fig. 3Bii and 3Cii), and the data were reviewed at higher temporal resolution. For both signaling peri-ods, we made the assumption that rates of luminescence of 2 photons/sec and above were “real” Ca2+ signals and anything below this was background noise. During SP1, the frequency of signal generation showed distinct variations (Fig. 3Bi). The lowest frequency of signaling (~0.02 Hz) occurred during the first ~30 minutes of SP1 (i.e., between 17.5 hpf and 18 hpf). The frequency of the signaling then increased ~4-fold to ~0.09 Hz between 18 hpf and 18.5 hpf, and then peaked at ~0.12 Hz between 18.5 hpf and 19 hpf. Between 19 hpf and 19.5 hpf, the frequency of signals then dropped again to ~0.03 Hz, and finally fell to zero, indicating the beginning of the QP. The varying frequencies observed during SP1 are also shown in the higher temporal resolution plots (Fig. 3Biii-3Bvi) and were a conserved feature seen in all embryos examined (Fig. 4A). When signaling resumed at the start of SP2, the frequency of the Ca2+ signals was initially just ~0.007 Hz and then as the SP2 signals became established at ~24 hpf, the frequency increased to ~0.03 Hz (Fig. 3Ci, Ciii). Between 24–24.5 hpf the SP2 Ca2+ transients were also characterized by ~12-min bursts of activity followed by ~5-min periods of relative inactivity (see shaded regions in Fig. 3Ci).
What we have called SP1 and SP2 in the -actin-aeq trans-genic embryos, we previously described as “two distinct periods of Ca2+ signaling” in zebrafish embryos that were injected with apoaequorin-mRNA (aeq-mRNA) to express aequorin transiently
in the entire embryo (described by Cheung et al., 2006). We
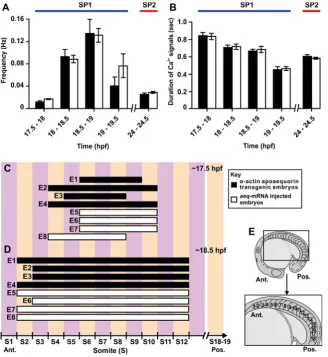
conducted a detailed comparison of SP1 and SP2 Ca2+ signals during restricted time windows using both -actin-aeq transgenic embryos and aeq-mRNA injected embryos (n3 for each; see Fig. 4 A, B). All statistical analyses were conducted using the student’s
t-test for unpaired samples.
Fig. 4A shows that the frequencies of the SP1 Ca2+ signals (i.e., between 17.5-18 hpf, 18-18.5 hpf, 18.5-19 hpf and 19-19.5 hpf) generated in the -actin-aeq transgenic embryos were not statis-tically different from those generated in the aeq-mRNA injected
embryos during the respective time periods. In SP1, the fre-quency of the Ca2+ signals was significantly lower (at p<0.01) between 17.5-18 hpf (i.e., ~0.02 Hz) than at any other time in SP1 and SP2. The frequency increased from ~0.02 between 17.5-18 hpf to ~0.09 Hz between 18-18.5 hpf, and reached a maximum of ~0.13 Hz between 18.5-19 hpf. The frequency of the signals then decreased to ~0.06 Hz between 19-19.5 hpf. The frequency of the SP2 Ca2+ signals (i.e., ~0.03 Hz) was significantly lower than that generated between 18-18.5 hpf (i.e., ~0.09 Hz) and between 18.5-19 hpf (i.e., ~0.13 Hz), at p<0.01. On the other hand, the frequency of the SP2 signals was not statistically different from the frequency of the SP1 signals at 19-19.5 hpf (i.e., ~0.06 Hz). The duration of the SP1 and SP2 Ca2+ signals for each of the -actin-aeq transgenic and aeq-mRNA injected embryos was
also compared (Fig. 4B). We followed the protocol described by Brennan et al. (2005), and calculated the duration as the time
taken for a signal to decay from the maximum amplitude to half of that value. The durations that were calculated for each of the four peri-ods comprising SP1 (i.e., between 17.5-18 hpf, 18-18.5 hpf, 18.5-19 hpf and 19-19.5 hpf) gen-erated in the -actin-aeq transgenic embryos were not significantly different from those gen-erated in the aeq-mRNA injected embryos,
during the respective time periods. In SP1, the Ca2+ signals between 17.5-18 hpf had the longest duration (i.e., ~0.84 sec). The duration of the signals then decreased through SP1 such that by 19-19.5 hpf, the mean duration of the signals was just ~0.46 sec. The duration of the signals between 18-18.5 hpf was signifi-cantly lower than those between 17.5-18 hpf at p<0.01. Likewise, the duration of the signals between 19-19.5 hpf was significantly lower
Fig. 4. Characteristics of the SP1 and SP2 Ca2+
signals generated in somites 8 of representative
-actin-aeq transgenic embryos and aeq-mRNA injected embryos. The vertical bar charts show the
(A) frequency and (B) duration of the Ca2+ signals at
17.5-18 hpf, 18-18.5 hpf, 18.5-19 hpf, 19-19.5 hpf
and 24-24.5 hpf. Data are expressed as means
SEMs of 3-4 independent experiments. (C,D)
Hori-zontal bar charts indicating the location with respect
to formed somites of the trunk Ca2+ signals
gener-ated in 4 representative apoaequorin transgenic
embryos (E1 to E4) and in 4 representative aeq
-mRNA injected embryos (E5 to E8) at (C) ~17.5 hpf
and (D) ~18.5 hpf. (E) Schematics of an embryo at
than those between 18.5-19 hpf at p<0.01. On the other hand, all the signals between 18-18.5 hpf and 18.5-19 hpf had a similar duration of ~0.7 sec. The durations of the SP2 Ca2+ transients (~0.6 sec) were significantly greater than those of the 19-19.5 hpf SP1 signals (at p<0.01).
Fig. 4 C, D are horizontal bar charts to show the location of the SP1 Ca2+ signals with respect to the formed somites in 4 -actin-aeq transgenic embryos and 4 aeq-mRNA injected embryos. In all
8 examples, these signals were generated in a discrete number of somites in the anterior trunk. At the start of the SP1 Ca2+ signaling window (i.e., ~17.5 hpf; the 17-somite stage), the low frequency (i.e., ~0.02 Hz) Ca2+ signals were generated between somites 4 and 10 in all 8 embryos examined at this stage of development (Fig. 4C). At ~18.5 hpf (i.e., the 19 somite stage), when the frequency of the Ca2+ signals rose to ~0.12 Hz, these signals were generated between somites 2 and 12, and in this case were never seen to extend into somite 1 in an anterior direction, or beyond somite 12 in a posterior direction (Fig. 4D). At both time points analyzed (i.e., ~17.5 hpf and ~18.5 hpf), there was no difference in the anterior-to-posterior spread of the signals generated, when comparing the transgenic embryos with the mRNA-injected embryos (Fig. 4 C,D).
Further characterization of the trunk Ca2+ signals with
cal-via the co-injection of and subsequent imaging with an equivalent molecular weight molecule, rhodamine B dextran (Fig. 5Bii). The Ca2+ signals shown in Fig. 5 correlated with a spontaneous contraction in the muscle cells (see Supplemental Movie #1).
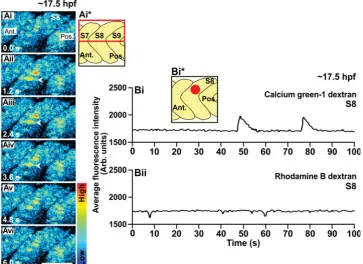
Fig. 6 is a representative example (n=3) of the Ca2+ signals generated by individual muscle cells in somites 7-10 at ~18.5 hpf (i.e., the 19-somite stage). Fig. 6A shows a representative Ca2+ signal that was imaged in the trunk, which lasted ~5 sec. The profiles of the Ca2+ signals generated over a period of 100 sec in somites 7-10 (Fig. 6 Bi-Biv) show that the signals generated in one somite were in phase with those generated in the other somites (indicated by the red dashed lines). In addition, the Ca2+ signals generated in the dorsal, medial and ventral parts of a somite (i.e., somite 9; Fig. 6C) were also found to be in synchrony. Again, the reliability of the calcium green-1 dextran signals was confirmed via the co-injection and subsequent imaging of rhodamine B dextran (Fig. 6Bv). Moreover, the Ca2+ signals observed at ~17.5 hpf and ~18.5 hpf via confocal microscopy support and confirm the SP1 Ca2+ signals generated in the -actin-aeq transgenic fish at the same time (compare Fig. 5Bi with Fig. 3Biii and Fig. 6Bi-Biv with Fig. 3Bv).
Using calcium green-1 dextran and confocal microscopy, we also investigated Ca2+ signals at the level of a single muscle cell (Fig. 7). Fig. 7 C, D show a representative example of a Ca2+
Fig. 5. An example of the Ca2+ signals generated in the trunk of a wild-type embryo at ~17.5 hpf
(i.e., the 17-somite stage), as visualized by confocal microscopy using calcium green-1 dextran. (Ai-Avi) Representative (n=3) single confocal sections to show the Ca2+ signals generated in the dorsal half of somite 7, 8 and 9 (see the schematic, panel Ai*). The time interval between each image was ~1.2
sec. The color scale represents the level of [Ca2+]
i, where red indicates a high level and blue indicates
a low level. Ant. and Pos. are anterior and posterior, respectively. Scale bar, 50 m. (Bi) Temporal profile
of the average calcium green-1 dextran fluorescence intensity (in Arb. units) recorded in an ROI covering
~4-5 SMCs (i.e., ~800 m2) placed in the dorsal part of somite 8 of this wild-type embryo at ~17.5 hpf
(see schematic, panel Bi*). (Bii) Temporal profile of the average rhodamine B dextran fluorescence
intensity (in Arb. units) recorded in the same ROI over the same time period. cium green-1 dextran and confocal
imaging
The fluorescent Ca2+ reporter, cal-cium green-1 dextran (10S) in conjunc-tion with confocal microscopy, was used to confirm and support the data col-lected using aequorin-based imaging. In addition, the higher spatial resolution of this imaging technique enabled us to characterize the spatial aspects of the trunk Ca2+ signals in greater detail.
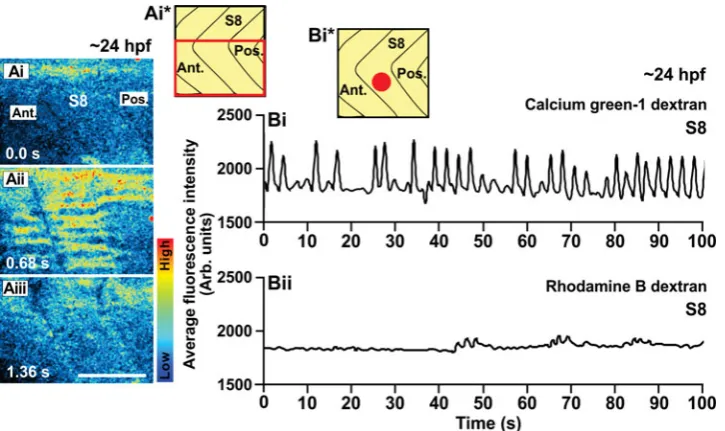
signal generated in a single cell in somite 10 (Fig. 7B) at ~18.5 hpf. In this case, the Ca2+ signal was generated in the nucleus first, after which it spread through the cytoplasm. In addition, the nuclear Ca2+ signal remained relatively high even when the Ca2+ signal in the cytoplasm had decreased to the resting level again. Fig. 8 shows a representative example (n=3) of an SP2 Ca2+ signal generated in the trunk at ~24 hpf (i.e., the Prim-5 stage). Fig. 8A shows a representative Ca2+ signal that was imaged in the ventral portion of somite 8, which lasted for ~1.4 sec. The Ca2+ signal was generated in the entire cell when the muscle contracted. However, unlike the Ca2+ signals generated at ~17.5 hpf and ~18.5 hpf, where the signal was generated mainly in the nucleus, at ~24 hpf the Ca2+ signals appeared to be mainly cytosolic. The profiles of the Ca2+ signals and the rhodamine-B dextran generated fluorescence recorded over a period of 100 sec in somite 8 are shown in Fig. 8Bi and 8Bii, respectively.
Effect of cyclopamine and forskolin on slow muscle devel-opment and Ca2+ signaling in the trunk
During confocal imaging, the cells that generated the SP1
Fig. 6. An example of the Ca2+ signals generated
in the trunk of a wild-type embryo at ~18.5 hpf as visualized by confocal microscopy using calcium green-1 dextran. (Ai-Av) Representative (n=3) single
confocal sections to show the Ca2+ signals
gener-ated in somites 7, 8, 9 and 10 at ~18.5 hpf (i.e., the 19-somite stage). The time interval between each image was 1.16 sec. The color scale represents the level of [Ca2+]
i, where red indicates a high level and
blue indicates a low level. Ant. and Pos. are anterior
and posterior, respectively. Scale bar is 50 m.
(Bi-Biv) Temporal profiles of average calcium green-1
dextran fluorescence intensity (in Arb. units) re-corded in four ROIs (each covering ~4-5 SMCs, i.e.,
~800 m2) placed in the middle of somites 7, 8, 9 and
10 of this wild-type embryo at ~18.5 hpf (see sche-matic, panel Bi*). The three red dashed lines help to illustrate the synchronized nature of these signals.
(Bv) Temporal profile of average rhodamine B
dext-ran fluorescence intensity (in Arb. units) recorded in an ROI placed in the middle of somite 8 (see
sche-matic, panel Bv*). (C) Temporal profiles of average
calcium green-1 dextran fluorescence intensity (in Arb. units) in the dorsal (green), medial (red) and ventral (blue) regions of somite 9, which indicate that
the majority of the Ca2+ signals in the dorsal, medial
and ventral regions of the somite also occur in
synchrony. (C*) Schematic to show the dorsal (D),
medial (M) and ventral (V) ROIs.
component of the hedgehog signaling pathway (Chen et al.,
2002), while forskolin indirectly inhibits the response of cells to hedgehog signaling by activating cAMP-dependent protein ki-nase (PKA; Barresi et al., 2000). Embryos treated with these
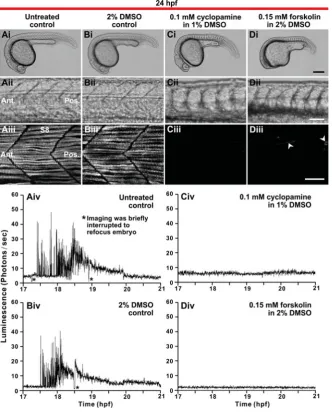
drugs exhibited several gross developmental abnormalities at 24 hpf, compared with the untreated and DMSO controls (Fig. 9 Ai-Di). Both drugs induced abnormalities in the trunk and tail, and forskolin additionally caused abnormal head formation (compare Fig. 9 Ci, Di with Fig. 9 Ai, Bi). Fig. 9Aii-Dii are bright-field images of the trunk at higher magnification. While the somites in the untreated and DMSO-treated embryos displayed a normal chev-ron-shape, those in the embryos treated with cyclopamine or forskolin were U-shaped (compare Fig. 9 Cii, Dii with Fig. 9 Aii, Bii). In addition, immunohistochemistry of the slow muscle fibers with the F59 antibody shows that cyclopamine and forskolin treatment almost completely blocked slow muscle formation at 24 hpf (compare Fig. 9 Ciii, Diii with Fig. 9 Aiii, Biii). Fig. 9 Aiv-Div show the profiles of aequorin-generated light from transgenic embryos that were either untreated (Fig. 9Aiv; n=9), or else were treated with DMSO (Fig. 9 Biv; n=6), cyclopamine (Fig. 9Civ; n=6) Ca2+ signals appeared, from their morphology
and location within the somite, to be SMCs (see Figs. 5 and 6). To confirm whether this was the case, -actin-aeq transgenic embryos were treated with either 0.1 mM cyclopamine (Chen
et al., 2002) or 0.15 mM forskolin (Barresi et al.,
Fig. 7 (above). A Ca2+ signal generated in a single muscle cell in the trunk of an intact embryo
at ~18.5 hpf (i.e., the 19-somite stage). Embryos (n=3) were loaded with calcium green-1 dextran
(10S) at the 1-cell stage and images were acquired via confocal microscopy. (A) Schematic diagram
to show the position of somite 10 (red box) in the zebrafish embryo where the Ca2+ signal was
acquired. (B) Bright-field image of somite 10 with the position of the imaged cell indicated (see red
box). (C) Single confocal sections to show the Ca2+ signal generated in the imaged cell over a period
of ~8 s. The images were acquired every ~0.58 sec. The nucleus is outlined with a white dashed
line in the first panel. The color scale represents the level of [Ca2+]
i, where red indicates a high level
and blue indicates a low level. Ant. and Pos. are anterior and posterior, respectively. Scale bars are
(B) 25 m and (C) 10 m. (D) Temporal profile of the fold change in fluorescence intensity in the
nucleus and cytoplasm in this muscle cell for the duration of the Ca2+ signal.
or forskolin (Fig. 9Div; n=6). These profiles show that the SP1 Ca2+ signals that nor-mally occurred between ~17.5 to 19.5 hpf in the untreated and DMSO-treated controls (Fig. 9 Aiv, Biv), were completely blocked in the cyclopamine- and forskolin-treated em-bryos (Fig. 9 Civ, Div). These results strongly suggest that the SP1 Ca2+ signals are gen-erated exclusively by SMCs.
Slow muscle development and Ca2+
sig-naling in the trunk of smo-/- mutant
em-bryos
As well as treating embryos with drugs to inhibit hedgehog signaling and thus the formation of the SMCs, a genetic approach, involving the homozygous smo-/- mutant (Barresi et al., 2000) was also used to
confirm whether the SP1 Ca2+ signals were generated exclusively from SMCs (Fig. 10). The slow-muscle-omitted (smo) gene
en-codes the zebrafish smoothened protein, which (as mentioned previously) is a com-ponent of the hedgehog signaling pathway and is thus required for the development of the SMCs. In smo-/- embryos, fast muscles develop normally; however, almost 99% of the SMCs are lost and the muscle pioneers are completely absent (Barresi et al., 2000).
We found that at 24 hpf, the homozygous
smo-/- embryos exhibited a curved trunk and tail, compared to normal control embryos (i.e., either wild-type or heterozygous smo+/- mu-tants; compare Fig. 10Bi with Fig. 10Ai). In addition, while the somites in the normal con-trol embryos displayed the normal chevron-shape (Fig. 10Aii), those in the smo-/-
em-Fig. 8 (right). An example of the Ca2+
signals generated in the trunk of a wild-type embryo at ~24 hpf (i.e., the Prim-5 stage) as visualized by confocal micros-copy using calcium green-1 dextran. (Ai-Aiii) Representative (n=3) single confocal
sections to show the Ca2+ signals generated
in the ventral half of somite 8 (see the sche-matic, panel Ai*). The time interval between each image was 0.68 sec. The color scale
represents the level of [Ca2+]
i, where red
indicates a high level and blue indicates a low level. Ant. and Pos. are anterior and poste-rior, respectively. Scale bar, 50 m. (Bi) Tem-poral profile of the average calcium green-1 dextran fluorescence intensity (in Arb. units) recorded in an ROI covering ~4-5 SMCs (i.e.,
~800 m2) placed in the ventral part of somite
8 of this wild-type embryo at ~24 hpf (see
schematic, panel Bi*). (Bii) Temporal profile
bryos were U-shaped (Fig. 10Bii). Immunohistochemistry of the slow muscle fibers using the F59 antibody showed that at 24 hpf there was negligible slow muscle formation in the smo-/- embryos (compare Fig. 10Biii with the normal control, Fig. 10Aiii). Fig. 10Aiv and 10Biv show the profiles of aequorin-generated light from aeq-mRNA-injected normal control and smo-/- embryos, respectively. In these experiments, we used aeq-mRNA injected
homozygous smo-/- embryos. The profiles of aequorin-generated light show that the SP1 Ca2+ signals that occurred at ~17.5-19.5 hpf in normal control embryos (Fig. 10Aiv; n=5) were completely absent in the smo-/- embryos (Fig. 10Biv; n=3). These results support our cyclopamine and forskolin treatment experiments (Fig. 9), which together indicate that the SP1 Ca2+ signals are generated exclusively by SMCs.
Effect of -bungarotoxin and nifedipine on the SP1 Ca2+
signals
It has been previously reported that in zebrafish embryos, the trunk muscles start to show spontaneous contractile activity at ~17 hpf and these movements are generated by acetylcholine (ACh) release from motor nerve terminals (Grunwald et al., 1988;
Melançon et al., 1997). When acetylcholine binds to nicotinic
acetylcholine receptors (nAChRs) expressed by the muscle cells, this binding is reported to activate dihydropyridine receptors (DHPRs) located on the surface membrane or on T-tubules, which in turn triggers the release of Ca2+ from intracellular stores via RyRs, and hence contraction occurs (Schneider and Chan-dler, 1973).
To investigate whether the nAChRs and DHPRs play a role in generating the SP1 Ca2+ signals, -actin-aeq transgenic embryos were incubated with either the nAChR blocker, -bungarotoxin-Alexa Fluor 488 (n=3; Fig. 11Bi) or the DHPR antagonist, nifedipine (n=3; Fig. 11Ci) and the luminescence was compared with that generated by untreated controls (Fig. 11Ai). The distal ~100 m portion of the tail of each embryo was excised with a tungsten needle just prior to incubation with the -bungarotoxin-Alexa Fluor 488 or nifedipine solution, in order to help facilitate the diffusion of drugs into trunk tissues containing the SMCs. The Alexa Fluor 488 moiety on -bungarotoxin was used to visualize and thus confirm the diffusion of the drug into the trunk via the tail-cut (data not shown). We found that the SP1 Ca2+ signals were completely blocked by treatment with either -bungarotoxin or
Fig. 9. Effect of cyclopamine and forskolin on slow muscle development and Ca2+ signaling in
the trunk. (Ai to Di) Representative bright-field
images of embryos at 24 hpf that were either (Ai)
untreated (controls), or else that were treated from
5.5 hpf with (Bi) 2% DMSO (DMSO-control), (Ci) 0.1
mM cyclopamine or (Di) 0.15 mM forskolin (n=4 for
each of the untreated and drug-treated embryos).
(Aii-Dii) The somites of the embryos shown in (Ai
-Di), respectively, are shown at higher magnification.
(Aiii-Diii) Projected stacks of confocal images through the trunk (at the position of somite 8; S8) of
embryos treated as described for (Ai-Di),
respec-tively, prior to fixation at 24 hpf and then the SMCs labeled by immunohistochemistry with the F59
myosin heavy chain antibody. Arrowheads in (Diii)
indicate the few SMCs that still formed in the forskolin-treated embryos. Ant. and Pos. are anterior and posterior, respectively. Scale bars are (Ai-Di) 250
m, (Aii-Dii) 50 m and (Aiii-Diii) 25 m. (Aiv-Div)
Profiles of aequorin-generated light from -actin-aeq
transgenic embryos treated as described for (Ai-Di),
respectively, from 17 hpf to 21 hpf (i.e., the ~16- to 24-somite stage). Data were plotted every 10 s, each data point representing 10 sec of accumulated lumi-nescence for an ROI covering the entire embryo (i.e., 1.24 mm2).
The effect of 2-APB and ryanodine on the trunk Ca2+ signals To investigate the mechanism of generation of the SP1 trunk Ca2+ signals, embryos were treated with the IP
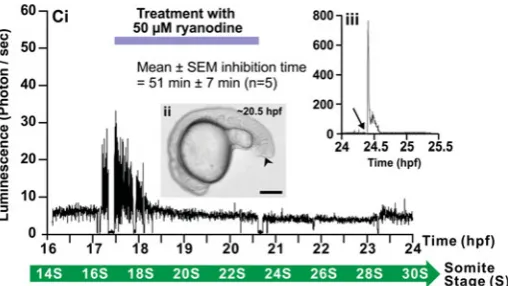
3R antagonist, 2-APB, or the RyR antagonist, ryanodine (Fig. 12). The -actin-aeq transgenic embryos were imaged using our PIMS starting at ~16-17 hpf and then they were treated with either 25 M 2-APB or 50 M ryanodine for 3 hr following the first appearance of the SP1 Ca2+ signals. Once again, ~100 m of the distal portion of the tail of each embryo was excised just prior to incubation with the 2-APB, or ryanodine solution, in order to ensure that the drugs diffused into trunk tissues containing the SMCs. Fig. 12Ai shows a profile of aequorin-generated light in a representative (n=9) untreated control embryo from ~17 hpf to 24 hpf with the SP1 Ca2+ signals, the QP, and the SP2 Ca2+ signals indicated. A bright-field image of this embryo at ~20.5 hpf is shown in Fig. 12Aii. Fig. 12Bi is the profile of
aequorin-generated light in a representative embryo (n=6) that was treated with 2-APB, which shows that the SP1 rapid Ca2+ spikes were blocked within ~3 1.5 min following the start of the 2-APB treatment but that the SP2 Ca2+ spikes were still generated normally at ~23 hpf. Treatment with 2-APB also inhibited the slow rising component of SP1. The gross morphology of the 2-APB-treated embryo at ~20.5 hpf is shown in Fig. 12Bii, with the location of the tail-cut indicated by a black arrowhead. The aequorin burn-out experiment conducted at ~24.5 hpf (Fig. 12Biii) along with the appearance of the SP2 Ca2+ signals indicate that the low level of luminescence observed from ~17.5 hpf to 23 hpf following 2-APB treatment, was due to the drug inhibiting SP1 Ca2+ signals rather than being due to a lack of active aequorin in the trunk muscle cells.
Fig. 12Ci is a profile of aequorin-generated light in a repre-sentative embryo (n=7) that was treated with ryanodine, which
Fig. 10 (left). Slow muscle development and Ca2+ signaling in the
trunk of smo-/- mutant embryos. (Ai,Bi)Representative bright-field
images of (Ai) normal control (n=3) or (Bi)smo-/-mutant embryos (n=3),
at 24 hpf. (Aii,Bii) The somites of the embryos shown in (Ai,Bi),
respectively, are shown at higher magnification. (Aiii,Biii) Projected
stacks of confocal images through the trunk (at the level of somite 8; S8) of (Aiii) normal control and (Biii)smo-/-mutant embryos that were fixed at 24 hpf and then the SMCs labeled by immunohistochemistry with the F59 myosin heavy chain antibody. Ant. and Pos. are anterior and
poste-rior, respectively. Scale bars are (Ai,Bi) 250 m, (Aii,Bii) 50 m and (Aiii,Biii) 25 m. (Aiv,Biv) Profiles of aequorin-generated light from aeq-mRNA
injected (Aiv) normal (control) and (Biv)smo-/- mutant embryos from ~17 hpf to ~21 hpf (i.e., the ~16- to 24-somite stage). Data were plotted every
10 s, with each data point representing 10 sec of accumulated luminescence for an ROI covering ~8000 m2 on somite 8 (Biv*).
Fig. 11 (right). Effect of -bungarotoxin and nifedipine on the trunk Ca2+ signals. Representative (n=3) PMT-generated temporal profiles of the
luminescence generated by -actin-aeq transgenic embryos that were either (Ai) untreated or else treated with (Bi) 3 M -bungarotoxin or (Ci) 500
M nifedipine from 16.5 hpf to 21 hpf. All embryos had the tip of the tail removed prior to the treatment in order to enhance the diffusion of the drug
into the trunk tissues. Data were collected every 10 sec from 17 hpf to 21 hpf. (Aii - Cii) Temporal profiles of the luminescence generated at the end
of each imaging experiment when triton X-100 was added (see arrows) to the embryos in order to permeabilize the plasma membrane and thus expose
shows that the SP1 Ca2+ spikes were not blocked immediately following the start of treatment (i.e., just prior to ~17.5 hpf) but that inhibition only occurred at ~51 7 min following the start of ryanodine treatment. Treatment with ryanodine also inhibited the slow rising component of SP1 that began at ~18 hpf in untreated controls. In addition, even though ryanodine treat-ment ended just before ~21 hpf, the SP2 Ca2+ spikes that were normally generated at ~23 hpf were also significantly reduced. The gross morphology of the ryanodine-treated embryo at ~20.5 hpf is shown in Fig. 12Cii, with the location of the tail-cut once again indicated by a black arrowhead. An aequorin burn-out experiment conducted just before 24.5 hpf (Fig. 12Ciii) indicates that the low level of luminescence observed following ryanodine treatment was due to the drug inhibiting the later portion of the SP1 signals and significantly reducing the SP2 Ca2+ signals, rather than being due to a lack of active aequorin in the embryo. When embryos were treated with ryanodine before the appearance of the SP1 Ca2+ signals (i.e., from ~16.5 hpf onward), once again the SP1 Ca2+ signals were only blocked after ~18 hpf (data not shown).
Localization of IP3Rs and RyRs in the developing trunk musculature
Wild-type embryos were fixed at 16 hpf, 18 hpf, 20 hpf, 22 hpf and 24 hpf (n=3 per time point) and then the IP3Rs were labeled via immunohistochemistry with the IP3R type 1 antibody (Fig. 13A). At ~16 hpf, IP3Rs were expressed homogeneously throughout the SMCs (Fig. 13Ai). At 18 hpf (i.e., during SP1), the IP3Rs began to organize into some clusters in the cytosol of
SMCs (see white arrowheads in Fig. 13Aii). At 20 hpf some IP3R banding was observed in the cytosolic regions of the SMCs, and by 24 hpf, very distinct IP3R banding was observed throughout the entire length of the SMCs (Fig. 13 Aiii-Av). Fig. 13C shows representative images of SMCs at 24 hpf that were dual labeled for both IP3Rs (Fig. 13Ci) and myosin (labeled with the F59 antibody; Fig. 13Cii). When these images were merged (Fig. 13Ciii), the IP3Rs appeared to be expressed in the SR located between the myosin thick filament bands and thus were mainly associated with the sarcomeric I-bands. This labeling pattern is schematically represented in Fig. 13E.
In addition, embryos were fixed at 16 hpf, 18 hpf, 20 hpf, 22 hpf and 24 hpf (n=6 per time point) and the RyRs were labeled via immunohistochemistry with the 34C antibody (Fig. 13B). No RyR expression was detected in the SMCs at 16 hpf (i.e., prior to the start of SP1; Fig. 13Bi). At 18 hpf (i.e., at the beginning of the slow rising phase of SP1), SMCs began to show a low level of homogeneous labeling (Fig. 13Bii). By 20 hpf, however, some RyR banding in the cytoplasmic region of the SMCs became apparent (see white arrowheads in Fig. 13Biii). At 22 hpf and 24 hpf (i.e., during the QP and SP2, respectively), very distinct banding of RyRs was observed along the entire length of the SMCs (Fig. 13 Biv, Bv). When embryos at 24 hpf were dual-labeled with 34C and rhodamine-phalloidin, to label the RyRs (Fig. 13Di) and F-actin (Fig. 13Dii), respectively, the superimposed RyR/F-actin images (Fig. 13Diii) showed that the RyR bands were approximately in the middle of the F-actin bands (see asterisks in Fig. 13 Di, Diii). This suggests that the RyRs were located in the SR located near to the Z-line. This is
Fig. 12. Effect of 2-APB and ryanodine on the trunk Ca2+ signals.
Representative temporal profiles of the luminescence generated by
-actin-aeq transgenic embryos that were (Ai) untreated (control; n=9) or
treated with (Bi) 25 M 2-APB (n=6) or (Ci) 50 M ryanodine (n=7) for 3
hours as soon as the SP1 Ca2+ signals were observed (i.e., at ~17.5 hpf).
Data were plotted every 10 s, with each data point representing 10 sec of accumulated luminescence for an imaging field covering the entire embryo
(i.e., ~1.24 mm2) from ~16-17 hpf to 24 hpf (i.e., the ~14- to 30-somite
stage). Ca2+ signaling period 1 (SP1), Ca2+ signaling quiet period (QP), and
Ca2+ signaling period 2 (SP2), observed in the untreated embryo, are
shown. (Aii, Bii, Cii) Bright-field images of the (Aii) untreated, (Bii) 2-APB-and (Cii) ryanodine-treated embryos at ~20.5 hpf. The arrowheads in
(Bii,Cii) indicate the location of the tail-cut procedure, where ~100 m of
the terminal portion of the tail bud was removed. This procedure was performed just prior to incubation with the drugs. Scale bars are 250 m. (Biii,Ciii)
Temporal profiles of the luminescence generated at the end of each imaging experiment when triton X-100 was added (see arrows) to the embryos in
schematically represented in Fig. 13F.
Together, the results from Figs. 12 and 13 suggest that both IP3Rs and RyRs contribute to the SP1 Ca2+ signals, with Ca2+ release via IP3Rs being more dominant at the start of this signaling period (i.e., from ~17.5 hpf to ~18 hpf), and that this is associated with the initial phase of low frequency SP1 Ca2+ signaling. Ca2+ release via RyRs becomes more prominent later (i.e., after 18 hpf) and thus perhaps contributes to both the higher frequency SP1 Ca2+ signaling as well as the slow rising Ca2+ component of SP1. In addition, the change in the pattern of IP3Rs and RyRs is also reflected in the change in pattern of the Ca2+ signals generated by the SMCs. This transition is clearly indicated in Figs. 5, 6 and 8.
The organization of myosin and F-actin in developing SMCs
Wild-type embryos were fixed at 16 hpf, 17 hpf, 18 hpf, 20 hpf, 22 hpf and 24 hpf (n=3 per time point), and then myosin and F-actin were labeled with the F59 antibody and rhodamine-phalloidin, respectively (Fig. 14). At 16 hpf, a relatively low level of myosin and actin labeling was observed in the SMCs (Fig.
gions of the SMCs (Fig. 14 Aii, Aiii). At ~17 hpf, the level of expression of both myosin and F-actin in the SMCs had in-creased significantly (i.e., compare Fig. 14 Bi, Bii, with Fig. 14 Ai, Aii) and both contractile proteins were beginning to be expressed along the whole length of a few individual SMCs (Fig. 14 Bi-Biii) with the first hints of F-actin banding being observed (see white arrowhead in Fig. 14Bii). At 18 hpf, a more prominent level of F-actin banding was observed and the first clear signs of myosin banding appeared in the SMCs (Fig. 14Cii and 14Ci, respectively). Furthermore, nearly all the SMCs showed ex-pression of the two proteins. The appearance of these orga-nized contractile proteins coincides with both the beginning of the slow rising phase of SP1, and the high frequency transients superimposed on this phase. From ~20 hpf to 24 hpf, the banding patterns of both F-actin and myosin were clearly well formed along the entire length of each slow muscle cell (Fig. 14 Di-Diii, 14 Ei-Eiii and 14 Fi-Fiii). The organization of myosin and F-actin in a slow muscle cell at 24 hpf is shown at higher magnification in Fig. 14 Gi-Giii and at higher magnification again in Fig. 14Giii* to show specific components of the sar-comere (labeled in the schematic in Fig. 14H).
Fig. 13. Expression of IP3Rs and RyRs in the trunk musculature. (A,B) Em-bryos were fixed at the times indicated in the upper right corner of each panel
and then the (A) IP3Rs and (B) RyRs
were labeled via immunohistochemis-try with the anti-Ins3R (Type 1) and 34C antibodies, respectively. Small clusters of IP3Rs at 18 hpf (Aii), and RyRs at 20 hpf (Biii) are indicated with white ar-rowheads. (C) Dual labeling of (Ci) IP3Rs and (Cii) myosin at 24 hpf. (Ciii) The
IP3R and myosin images when merged.
Arrowheads indicate the position of
the IP3Rs in the z-line SR. (D) Dual
labeling of (Di) RyRs and (Dii) actin at
24 hpf. (Diii) The RyR and actin images
when merged. Asterisks indicate the
position of the RyRs. In (C,D), myosin
was labeled via immunohistochemis-try with the F59 antibody and actin was
labeled with rhodamine phalloidin. (E,F)
Schematic representations of a
sar-comere to show (E) the pattern IP3R
labeling with respect to myosin, and (F)
the pattern of RyR labeling with re-spect to actin. Scale bars are (A,B) 10
m and (C,D) 3 m.
re-The effect of 2-APB and ryanodine on the organization of the trunk musculature and the formation of sarcomeres
Embryos were treated with various concentrations of 2-APB or ryanodine from ~17 hpf to 20 hpf (i.e., from the 16- to 22-somite stage), after which they were fixed and then the myosin and F-actin were labeled with the F59 antibody and rhodamine-phalloidin, respectively (n=3 for each treatment; Fig. 15). In the untreated controls (Fig. 15A) and the DMSO solvent controls (Fig. 15B), the trunk musculature and sarcomeres within the SMCs formed normally.
When embryos were treated with 2-APB at 25 M and 50 M (Fig. 15C and 15D, respectively), the gross morphology of the
trunk musculature did not appear to be very different from that in the control embryos. Furthermore, the morphology of the SMCs themselves was also similar to the untreated and DMSO-treated controls. For example, they remained attached to the vertical myoseptae and spanned the entire myotome. At a sarcomeric level, however, the organization of the myosin thick filaments appeared to be disrupted to a greater extent than that of the actin thin filaments. For example, in Fig. 15Cii* and 15Dii* there is a clear degree of thin filament banding, whereas, in Fig. 15Ci* and 15Di* the banding of the myosin thick filaments appears to be disrupted in a concentration-dependent manner. When embryos were treated with ryanodine at 10 M and 50
M, this caused significant abnormali-ties to both the myotome morphology and the organization of individual SMCs that increased in severity in a concen-tration-dependent manner (Fig. 15 E,F). Treatment at both concentrations caused a severe disruption of the ver-tical myoseptae and as a result also to the SMCs spanning the gap between them. Embryos treated with 10 M ryanodine still possessed obvious SMCs but these were interspersed with bright aggregates of myosin and F-actin that were largely located near the vertical myoseptae (Fig. 15 Ei-Eiii). This suggests that some of the outer-most (with respect to the midline) SMCs had become detached at one end from the vertical myoseptae and had con-stricted or collapsed, forming brightly-labeled aggregates. At 50 M, there were far fewer intact SMCs and far more bright aggregates (Fig. 15 Fi-Fiii). In addition, although at 10 M ryanodine, some sarcomeric banding was still observed in both the F-actin and myosin of the SMCs (Fig. 15 Ei*-Eiii*), at 50 M, this banding was com-pletely disrupted for both proteins (Fig. 15 Fi*-Fiii*).
In order to examine the effect of 2-APB and ryanodine on the number of SMCs per myotome unit, these were quantified within somite 8 in both un-treated and un-treated embryos. In the
Fig. 14. Expression of myosin and actin in the trunk musculature between 16 hpf and 24 hpf. (A-F) Embryos were fixed at the times indicated in the upper right corner of
each row of panels and then (Ai-Fi) the
myosin was labeled via immunohistochemis-try with the F59 myosin heavy chain antibody and (Aii-Fii) the F-actin was labeled with
rhodamine phalloidin. (Aiii-Fiii) The merged myosin and F-actin images, with the overlapping regions shown in yellow. Ca2+ signaling periods 1 and 2
(SP1 and SP2), and the Ca2+ signaling quiet period (QP; from Fig. 3) are also shown. (Gi-Giii) Higher magnification views of (Fi-Fiii), respectively, showing
the pattern of sarcomeric banding in the muscle fibers at 24 hpf. (Giii*) Higher magnification view of (Giii). S, A, H and I are sarcomere, A-band, H-zone
zebrafish embryos by microinjecting an apoaequorin-mRNA (aeq-mRNA) into 1-cell
stage embryos. Active aequorin was then re-constituted in vivo by incubating the embryos
from the 64-cell stage with the coelenterazine co-factor (Cheung et al., 2006). Although this
transient aequorin expression approach suc-cessfully extends the aequorin-based Ca2+ imaging window by an additional ~24 hours (to ~48 hpf), the aeq-mRNA is gradually degraded
in the injected embryos resulting in a steady decline in the production of apoaequorin (Cheung et al., 2006). Furthermore, as the
expression of aequorin is ubiquitous, and our current aequorin-based imaging platforms have no resolution in the z-axis, it is difficult to identify specific groups of cells, tissues or or-gan anlagen that are generating a particular signal in more complex, later stage embryos (Cheung et al., 2006). Thus, to follow-on from
this transient, ubiquitous aequorin expression technique, we now report the successful gen-eration of a transgenic zebrafish line that ex-presses apoaequorin targeted to the muscula-ture using a muscle-specific -actin promoter. Our new results show that this targeted apoaequorin is expressed as early as ~12 hpf (i.e., the 6-somite stage; Fig. 2B) and contin-ues to be expressed until at least 48 hpf, allowing visualization of trunk-generated Ca2+ transients up to ~52 hpf (data not shown), which enables us to more precisely image Ca2+ signaling during trunk muscle development in a regular and reproducible manner. Conse-quently, we identified two distinct periods of spontaneous Ca2+ signaling generated exclu-sively by SMCs in the trunk musculature, which occur between ~17.5 and 19.5 hpf (SP1) and from ~23 hpf onward (SP2), with a Ca2+ signal-ing quiet period (QP) of around 3.5 hours duration between the two (Fig. 3Ai).
Temporal characteristics of the SP1 and SP2 Ca2+ signals
From the data acquired via aequorin-based Ca2+ imaging (using both transgenic embryos and aeq-mRNA injected embryos) we show
that the SP1 and SP2 Ca2+ signals are gener-ated within a restricted number of anterior somites and at specific times in a regular and reproducible manner. Although the occurrence of trunk Ca2+ signals between ~17 hpf and ~24 hpf have been reported previously using
Fig. 15. Effect of 2-APB and ryanodine on the organization of the trunk musculature and the formation of sarcomeres. Embryos were either (A) untreated (controls) or else
(B-F) treated from 17 hpf to 20 hpf with: (B) 1% DMSO (DMSO control); (C,D) 2-APB at (C)
25 M or (D) 50 M; or (E,F) ryanodine at (E) 10 M or (F) 50 M. Embryos were then fixed
and the myosin and F-actin labeled with (Ai-Fi) the F59 myosin heavy chain antibody and
(Aii-Fii) rhodamine-phalloidin, respectively. (Aiii-Fiii) The merged myosin and F-actin
images, with the overlapping regions shown in yellow. (Ai*-Aiii* to Fi*-Fiii*) Higher
magnification views of (Ai-Aiii- Fi-Fiii), respectively, showing the level of sarcomeric
banding in the slow muscle fibers in the untreated and drug treated embryos. Scale bars are (Ai-Aiii to Fi-Fiii) 25 m and (Ai*-Aiii* to Fi*-Fiii*) 5 m.
case of ryanodine-treated embryos, a brightly-labeled aggregate was considered to be a collapsed SMC and was thus counted as such. Fig. 16 shows that both 25 m and 50 M 2-APB resulted in a significantly lower number of SMCs in this somite at p<0.001, when compared with the controls, but that ryanodine (at both 10
M and 50 M) had no significant effect on SMC number.
Discussion
Generation of muscle-specific apoaequorin-expressing trans-genic fish
aequorin as the Ca2+ reporter (Créton et al., 1998; Webb and Miller; 2000; Cheung et al., 2006), the detailed characteristics and
functions of these signals were not described or explored. Using fluorescent Ca2+ indicators, Brennan et al. (2005) subsequently reported and characterized (from a temporal perspective), a series of “nerve-mediated Ca2+ signals” that are generated in the SMCs of zebrafish from ~17 to 22 hpf. Our results confirm the generation of these signals, which correspond to what we have termed the SP1 Ca2+ signals, to distinguish them from the subse-quent post-QP SP2 Ca2+ signals. The QP and the SP2 signals represent two new discoveries with respect to the dynamic Ca2+ signaling patterns generated during SMC development. Further-more, the sudden appearance of the SP1 transients initially in somites 4 to 10, follow a period of quiescent Ca2+ signaling as far as the zebrafish trunk is concerned. We have previously reported that a period of relatively localized stochastic Ca2+ signaling occurs in the formed somites and to a much lesser extent in the pre-somitic mesoderm during the early segmentation period, i.e., during the 1 to 8 somite stages (~10 to 13 hpf; Leung et al., 2009).
However, both we and others have reported that prior to the sudden appearance of the pan-somitic SP1 signals at ~17.5 hpf, there is essentially a background resting level of Ca2+ within the zebrafish trunk (i.e., from all tissues) for at least 1 hour prior to the onset of SP1 (Figs. 3Ai, 12Bi and 12Ci; Gilland et al., 1999; Leung et al., 2009).
The data reported by Brennan et al. (2005) and our new
observations correlate with the first of three different types of movement behavior reported by Saint-Amant and Drapeau (1998). The first of these movements consists of spontaneous, alternat-ing left to right slow contractions of the trunk and tail, which were reported to begin suddenly at ~17 hpf, with an initial average frequency of ~0.57 Hz. They peaked at ~19 hpf with a frequency of ~0.96 Hz, and then gradually decreased to ~0.1 Hz per side of the embryo, i.e., one complete contraction cycle comprised of two alternating contractions, one on the left side, followed by one on the right side (Saint-Amant and Drapeau, 1998).
The maximum Ca2+ signaling frequency we recorded on one side of the embryo at ~19 hpf, however, was ~0.12 Hz, i.e., almost
an order of magnitude slower than the contraction frequency reported by Saint-Amant and Drapeau (1998). In both cases embryos were dechorionated as part of the experimental protocol to improve imaging. Saint-Amant and Drapeau (1998), however, immobilized just the head of the embryos with low melting point agarose, thus allowing the trunk and tail to move freely, whereas in our experiments, embryos were immersed in 3% methyl cellu-lose for the duration of imaging to prevent them moving out of the field of view. This may have restricted the degree of trunk/tail contraction, and thus explain the lower rates of Ca2+ signals observed during our imaging experiments. However, the onset-times of the trunk/tail contractions reported by Saint-Amant and Drapeau (1998), and the spontaneous Ca2+ signaling activities that we visualized (i.e., at ~17 and ~17.5 hpf, respectively), are remarkably similar. Indeed, while our aequorin-based imaging system did not allow us to record whether or not a trunk/tail contraction accompanied a Ca2+ signal, we were able to confirm this correlation during our confocal fluorescent Ca2+ imaging experiments, (see Supplemental Movie #1).
We also report an additional new observation regarding a slow rising component of SMC Ca2+ activity during SP1, that started at ~18 hpf, reached a maximum at ~18.75 hpf and then returned to its original resting value by ~19.5-20 hpf (Fig. 3Ai). At present, we do not understand the significance or developmental function of the slow rising Ca2+ component. It could, however, be completely abolished via treatment with either 2-APB or ryanodine (Figs. 12Bi,Ci) suggesting a dual generation mechanism that involves Ca2+ release from both receptor types. The appearance of the slow rising component correlates with the beginning of the higher frequency oscillations of SP1 (Fig. 3Ai), the expression of RyRs (Fig. 13Bii) and the appearance of organized sarcomeres in all the SMCs (Fig. 14Ciii). A somewhat similar slow rising Ca2+ compo-nent, with accompanying super-imposed Ca2+ spiking, has been reported during the process of neural induction in Xenopus
development (Leclerc et al., 2000). It was subsequently shown
that these Ca2+ signals correlated with the expression pattern of the early neural precursor gene, Zic3 (Leclerc et al., 2003).
SP1 ends at ~19.5 hpf (Fig. 3), as embryos enter into the QP. We are assuming, therefore, that zero Ca2+ signaling activity in the slow muscle between 19.5 and 23 hpf equates to no contrac-tile activity during this period. Saint-Amant and Drapeau (1998) do report that in their methyl cellulose-free set-up, the frequency of the spontaneous trunk/tail contractions begins to fall following a peak at ~19 hpf. However, they also describe the onset, at ~21 hpf, of a second type of locomotor behaviour, which they called a “touch-evoked” response. Under our experimental conditions, embryos were never subjected to any touch stimulation. Further-more, our methyl cellulose embedding protocol may have in some way speeded up the fall in spontaneous contractile activity, leading to the establishment of the QP at ~19.5 hpf.
It is interesting to note, however, that the QP of Ca2+ signaling from the SMCs coincides with a period (i.e., from 21 to 22 hpf) of intense spontaneous Ca2+ signaling activity within the developing spinal cord of the zebrafish embryo (Ashworth and Bolsover, 2002). We failed to detect these spinal cord transients either due to the tissue-specificity of apoaequorin expression in our aequorin-based imaging experiments, or due to the focal plane selected for the fluorescence-based confocal scanning. Thus, the QP ap-pears to correlate with a transition from spontaneous contractile
Fig. 16. Bar chart to show the effect of 2-APB and ryanodine on the number of SMCs in somite 8. Data are expressed as means SEMs of 3-4 experiments. Asterisks indicate data that are significantly different
from the DMSO control at p<0.001, as determined by the Student’s t-test