PRELIMINARY COMMUNICATION
Beware of ligand efficiency (LE):
understanding LE data in modeling
structure-activity and structure-economy
relationships
Jaroslaw Polanski
*, Aleksandra Tkocz and Urszula Kucia
Abstract
Background: On the one hand, ligand efficiency (LE) and the binding efficiency index (BEI), which are binding prop-erties (B) averaged versus the heavy atom count (HAC: LE) or molecular weight (MW: BEI), have recently been declared a novel universal tool for drug design. On the other hand, questions have been raised about the mathematical validity of the LE approach.
Results: In fact, neither the critics nor the advocates are precise enough to provide a generally understandable and accepted chemistry of the LE metrics. In particular, this refers to the puzzle of the LE trends for small and large mol-ecules. In this paper, we explain the chemistry and mathematics of the LE type of data. Because LE is a weight metrics related to binding per gram, its hyperbolic decrease with an increasing number of heavy atoms can be easily under-stood by its 1/MW dependency. Accordingly, we analyzed how this influences the LE trends for ligand-target binding, economic big data or molecular descriptor data. In particular, we compared the trends for the thermodynamic ∆G data of a series of ligands that interact with 14 different target classes, which were extracted from the BindingDB data-base with the market prices of a commercial compound library of ca. 2.5 mln synthetic building blocks.
Conclusions: An interpretation of LE and BEI that clearly explains the observed trends for these parameters are pre-sented here for the first time. Accordingly, we show that the main misunderstanding of the chemical meaning of the BEI and LE parameters is their interpretation as molecular descriptors that are connected with a single molecule, while binding is a statistical effect in which a population of ligands limits the formation of ligand-receptor complexes. There-fore, LE (BEI) should not be interpreted as a molecular (physicochemical) descriptor that is connected with a single molecule but as a property (binding per gram). Accordingly, the puzzle of the surprising behavior of LE is explained by the 1/MW dependency. This effect clearly explains the hyperbolic LE trend not as a real increase in binding potency but as a physical limitation due to the different population of ligands with different MWs in a 1 g sample available for the formation of ligand-receptor complexes.
Keywords: Ligand efficiency, Ligand-target binding affinity, Fragmental metrics, Weight metrics, Molar metrics, Avogadro number, Big data
© The Author(s) 2017. This article is distributed under the terms of the Creative Commons Attribution 4.0 International License (http://creativecommons.org/licenses/by/4.0/), which permits unrestricted use, distribution, and reproduction in any medium, provided you give appropriate credit to the original author(s) and the source, provide a link to the Creative Commons license, and indicate if changes were made. The Creative Commons Public Domain Dedication waiver (http://creativecommons.org/ publicdomain/zero/1.0/) applies to the data made available in this article, unless otherwise stated.
Background
Ligand efficiency (LE), which is the free energy of bind-ing (B) averaged versus the heavy atom count (HAC), has
recently been declared to be a novel universal tool for drug design that will permit the substantial optimization of both molecular mass and lipophilicity by ameliorating the inflation of these properties that has been observed in current medicinal chemistry practice and to increase the quality of drug candidates [1]. As this effect may have resulted from the application of current procedures that
Open Access
*Correspondence: [email protected]
are based on the common use of IC50 or binding affinity
(Ki) in drug optimization, the efficiency approach appears
to be especially attractive in controlling both the molar binding potency and HAC or molecular weight (MW) at the same time.
However, questions have recently been raised about the mathematical validity of the definition of LE [2–4]. Specifically, for example, as indicated by the anony-mous reviewer of the first version of this publication:
LE, whether derived from deltaG, Kd, Ki, or IC50, has an arbitrary 1 M concentration unit built into it. Changing this unit will, in general, result in a change in the per-ception of efficiency. Therefore, the dependence of LE, e.g. derived from deltaG, on the concentration used to define the standard state implies that LE derived from deltaG is thermodynamically meaningless. However, despite the fact that although the con arguments were basically introduced as early as 2009 [4], the situation is still not clear, just to cite a recent discussion. In the Ref. [5] we read: LE […] widely used to normalize potency for size, does not, in fact, normalize potency for size. LE decreases and appears to plateau as size, or number of heavy atoms, increases. Several plausible hypotheses were proposed to explain this observation in terms of ligand flexibility and/ or entropic penalties, reduced surface area available for interaction, target specific restrictions and size-dependent complexity that reduced the probability of optimal fitting. The answer requires a simple example of fuel efficiency
to justify the mathematics of LE trends [6]. In fact, nei-ther the critics nor the advocates were precise enough to provide any understandable mathematics or chemistry of the LE metrics. Moreover, because these parameters are in common use as early estimators for drug optimization, apparently the numerous con arguments appeared to be not convincing enough for the drug design audience. The reason is that this allowed for the understanding of the mathematical or chemical inaccuracies; however, they have never cleared the reason for the observed puzzle of the LE (BEI) hyperbolic trend explicitly enough. Because the trend obviously indicates an advantage in binding efficiency for the small molecules, which is both attrac-tive and expected in drug design, the LE (BEI) approach has become more and more popular in academia and pharma drug design.
Herein, we show that the basis for the LE (BEI) puz-zle can be cleared up by a careful analysis of its chemical meaning. Accordingly, we demonstrated that the main misunderstanding of the chemical meaning of the BEI and LE parameters is their interpretation as molecular descriptors that are connected with a single molecule, whereas binding is a statistical effect in which a popu-lation of ligands is an important factor that determines the pairing of ligand-receptor complexes. Therefore, LE
(BEI) should not be interpreted as molecular (physico-chemical) descriptors (binding per Dalton) but as statis-tical properties (BEI—binding per gram, where a gram is a mole of Daltons); (LE—binding per a mole of HAC). Accordingly, the puzzle of the surprising behavior of LE is explained by the 1/MW dependency of a 1 g substance of molecules that have the MW, which is a property that can be measured. This effect clearly explains the hyper-bolic LE trend not as the real increase in binding potency but by the availability of ligands for the ligand-receptor complexes. Additionally, we analyzed the LE-type inten-sive parameters including a broad spectrum of both molecular descriptors and properties. We demonstrated that individual LE trends can be explained by the basic rules of chemistry, thereby indicating how important it is to distinguish between molecular descriptors and prop-erties [7, 8]. More specifically, we compared two datasets. The first was the experimental binding thermodynamics for approximately 100 protein–ligand complexes [9]. The second was the big data of the market prices of a large commercial library of building blocks [10].
Methods
Molecular descriptors versus properties
Basically, chemical compounds, i.e. both molecules and substances, can be represented by molecular descriptors, i.e. indicators that relate to the molecule or molecular structure that can be calculated from a molecular rep-resentation or by the properties that are to be measured experimentally if there are real values or that require predictions during molecular design [7]. However, it is not always easy to distinguish between these two data types. Let us analyze molecular weight (MW). It can be a property when measured for molecules, e.g. in MS spectrometry or even when we are weighting a mole, i.e. the Avogadro number of the molecules or its fraction, but alternatively it can also be a descriptor when we are estimating the MW of a single molecule simply by sum-ming the atomic mass contributions to the total MW. The weight of 1 mol of a substance will be its MW (g/mol), while the weight of a single molecule will be its MW (Da). The correlation between these two variables is 100% and creates a major trick in chemistry when we are mapping substances to molecules and vice versa. In fact, we need an Avogadro number (NA), which is a chemical routine,
for this transformation that is generally overlooked. Therefore, MW (Da) * NA = MW (g/mol).
LE definitions and metrics
interpret these parameters in their widest sense as given below:
where the binding property is any property that is meas-ured in order to define the interactions between a ligand and a receptor and HAC is the heavy (nonhydrogen) atom count.
where the binding property is any property that is meas-ured in order to define the interactions between a ligand and a receptor and MW corresponds to the molecular weight in Daltons (Da).
Generally, in the literature both LE and BEI are inter-preted as molecular descriptors in the sense of phys-icochemical descriptors, for BEI compare especially Cortes-Ciriano [11] and Abad-Zapatero et al. [12]. In the context of the differentiation of the molecular descriptors and properties discussed in previous paragraph, these are (binding) properties per molecular fragment defined by the MW (Da) or the HAC (number of atoms). It has been completely overlooked, that alternatively, BEI can be interpreted directly as a property, the direct measure of the binding of a 1 g sample of a substance. Accordingly, LE is a property—a direct measure of the binding of a mole of HAC.
LE was originally developed in order to compare the maximal ligand-target affinity [13] including small, nonhydrogen ligand cations or anions. This, in turn, determined that non-hydrogen atom count, namely HAC, was the natural normalizing measure. However, the atom count (AC), hydrogen count or molecular weight can generate analog metrics. On the other hand, we can substantially broaden the LE definition to include any property (P) or molecular descriptor (MD). Thus, defining the efficiency parameter (PE or MDE), which for a property normalized versus HAC (as for a standard LE) will be defined by:
where Pmol relates to a molar-normalized property, e.g.
molar-binding affinity.
Data sets
The thermodynamic ∆G data of a series of 102 protein– ligand complexes that interact with 14 different target classes were assembled by gathering bioactivity informa-tion from the BindingDB database [9] by Reynolds and Holloway.
The catalog data for a commercial compound library of ca. 2.5 mln synthetic building blocks were downloaded from the internet site (http://www.abamachem.net/). This
(1)
LE=binding property/HAC
(1a)
BEI=binding property/MW
(2)
PEHAC=Pmol/HAC
large library includes 2,248,243 chemicals that are offered on the market [10]. The database contains easily accessi-ble information that can be downloaded in the SDF for-mat. The records were carefully inspected before further processing, e.g. duplicated notations were removed.
Calculations were performed using the KNIME Ana-lytics Platform (version 3) on an Intel Core 2 Duo CPU 1.80 GHz computer system with 4.00 GB RAM and a 64-bit Windows 10 operating system. Instant JChem ver-sion 14.7.28.0, which was released in 2014, and additional self-programmed scripts were used for structure data-base management. Graphs were plotted using MATLAB version R2015b.
Results and discussion
In practice, LE is much more popular in drug design than BEI. Equation 2, which is the definition of LE, can be con-verted to:
where Pmol relates to a molar-normalized property, e.g.
molar-binding affinity.
Equation 3 allows us to precisely understand the chemical sense of LE mapping. Accordingly, PEHAC is the
interaction of two terms. The first is Pmol/MW, i.e. Pmol
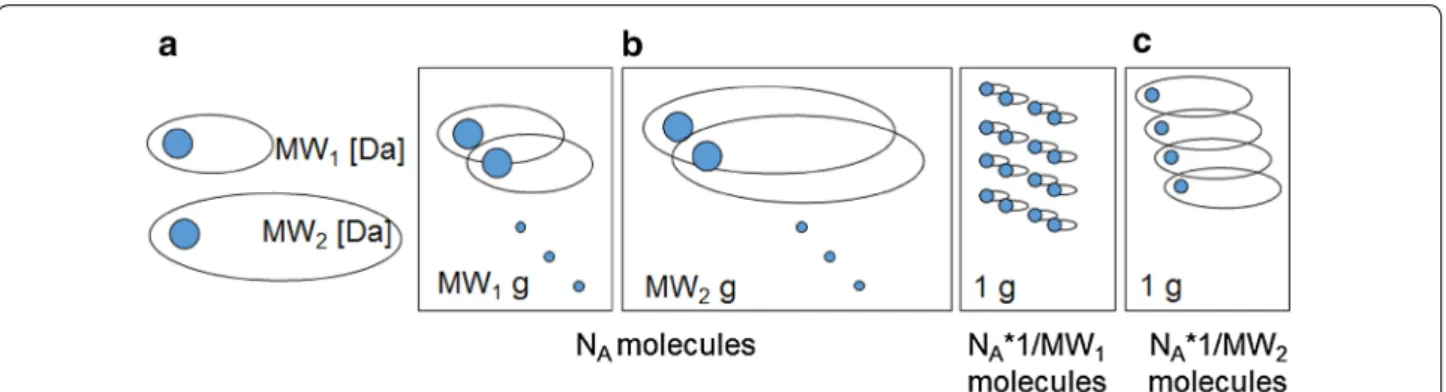
normalized by MW. This term defines also BEI which is a possible LE alternative [12]. A second term MW/ HAC rescales BEI into the HAC dimension. To properly understand the operations described by Eqs. 2 and 3, we explained the fragmental (Fig. 1a), molar (Fig. 1b) and weight (Fig. 1c) metrics that are used to map atomic mol-ecules (Fig. 1a) into a real substances (Fig. 1b, c) in chem-istry. In order to calculate LE, we use fragmental metric (Fig. 1a) in an attempt to calculate the share of binding for a single Da (HAC fragment) in a single molecule (Fig. 1a) indicated in blue in Fig. 1. Mapping molecules to a mole of a substance, a mole metric (Fig. 1b), will pre-serve the same number of molecules (NA), but the weight
of the samples of 1 mol will differ and amount to MW1
and MW2 grams, respectively. Alternatively, mapping by
weight metric will preserve the constant weight, e.g., 1 g. A surprising feature of the latter method of mapping is that the difference in a number of molecules in 1 g will be given by the numbers of NA * 1/MW1 and NA * 1/MW2,
respectively. A surprise here comes from the fact that we are simply not accustomed to this metric. Although, we do not realize this fact, the weight metric is often used in medicinal chemistry, e.g. when measuring binding affin-ity or IC50 (Pgram), we test the weighted samples (g) in
order to obtain the Pgram in (kcal/g) and eventually, at the
very end, recalculating the Pgram into the Pmol scale.
In turn, because binding affinities are given in the lit-erature as Pmol, therefore, Pgram can be calculated from
(3)
the simple equation Pgram = Pmol/MW, which essentially
looks the same as the first term in Eq. 3, however, frag-mental descriptor refers to a single molecule, while bind-ing affinity refers to a substance. Although formally we need the Avogadro number NA to relate the measured
affinity and the affinity of a single molecule (or single fragment), we can do without NA because the MW (Da)
(molecular descriptor) and the mole of a substance MW (g/mol) (a property) are the same values.
The most interesting features of the metrics in Fig. 1
are that:
1. All three measures in Fig. 1 preserve a steady invari-able size of the 1 Da fragment
2. Unlike the molar measure (Pmol), the weight metric, LE (BEI), does not have a thermodynamic meaning because the concentration of ligands is not normal-ized for the molecules of different sizes and
3. The multiplier, which scales a molecule to a constant weight is proportional to 1/MW.
Generally, LE (BEI) is interpreted in the literature as a
molecular physicochemical descriptor that relates to a sin-gle molecule. This appears to be the main misunderstand-ing because both the concentration and the bindmisunderstand-ing are statistical properties that are related to molecular popula-tions. Accordingly, LE (BEI) are also properties. The con-centration here determines a population of the ligands that are available for the receptor to form ligand-receptor complexes, while Pmol determines binding potency. The trend of binding efficiency versus molecular descriptor and economic price
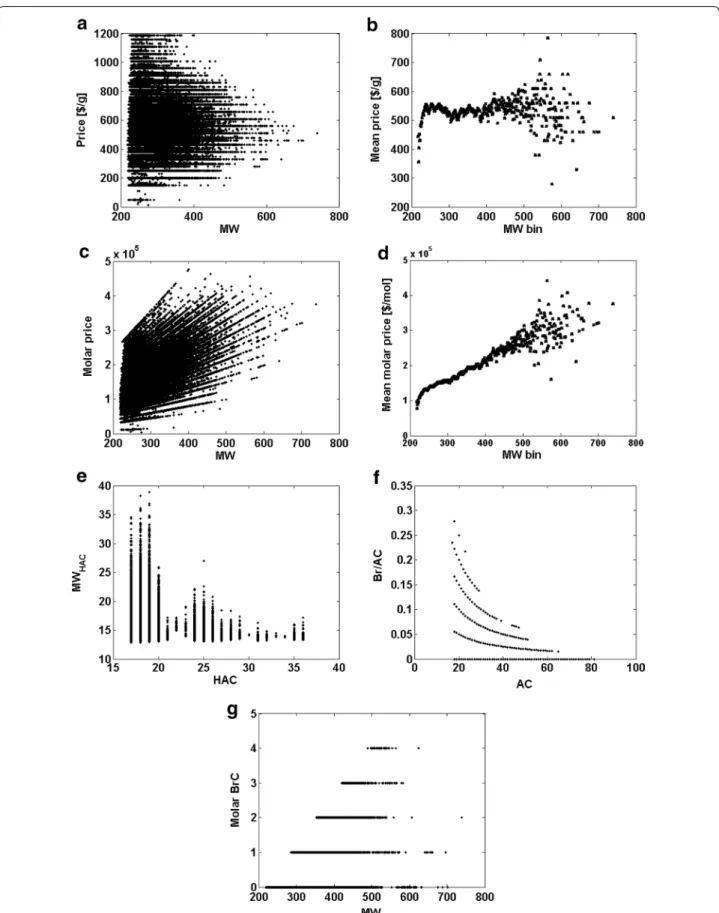
In Fig. 2a, c we plotted the BEI and LEHAC for the
thermo-dynamic ∆G data of a series of ligands that interact with 14 different target classes, which were extracted from the BindingDB database by Reynolds and Holloway [9],
respectively. We can see that a hyperbole approximates the data for BEI. The large differentiation of the targets means that deviations from the model can be observed; however, the trend is obvious.
In order to become more familiar with the LE type metrics in Table 1, we analyzed the impact of the indi-vidual terms of Eq. 3 to illustrate their chemical meaning and mathematics. Therefore, Eq. 3 can be decomposed into Eq. 3a:
Accordingly, PEHAC is now the interaction of three
terms. The first term is molar property, second is 1/ MW—a number of molecules in a 1 g sample of mole-cules of the weight MW (Da) (a population term) and a third term, the MW to HAC rescaling factor. Essentially, the population term 1/MW dominates the real molar property Pmol and the MW to HAC rescaling factor is
more or less a constant value as MW versus HAC has a close to linear relationship for the thermodynamic ∆G data analyzed in this publication. Therefore, the popu-lation term 1/MW and not a real property explains the trend of LE, thereby solving the puzzle of LE behavior. This determines a significant increase of LE for a small MW and a plateau for a high MW.
We could conclude at this point that the chemistry of LE behavior is trivial. In our opinion it is not the case, and it is not a coincidence that LE has been misinterpreted in significant articles in high impact journals (PNAS [13], Nature Reviews Drugs Discovery [1]). We can better understand the origins of this delusion by probing the LE models for nonbinding parameters.
First, problem is to identify such models. The relation-ship between a chemical structure and its physical or chemical properties is an essential concept in chemistry and this method is an important decision-making guide, for example, in drug design. In fact however, it is the
(3a)
PEHAC=Pmol∗ 1/MW∗MW/HAC
market that eventually decides the success of any phar-maceutical; therefore; we need economic considerations to fully understand a fate of a drug. Economic behav-ior, in particular, a price of a drug is an example of the nonbinding parameter important for molecular design. Is there any relationship between a chemical structure of a drug and its economic potential? On the one hand, explaining economic effects is an extremely complex issue. On the other hand little market data is available for drugs. Accordingly, the problem remains unexplored. In contrast, to drugs a variety of economic data are available for other chemicals. Therefore, in Fig. 3a–d, we present a structure-economy analysis for a commercial compound library of ca. 2.5 mln synthetic building blocks [10]. It is critical to note that the price, which is an economic property, is typically listed in the catalogs of chemi-cal compounds in $/g (Fig. 3a) and not $/mol (Fig. 3c), which means the efficiency scale is standard in econom-ics. The relationships observed in Figs 3a, c determines market behavior of a large quantity of chemicals. This decides that instead of a single model a bunch of linear plots can be identified in Fig. 3c relating molar prices to
MW, while weight prices (Fig. 3a) form a series of hori-zontal plots, i.e., within each individual plot weight price does not depend upon MW (Fig. 3a). To further inves-tigate the price data in Fig. 3b, d, we illustrated their MW binned statistics. This indicates that in economics the price of a sample normalized by weight is on aver-age unvarying across a large range of MWs, while mean molar price forms a linear plot versus MW. Accordingly, with a decreasing MW, on average, we can get a larger number of molecules at the same price. Instead, if nor-malized to the molar metric, the same fragments are cheaper at smaller MWs. Interestingly, even now the plot of the mean price (the LE type parameter) versus MW indicates a drop of prices at the low MWs, which can be interpreted as a hyperbolic like trend (Fig. 3b). However, this effect can be observed only within the lowest MW range, despite the fact that the molar and weight met-rics are in a similar mathematical relation as the binding properties, i.e. the price $/g is given by the interaction of the molar price and 1/MW. Mean molar price is more or less a linear function of MW (Fig. 3d) or in other words, an increase of MW also means an increase of the weight
of a sample to be paid. The larger the quantity of weight, the larger is also the price, which is one of the essential rules of economics. Accordingly, a comparison of the
binding versus economic LE data type illustrates that the understanding of important chemical effect is required to understand the LE trends versus molecular size. While
Table 1 Chemical meaning and mathematical function of the individual terms that define LE (Eq. 3a)
No. Chemistry Mathematics Remarks
1 Molar property
NAmolecules, of the total weight MW
grams.
There is no general trend
in molar property versus
MW relationship
2. Population term
NAvirtual fragments of the weight 1 Da
or
a 1 g substance (1/MW * NAnumber of
molecules).
Molecular descriptor for fragments but property for
molecules
1/MW can be in mol/g (property) or
Da-1
(fragmental descriptor)
3. MW to HAC rescaling term
This can be a linear plot, as shown, but can
also form a complex relationship, e.g., Fig. 3e
the stoichiometry of ligand-target pairing limits the bind-ing LE, the macroscopic weight determines the price. Unlike binding, pricing is not a statistical property; there-fore, hypothetically, the price can tag a single molecule.
Recently, ratio type descriptors have been used more frequently in drug design [14]. This includes parameters such as ratio of O/(N + O) [14] or the number of molecu-lar fragments, e.g. a fraction of sp3 carbons to all of the carbon atoms [15]. Therefore, in Fig. 3e–g, we present several molecular descriptors which show the molar and weight normalization, respectively, and was calculated for a large chemical compound library of ca. 2.5 mln chemical compounds. The first is a simple example, i.e. MW/HAC versus HAC (Fig. 3e). In particular, we can observe that MW versus HAC does not always have a linear relation-ship. In turn, Fig. 3f shows a plot of the number of arbi-trarily selected atoms, e.g., bromines (Br count; BrC), that was normalized by the atom count (AC), i.e. the BrCAC
(Br/AC) within this library. The individual hyperbo-les map the molecuhyperbo-les that have the same number of Br atoms. A question now arises of whether we can identify any chemical property that scales acc. to the weight met-ric. The answer is positive because we can discover that a simple analytical attribute of the percentage content follows this metric. In turn, if we probe a relationship of bromine count BrC versus MW, then, BrC will take an integer value indicating bromine atoms in a single mole-cule, which obeys a molar scale rule as is shown in Fig. 3g. Molecular descriptors and properties of the efficiency type can support us in illustrating various chemical and pharmaceutical effects. The nonlinearity of the hyperbolic population term is of potential interest in modeling in pharma and chemistry. However, this requires a complete understanding of the metrics that are used and the chemi-cal effects that determine these metrics.
Conclusion
In conclusion, in this paper, the chemical meaning and mathematical form of ligand efficiency (LE) type data is explained. Therefore, LE is related to binding per gram (property) while the puzzle of the surprising behavior of LE is explained by the 1/MW dependency of the weight metric. We analyzed how this influences the weight-nor-malized data for economic and molecular property and descriptor data.
Abbreviations
MW: molecular weight; HAC: heavy atom count; AC: atom count; BrC: bromine count; LE: ligand efficiency; the indexes, e.g. MW or HAC refer to the scaling factor, e.g. MW or HAC; BEI: binding efficiency index; P: property, where mole
or gram indexes refer to the molar or weight metrics, respectively; NA: Avoga-dro number.
Authors’ contributions
JP provided the concept and solution for the problem, analyzed the data and wrote the manuscript. AT and UK contributed to the data acquisition, process-ing, analyses and preparation of the final manuscript. All authors read and approved the final manuscript.
Competing interests
The authors declare that they have no competing interests.
Funding
The research reported in this publication was supported by the NCBR Grants: ORGANOMET No: PBS2/A5/40/2014 and TANGO1/266384/NCBR/2015.
Publisher’s Note
Springer Nature remains neutral with regard to jurisdictional claims in pub-lished maps and institutional affiliations.
Received: 13 March 2017 Accepted: 4 September 2017
References
1. Hopkins AL, Keseru GM, Leeson PD, Rees DC, Reynolds CH (2014) The role of ligand efficiency metrics in drug discovery. Nat Rev Drug Discov 13:105–121
2. Kenny PW, Leitao A, Montanari CA (2014) Ligand efficiency metrics con-sidered harmful. J Comput Aided Mol Des 28:699–710
3. Matta CF, Massa L, Gubskaya AV, Knoll E (2011) Can one take the logarithm or the sine of a dimensioned quantity or a unit? Dimensional analysis involving transcendental functions. J Chem Ed 88:67–70 4. Zhou HX, Gilson MK (2009) Theory of free energy and entropy in
nonco-valent binding. Chem Rev 109:4092–4107
5. Shultz MD (2014) Improving the plausibility of success with inefficient metrics. ACS Med Chem Lett 5:2–5
6. Murray CW, Erlanson DA, Hopkins AL, Keserü GM, Leeson PD, Rees DC, Reynolds CH, Richmond NJ (2014) Validity of ligand efficiency metrics. ACS Med Chem Lett 5:616–618
7. Polanski J, Gasteiger J (2016) Computer representation of chemical compounds. In: Leszczynski J, Puzyn T (eds) Handbook of computational chemistry. Springer, Dordrecht, pp 1–43
8. Perczel A, Atanasov AG, Sklenar V, Novacek J, Papouskova V, Kaderavek P, Zídek P, Kozłowski H, Watly J, Hecel A, Kolkowska P, Koca J, Svobodova-Varekova R, Pravda L, Sehnal D, Horsky V, Geidl S, Enriz RD, Matejka P, Jenistova A, Dendisova M, Kokaislova A, Weissig V, Olsen M, Coffey A, Ajuebor J, Keary R, Sanz-Gaitero M, Raaij MJ, McAuliffe O, Waltenberger B, Mocan A, Smejkal K, Heiss EH, Diederich M, Musiol R, Kosmrlj J, Polanski J, Jampílek J (2016) The eighth central European conference “chemistry towards biology”: snapshot. Molecules 21:1381
9. Reynolds CH, Holloway MK (2011) Thermodynamics of ligand binding and efficiency. ACS Med Chem Lett 2:433–437
10. Polanski J, Kucia U, Duszkiewicz R, Kurczyk A, Magdziarz T, Gastaiger J (2016) Molecular descriptor data explain market prices of a large com-mercial chemical compound library. Sci Rep 6:28521
11. Cortes-Ciriano I (2016) Benchmarking the predictive power of ligand efficiency indices in QSAR. J Chem Inf Model 56:1576–1587
12. Abad-Zapatero C, Metz JT (2005) Ligand efficiency indices as guideposts for drug discovery. Drug Discov Today 10:464–469
13. Kuntz ID, Chen K, Sharp KA, Kollman PA (1999) The maximal affinity of ligands. Proc Natl Acad Sci USA 96:9997–10002
14. Schneider N, Lowe DM, Sayle RA, Tarselli MA, Landrum GA (2016) Big data from pharmaceutical patents: a computational analysis of medicinal chemists’ bread and butter. J Med Chem 59:4385–4402