INVESTIGATION OF HOUSE OF QUALITY FOR
STEEL RE ROLLING MILLS (SRRMS) – AN
EXCELLENCY APPROACH TO MAINTENANCE
QUALITY FUNCTION DEPLOYMENT (MQFD)
Jacob P. George
1and V.R. Pramod
21
Research Scholar, Mechanical Engineering, Karpagam University)
2
Associate Professor, Dept. Of Mechanical Engineering, N.S.S College Of Engineering, Palakkad.
ABSTRACT
Mild Steel bars are mainly used for the reinforced concretes. There are more than 1500 Steel Re Rolling Mills (SRRMs) working in India. Small, medium and large companies are manufacturing reinforcement steel bars with different process and qualities. Different process is used for the production in SRRMs. Thermo Mechanical Treated (TMT) processed bars are the latest brand available now. House of Quality Matrix, aids in determining whether a product meets customer needs. Through the analysis of House of Quality, the customer language may be converted in to the technical language. The steps involved and results and conclusions are explained here. House of quality preparation is the initial step for the Maintenance Quality Function deployment (MQFD). MQFD has been developed by linking Total Productive Maintenance (TPM) and QFD.
Keywords: House of Quality (HOQ), Steel Re Rolling Mills (SRRMs), Thermo Mechanical Treated (TMT) steel bars, Total Productive Maintenance (TPM , Quality Function Deployment (QFD),), and Maintenance Quality Function Deployment (MQFD).
1. INTRODUCTION
Quality function deployment (QFD) is a planning and team problem-solving tool that has been adopted by a wide variety of companies as the tool of choice for focusing a design/maintenance team’s attention on satisfying customer needs throughout their product development process (Bossert, 1991).Here the customers need of Steel Re Rolling Mills (SRRMs) are analysed to see that their suggestions are identified and given due consideration by the company. QFD analysis converts the customers voice in to a technical language so that in the Maintenance program called Maintenance Quality Function Deployment (MQFD) of the company may be able to minimise their issues facing at production techniques and reduces the wastage of power, labour, consumables, raw materials etc. MQFD is a largely graphical method that aids a design team in identifying systematically all of the elements that go into the product development process and creating relationship matrices between key parameters at each step of the process. The information required for the QFD process forces the design team to answer questions that might be glossed over in a less rigorous methodology and to learn what it does not know about the problem. Because it is a group decision making activity, it creates a high level of buy-in and group understanding of the problem. MQFD, like brainstorming, is a tool for multiple stages of the design (Clausing, Pugh, 1991).
1.1 STEEL RE-ROLLING MILLS (SRRMs)
The SRRMs are characterized by the hourly capacity of the mills. Small scale mills are covered around 3 to 14 tonnes per hour (TPH), whereas the medium scale mills are covered between 15 and 49 TPH and the large-scale mills are above 50 TPH. Steel re-rolling is the popular method of producing finished steel all over the world. With the increasing requirement of steel in the country and limitations of the main steel producers to meet this growing demand, the secondary steel sector is an alternative and viable solution to meet the country’s future steel requirements. (Jacob, Pramod (2014) now special types of steel products with different quality are available in the market. The re-heating furnaces are the heart of the SRRM. The primary energy sources used in the SRRMs are electricity, coal or furnace oil. Thermal energy is required for heating the ingots or billets before the rolling operations. Electrical energy is required to run the mill along with other auxiliaries of furnace; mill, material handlings and lighting. The SRRM sector constitutes an unavoidable link in the overall supply chain of steel in the country. The dire ct energy cost in the SRRMs is estimated at 25 – 30% of overall production cost.
1.1.1 THE PROCESS OF MANUFACTURING
Billets/ blooms are used for the long bars. Slabs are also used ingeniously to roll large long products (such as beams). Semi-finished products are first heated in a re-heat furnace until they are red hot (around 12000 C) then pressure will be applied to squeeze the hot steel passing through them and arranged so as to form the steel into the required shape. The roughing stand is the first part of the rolling mill. The large semi-finished product is often passed backwards and forwards through it several times. Each pass gradually changes the shape and dimension of the steel closer to that of the required finished product. Before reaching the end points heat treatment and other operations say Thermo Mechanically Treated (TMT) are undergone for getting good qualities to the products.
1.1.2Thermo mechanical treated process (TMT)
and bend ability a notable saving in alloy cost per ton.(Degarmo, E. Paul et al) (2003), The process involves heating of steel billets in a reheating furnace and rolling them through a sequence of rolling stand, which progressively reduce the billet to the final size and shape of the reinforcing bar. As the bars leave the final mill stand, they are submitted to a special heat treatment involving three stages such as quenching, tempering and cooling stages. At quenching stage, water is sprayed to the hot rolled bars. The effectiveness of the water spraying equipment at this stage is critical as to rapidly harden the surface layer only, faster than the critical rate, to form the martensite while core remains austenite. In the tempering stage the bar leaves the water quenching line and is exposed to air. The heat flux from the still hot core reheats the surface by conduction thus self-tempering the surface to a structure called "Tempered Martensite" which is strong and tough. The core is still austenitic at this stage only. (K.A. Taylor et al, (1992) at the stage of "Atmospheric Cooling" on the cooling bed, the austenitic core are transformed to a ductile ferrite pearlite core. The final structure consists of a combination of a strong outer layer of tempered martensite and a ductile core of ferrite-pearlite. ( Jayanta Bagchi,(2005).
2. Quality Function Deployment (QFD)
Dr. Mizuno, professor emeritus of the Tokyo Institute of Technology, is credited with initiating the quality function deployment (QFD) system. In 1972, Japan, the first application of QFD was at Mitsubishi, Heavy Industries, Ltd., in the Kobe Shipyard. In 1980s many companies started the training of QFD in Japan and were successfully implemented in the production side. As a base, a 20% reduction in start up costs was reported in the launch of the new venture in 1980 and 38% reduction by 1982, and a cumulative 61% reduction by 1984. QFD was first introduced in the United States in 1984 by Dr. Clausing of Xerox (Akao yoji Ed (1990). QFD can be applied to practically any manufacturing or service industry. It has become a standard practice by most leading organizations, which also require it of their suppliers. Quality function deployment (QFD) is a planning tool used to fulfil customer expectations. It is a disciplined approach to product design,
engineering, and production and provides in-depth evaluation of a product
(www.masetllc.com/products/418.shtml).
The term Quality Function Deployment (QFD)was developed to bring this personal interface to
manufacturing and business. Now, industrial society, where the growing distance between producers and users is a concern, QFD links the needs of the customer (end user) with design, development, engineering, manufacturing, and service functions. (Akao Yoji. (1990a) We can say QFD are; Customer requirements Identification, Incorporating Quality systems thinking + Knowledge + Psychology, Strategic stay ahead of the game, Value addition maximization, Customer Satisfaction through comprehensive quality system. From the customer's perspective, Quality function Deployment provides a system of comprehensive development process for understanding true customer needs. It offers 'value' means to the customer, from the customer's perspective and understanding how the customers become concerned, prefer, and are satisfied. QFD is analyzing how do we know the needs of the customer and then deciding what features to be included? QFD determines what level of performance to be delivered intelligently relating the needs of the customer with a particular design, development, engineering, manufacturing, and service functions of a company ( Joseph P. Ficalora, Louis Cohen,2012) )
does so by seeking both spoken and unspoken needs, identifying positive quality and business opportunities, and translate these into actions and designs by using transparent analytic and prioritization methods, empowering organizations to exceed normal expectations and provide a level of unexpected excitement that generates value. (Akao Yoji, Ohfuji Tadashi 1989) QFD is a customer-oriented quality management and product development technique originally used for hard products, but its ideas are by no means inapplicable to soft services. Every successful company has always used data and information to help in its planning processes. In planning a new product, engineers have always examined the manufacturing and performance history of the current product. They look at field test data, comparing their product to that of their competitor’s product. ( Bahill, , Chapman, 1993). They examine any customer satisfaction information that might happen to be available. Unfortunately, much of this information is often incomplete. It is frequently examined as individual data, without comparison to other data that may support or contradict it.
By contrast, QFD uses a matrix format to capture a number of issues that are vital to the planning process. The House of Quality Matrix is the most recognized and widely used form of this method. It translates customer requirements, based on marketing research and benchmarking data, into an appropriate number of engineering targets to be met by a new product design. Basically, it is the nerve centre and the engine that drives the entire QFD process. It is “a kind of conceptual map that provides the means for inter functional planning and communication.” There are many different forms of the House of Quality, but its ability to be adapted to the requirements of a particular problem make it a very strong and reliable system to use. Its general format is made up of six major components. These include customer requirements, technical requirements, a planning matrix, an interrelationship matrix, a technical correlation matrix, and a technical priorities/benchmarks and targets.( Bosserman, 1992)
The structure of QFD can be thought of as a framework of a house, as shown in Figure 1.
T e c h n i c a l D e s c r i p t o r s ( V o i c e o f t h e o r g a n i z a t i o n )
P r i o r i t i z e d T e c h n i c a l D e s c r i p t o r s I n t e r r e l a t i o n s h i p
b e t w e e n
T e c h n i c a l D e s c r i p t o r s
C u st o m er R eq u ir em en ts (V o ic e o f th e C u st o m er ) P ri o ri ti ze d C u st o m er R eq u ir em en ts
R e l a t i o n s h i p b e t w e e n R e q u i r e m e n t s a n d D e s c r i p t o r s
2.1 THE VOICE OF THE CUSTOMERS
The initial steps in forming the House of Quality is determining, clarifying, identifying, and specifying the needs of the customers. These steps provide foundation for a defined venture and will ensure a process or a project vision prior to any further development. For example; for a SRRM the following customer needs are identified. The following questioner is prepared. Sample format is given below for the SRRMs (Appendix -1).
2.1.1 Clarifying Customer Needs
Customers buy benefits and producers offer features. This seems like a relatively simple notion, however, unless customers and producers are perfectly in tune with one another, it may be very difficult to anticipate these features, or each underlying benefit from each producer. It is of total importance to translate the needs of each and every customer into some tangible values that can be turned into engineering specifications (Berglund, 1993),. ( Nichols, Flanagan, ( 1994). The remaining steps are: Specifying the Customer Needs, technical requirements, interrelationship Matrix
3. QFD : an investigative approach in practice- Case study in SRRMs
EXAMPLE – The product development of steel rolling Mills- Different producers are adopting different techniques for the productions of steel bars for the concrete reinforcement. Since consumers are concerned about their requirements. Say customer’s voice, their voice has to be identified and prioritize by using QFD
To assess the status in the practical arena, a questionnaire as shown in the Appendix 1 was developed with the discussions with top executives of the steel rolling mills and expert Civil and Mechanical engineers who are well experienced in the fields of constructions and designs. The questions were based on the quality functions of SRRMs and their products. Comprising of 15 questions, a survey was conducted for 5 major SRRMs in and around of Kerala state and Tamilnadu state. With the questionnaire, we visited five companies and discussed about the questions and finalized the questionnaire. Then a survey was conducted comprising 5 companies.
Since the companies were reluctant to disclose their identity, we refer them as Company a, Company B and so on. The survey was conducted from among the major construction’s engineers of top level management we were able to get a clear about the qualities and performances of the SRRMs products. They were also reluctant in disclosing their identity. We were able to collect survey for more than seven companies. But we select only five of them and seven samples of each company were taken for the assessment of QFD. ( Bossert, 1991,Farrell, 1998))
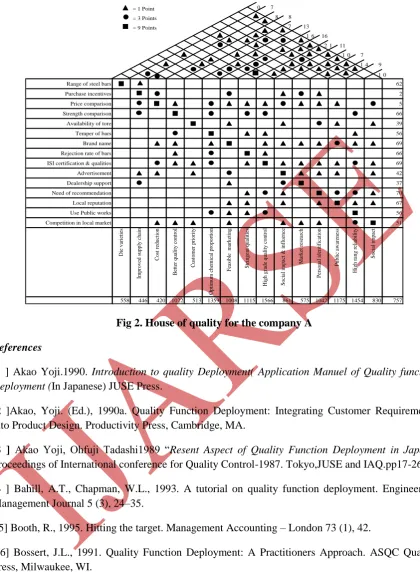
3.1 House of Quality Matrix in SRRMs
compared to similar products from competing companies. Below the central matrix, there is one row for a rating of organizational difficulty of each product requirement or ranging of technical language. Below that row are the technical details of each product requirement, compared to those of competitors. The steps for the preparation of house of quality and the calculation and conclusions are given below.
Identify a product. Choose a product (Steel bars from SRRMs) on which to focus the House of Quality Matrix.
Choose a template. It is best to use a template for this diagram because of its complexity. Smart Draw offers a House of Quality Matrix template that is quick and easy to use.
Obtain customer opinion. Whether through surveys, ( APPENDIX-1) opinion polls, or interviews, it is crucial to gather customer opinion of the product. It is important to know what they expect or want from your product and how important each aspect is to them.
Fill in the required information. The section on the far left of the matrix is reserved for customer and product requirements. On the far right should be what the competition provides. Along the top should be a list of the product's capabilities meant to fulfil customer needs. In the bottom section should be the targets the company must acquire for the product, long term goals, and the product's standing amongst the competition. Begin by filling in the titles of each row and column.
Fill out the matrix. The middle section is used to show how much your product is meeting the needs of your customer. Choose three symbols to indicate that an aspect of the product meets the customer's requirement strongly, moderately, or weakly. Use them to fill out the middle section. For the roof section, use a plus to show a positive correlation and a minus to show a negative correlation between two product requirements. Use numbers one through five for the right and bottom sections, with one being low or easy and five being high or difficult.
Create a key and draw conclusions. Create a key that tells what each of the symbols stand for. The Smart Draw template already has symbols and a legend. Use your matrix to determine the aspects of the product that should be improved in a cost-effective manner. Use it to set goals and plan for the future. Separate chart is prepared for each company and the survey results were entered. The questionnaire contains the question regarding the range of steel bars and its strength, purchase incentive, price comparison, availability in the market, brand name etc. The company A obtained different ratings and it is substituted in the matrix. A relationship matrix is prepared by rating the points 9 for the most important ones and points 3 and 1 for the next two ratings. Then the ranking sum of the customer language is multiplied with relationship matrix. To this co relationship matrix value is added and Rating of 3, 1 and 0 is given for the technical language for each question. Its sum has taken for the correlation matrix for each question.(Chan et al, 1998)
4. Results
5. Conclusion
The House of Quality functions as a living document and a source of ready reference for related products and future upgrades. While it is a great communication tool at each step in the process, the matrices are the means and not the end. Figure 2 gives the completed HOQ for company A. Through customer needs and competitive analysis, the House of Quality helps to identify the critical technical components that require change. Issues are addressed that may never have surfaced before. These critical issues are then driven through the other matrices to identify the critical parts, manufacturing operations, and quality control measures needed to produce a product that fulfils both customer needs and producer needs within a shorter development cycle time. The net effect of all of this is that the items that drive the company’s actions are driven by the customer’s requirements. There is an increased focus on the customer and an increased awareness of their wants. Because of this focus, the process leads to improved customer understanding and the ultimate outcome – a satisfied customer.( Nichols, Flanagan, 1994)
It has observed that in QFD specifically, the house of quality is an effective management tool in which customer expectations are used to drive the design process (figure2) . From the data received from the questionnaire for the above said companies, some of the facts such as advantages and benefits of implementing QFD are found to be
1. An orderly way in obtaining information and presentation.
2. An environment of teamwork.
3. Consensus decisions.
4. Considerably reduced start-up costs.
5. Fewer engineering changes.
6. Preserves everything in writing.
7. Reduced chances of oversight during design process and shorter product development cycle
QFD forces the entire organization to constantly be aware of the customer requirements. Every QFD chart is a result of the original customer requirements which are not lost through misinterpretation or lack of communication. Marketing benefits because specific sales points that have been identified by the customer can be stressed. Most importantly, implementing QFD results in a satisfied customer.
APPENDIX -1
Sample questioner Data
Here with I am submitting 15 questioners. Kindly rate your priority ( 0 to 10) that you would like
to give for the steel bars. I understand that you are one of the customers of the company(…………..
TMT) This data may be kept secret and will be used only for my research
work.( Your identity revealing is optional.)
0 1 2 3 4 5 6 7 8 9 10
Low Mean High
2 ) Purchase incentives for the steel bars from the above company
0 1 2 3 4 5 6 7 8 9 10
No Mean High
3) The price when comparing with other steel bars
0 1 2 3 4 5 6 7 8 9 10
Low Average High
4) The strength when comparing with other steel bars
0 1 2 3 4 5 6 7 8 9 10
Poor Average Good
5) The availability of the tore near to your site
0 1 2 3 4 5 6 7 8 9 10
Scars Average Good
6) The temper of the bars from the same brand
0 1 2 3 4 5 6 7 8 9 10
Poor Average Good
7) The brand name of the steel rolling mill
0 1 2 3 4 5 6 7 8 9 10
Poor Average Good
8) Rejection rate of the tore
0 1 2 3 4 5 6 7 8 9 10
high Average Less
9) ISI certification and other quality of the tore
No Average Good 10) Advertisement of the rolling mill
0 1 2 3 4 5 6 7 8 9 10
No Average Good
11) Dealership support of the company
0 1 2 3 4 5 6 7 8 9 10
Poor Average Good 12) Your recommendation of this brand to others
0 1 2 3 4 5 6 7 8 9 10
No Average Good
13) The company’s reputation in your locality
0 1 2 3 4 5 6 7 8 9 10
No Average Good
14) Use of this brand for the public constructions in your locality
0 1 2 3 4 5 6 7 8 9 10
No Average Good
15) Competition in the local market
0 1 2 3 4 5 6 7 8 9 10
No Average Good
Prepared by ---
Addresses and e-mail id with phone No Name & Address of respondent (Not compulsory)
0 7 8 8
7 13 1 6 16
2 1 11 1 0 7
1 4 9 1 0
Range of steel bars 62
Purchase incentives 2
Price comparison 5
Strength comparison 66
Availability of tore 39
Temper of bars 56
Brand name 69
Rejection rate of bars 66
ISI certification & qualities 69
Advertisement 42
Dealership support 37
Need of recommendation 70
Local reputation 67
Use Public works 56
Competition in local market 51
Die v ar ieties Im p ro v ed s u p p ly ch ain C o st r ed u ctio n B etter q u ality co n tr o l C u sto m er p rio rity Op tim u m ch em ical p ro p o rtio n Feasib le m ar k etin g Strin g en t q u alities Hig h g rad e q u ality co n tr o l So cial im p ac t & in flu en ce Ma rk et resear ch Per so n al id en tific atio n Pu b lic awa ren ess Hig h r an g r eliab ilit y So cial im p ac t
558 446 420 1022 513 1359 1008 1115 1566 861 575 1042 1175 1454 830 757 = 1 Point
= 3 Points = 9 Points
Fig 2. House of quality for the company A
References
[1 ] Akao Yoji.1990. Introduction to quality Deployment( Application Manuel of Quality function
Deployment (In Japanese) JUSE Press.
[2 ]Akao, Yoji. (Ed.), 1990a. Quality Function Deployment: Integrating Customer Requirements into Product Design. Productivity Press, Cambridge, MA.
[3 ] Akao Yoji, Ohfuji Tadashi1989 “Resent Aspect of Quality Function Deployment in Japan”
Proceedings of International conference for Quality Control-1987. Tokyo,JUSE and IAQ.pp17-26
[4 ] Bahill, A.T., Chapman, W.L., 1993. A tutorial on quality function deployment. Engineering Management Journal 5 (3), 24–35.
[ 5] Booth, R., 1995. Hitting the target. Management Accounting – London 73 (1), 42.
[ 6] Bossert, J.L., 1991. Quality Function Deployment: A Practitioners Approach. ASQC Quality Press, Milwaukee, WI.
[ 7] Bosserman, S,( 1992). Quality Function Deployment: The Competitive Advantage. Private Trunked Systems Division, Motorola
[9 ] Clausing, D., Pugh, S., 1991. Enhanced quality function deployment. In: Proceedings of the Design and Productivity International Conference, February 6–8, Honolulu,
[10] Degarmo, E. Paul; Black, J T.; Kohser, Ronald A. (2003), Materials and Processes in
Manufacturing (9th ed.), Wiley, p. 388, ISBN0-471-65653-4
[11]Energy efficiency in steel rolling mills(2004-2012) /UNDP/ www.undp.org/india.
[11] Farrell Jr., R., 1994. Quality function deployment: Helping business identify and integrate the voice of the customer. Industrial Engineering 26 (10), 44–45.
[12 ] Franceschini, F., Rossetto, S., 1998. Quality function deployment: How to improve its use. Total Quality Management 9 (6), 491–500.
[13]Jacob P. George & Pramod V.R:Mapping of steel rolling Mills – Journal of Palghat Management Assosiation;2013
[22 ] Joseph P. Ficalora, Louis Cohen Quality Function Deployment and Six Sigma, : A QFD Handbook, 2nd Edition, 2012 by Prentice Hall. ISBN-10: 0-13-336443-7
[14 ] Ministry of steel. Government of India. An over view of steel sector; domestic scenario,23/7/2012
[15] Nichols, K., Flanagan, D., 1994. Customer-driven designs through QFD. World Class Design to Manufacture 1 (6), 12–19.
[16] Pheng, L.S., Yeap, L., 2001. Quality function deployment in design/build projects. Journal of Architectural Engineering 7 (2), 30–39.