a
e-mail : [email protected]
Study of the effect of speed and load on wear mechanism of
a plan/plan contact with the help of a strain gage
dynamometer
S. Larbi1, A. Bilek2,a, and A. Meghlat3
1 Laboratoire L.M.S.E - U.M.M.T.O BP 17 RP Hasnaoua II Tizi-Ouzou 15000, Algérie 2,3 Laboratoire L.E.M.M - U.M.M.T.O BP 17 RP Hasnaoua II Tizi-Ouzou 15000, Algérie
Abstract. In this paper we show a contribution to the study of the complex phenomenon of wear through the results obtained by rubbing together PTFE and steal. The wear system designed (pin on a disc) is equipped with strain gages that allow to measure simultaneously the normal and the tangential forces. Different tests have been used to validate the apparatus. The effect of various parameters such as the speed and the load has been investigated. The results obtained for the evolution of the coefficient of friction versus load and speed are in good agreement with the literature.
1 Introduction
For mechanical moving parts failures initiate generally at the contact surfaces. The quality of the design depends, therefore, on the tribological behaviour of the materials, the efficiency of the surface coatings and the lubricants [1]. Various tribosystems have been designed in order to tackle this kind of mechanical problem [2-7]. The conception of a tribosystem requires informations from tribological data bases such as Tribex, Tribodata or Tribocollect, to evaluate the tribosystem and the materials to be analysed [8]. The Informations contained on these data bases are the results of different works and analysis of various tribosystems such as continuous sliding, alternative sliding (fretting) with variable amplitude, dry rolling with sliding and lubricated rolling.
Our main interest is a contribution to the design of a tribosystem and its use to study wear of materials. This work is based on norms adopted by the tribological conventionsDIN EN 50321 and DIN EN 50324for the representative parameters of a test [8].
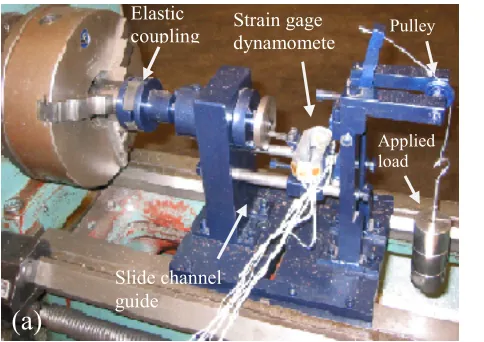
The tribometer designed is equipped with a strain gage dynamometer (figure 1) that allows to measure simultaneously and independently the normal and the tangential forces during the rubbing process. In order to validate the designed apparatus, several tests were conducted with PTFE on steel (XC48) at different speed and load values.
2 Experimental set up
The experimental set up (figure 1a) is designed to measure, during rubbing, the normal and the tangential forces with the help of a strain gage dynamometer. Two sets of strain gages connected in two temperature compensated bridges are mounted on the dynamometer (figure 1b) in such a way as © Owned by the authors, published by EDP Sciences, 2010
to measure continuously these forces with the help of a data acquisition system. The use of four strain active gages for each bridge increases the sensitivity of the instrument four times. This design has been applied successfully in many research investigations. This allows us to obtain the variation of the coefficient of friction versus time as a ratio of the recorded tangential and normal forces.
The apparatus, manufactured in our laboratory, was mounted on the slide channel of a lathe. The rotating movement is transmitted to the disc via an elastic coupling. Thanks to a pulley and a slide channel guide, the load is applied continuously during the rubbing process between the pin and the rotating disc.
Fig. 1. Experimental set up.
All specimens were obtained with the same cutting conditions on a lathe and a milling machine. Before each test the pin specimen (36 mm² cross section and 13 mm length) and the steel disc (55mm diameter) were polished with abrasive paper and cleaned with acetone.
The initial conditions of the rubbing surfaces of the specimen pin and the steel disc were then measured with a Multytoyo profilometer, (Ra= 0.3 - 0.4) and (Ra = 1.5 – 1.8) respectively. Before mounting the specimens on the apparatus, they are cleaned again with acetone and dried.
To measure the weight loss, the specimens were weighted with a digital balance (precision 10-4g) before and after each test. Four different loads (8N, 18N, 28N and 38N) have been used which correspond respectively to the apparent contact stresses (p=0.22MPa, 0.5 MPa, 0.77 MPa and 1.05MPa) between the pin and the disc. Three different speeds (V1=0.08m/s, V2=0.32m/s and V3=0.63m/s) were set for each of these contact stresses. Tests were repeated three times for each set condition of speed and load.
The micro hardness of the specimens obtained on a zwick micro hardness tester was as follows: - For the disc made of steel (XC48): 184HV 0.1 (applied load during the test: 100gr) - For the pin made of PTFE: 9HK 0.025 (applied load during the test: 25g)
3 Experimental results and discussions
The coefficient of friction is obtained as a ratio of the tangential and the normal forces recorded during rubbing. Tests were carried out at room temperature. Figure 2 shows the evolution of the normal force, the tangential force and the coefficient of friction versus time for polytetrafluorethylene (PTFE) on steel at a sliding speed V=063m/s with a normal load F= 8 N. These graphs show some oscillations with different amplitudes and frequencies; this kind of
Strain gage dynamomete r
Elastic
coupling Pulley
Slide channel guide
Applied load
Strain gages Rotating Disc
Pin
Wires connected to recorder
(a)
of the rubbing surfaces. Various studies have shown that the nature of the structure could alter the values of friction and wear [6]. Friction can generate some vibration in the contact zone that can cause the load to fluctuate.
Fig. 2. Coefficient of friction of PTFE versus time
Figure 3 shows the effect of the sliding speed and load on the evolution of the coefficient of friction. Since the evolution are similare to most of the tests, we report only the graphs for two loads (28 N and 38 N). We can see that after the runing in period, during which the two surfaces accommodate, the values of the coefficient of friction remain relatively constant.
Fig. 3. Coefficient of friction versus time for different speeds and load values
It is well known that the study of wear and rubbing generate dispersion of results because of its instable tribological behavior. Furthermore the design and the stiffness of the tribometer used can
Fig. 3. Coefficient of friction versus time for different speeds
Pin : PTFE V=0.08m/s
Disc :XC48 F=28N
Pin : PTFE V=0.08m/s Disc :XC48 F=38N
Pin : PTFE V=0.32m/s Disc :XC48 F=28N
Pin : PTFE V=0.32m/s Disc :XC48 F=38N
Pin : PTFE V=0.63m/s
Disc :XC48 F=28N Pin : PTFE V=0.63m/s
Disc :XC48 F=38N Time (s)
Time (s)
Time (s) Time (s)
The values of the coefficient of friction were obtained from the graphs after a running time of 2000s. As expected, we can see that for the same applied load i.e for the same apparent contact pressure, the coefficient of friction increases with the increase of the sliding speed (figure 4).
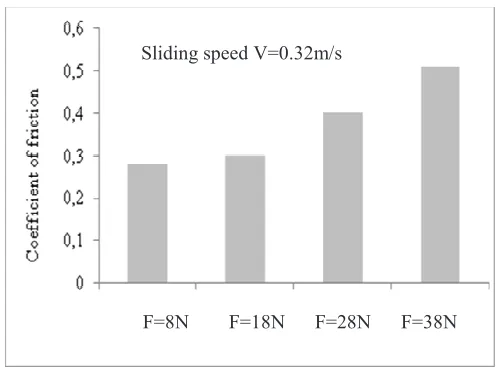
For a same sliding speed, the friction coefficient of PTFE on steel increases with the increase of the applied load (figure 5). These results are in good agreement with results reported by other authors (9).
Fig. 4. Coefficient of friction for different speed values
Fig. 5. Coefficient of friction for different loads Sliding speed V=0.32m/s
To show the effect of load on the weight loss, different tests have been conducted for a speed of 0.32 m/s. For a same load the weight loss was measured every half an hour i.e for a sliding distance of 0.576 km. We have therefore seven measuring points for each test (figure 6). We can see approximatively a linear behaviour of the weight loss versus the sliding distance for the two loads. As we might expect, the weight loss is higher when the load increased from 18N to 28N.
0 50 100 150 200 250 300 350
-0,5 0,5 1,5 2,5 3,5 4,5
F=18 N F=28 N
Fig. 6. Weight loss versus the sliding distance
Figure 7 shows optical microscope pictures (x200) of the worn surfaces of PTFE under dry sliding at two different normal loads. In all the tests we have observed that the worn track of PTFE pin were parallel to the sliding direction and they do not present any plucked or ploughed marks or adhesion which suggests that the wear mechanism is abrasion.
Fig.7. Wear track of PTFE on steel with V= 0.32m/s (a: Load = 8 N; b: Load =18N)
W
ei
g
h
t
lo
ss
g
1
0
-4
Sliding distance (Km)
(a)
Direction of
rubbing (b)
3 Conclusion
In this work we have designed an experimental apparatus equipped with a strain gage dynamometer in order to record the tangential and the normal forces during the rubbing process. PTFE against steel was chosen to study the effect of different parameters such as speed and load on wear mechanism.
The coefficient of friction has been recorded with three different speeds. Four different loads were set for each speed corresponding to four different apparent contact stresses. The results have shown that the coefficient of friction increases as the sliding speed increases. The coefficient of friction also increases with the increase of the applied load. The weight loss increases with sliding distance and load. This first work was actually done to validate the design of the tribometer. Other tests are scheduled on the apparatus in order to have a better understanding of the wear process under dry and lubricated conditions for composite materials.
References
1. G.Zambelli, L. Vincent, Matériaux et contacts-une approche tribologique,
PUR (1998),Suisse.
2. J.Paulo Davim; R. Cordoso, Effect of the reinforcement (carbon or glass fibers on friction andwear behaviour of PEEK against steel surface at long dry sliding
, Wear
266, (2009) pp 795-799.3. L. Lei, L.Weiwei, T.Yiping, S.Ben, H. Webin, Friction and wear properties of short carbon fiber reinforced aluminium matrix composites, Wear 266, (2009), pp 733-738. 4. LingWua b, Ji-xin Chena, Ming-yue Liua, Yi-wang Baoa, Yan-chun Zhoua, Reciprocating
friction and wear behavior of Ti3AlC2 and Ti3AlC2/Al2O3 composites against AISI52100 bearing steel, Wear 266 (2009) pp 158 -166.
5. G. Pillon , A. Han & Bernard Vannes, Conception d'un tribomètre pour l'étude des phénomènes de collage,16ème Congrès Français de Mécanique Nice, 1-5 septembre (2003). 6. M. Camara, F. Robbe-Valloire, R. Gras, Y. M. Chen; Mise au point d’un tribomètre spécifique
pour étudier l’influence de la dynamique de chargement sur le comportement tribologique du contact, Tribologie et couplages multiphasiques, JIFT (2006) PPUR pp 65-74.
7. Chunxia Li, Fengyan Yan, A comparative investigation of the wear behavior of PTFE and PI under dry sliding and simulated sand dust conditions, Wear 266 (2009) 632-638.
8. M.Woydt, M.Woydt, Application des données tribologiques des matériau, Techniques de l’ingénieur,
BM 7 006, pp 1-12.
9. H. Meng & al, Friction and wear behaviour of nanotubes reinforced polyamide composites under dry sliding and water lubricated condition, Journal of composite science and technology
69 (2009) pp 606-611.