ClinicoEconomics and Outcomes Research
Dovepress
open access to scientific and medical researchO R I G I N A L R E S E A R C H
Open Access Full Text Article
Analysis of utilization patterns and associated
costs of the breast imaging and diagnostic
procedures after screening mammography
Anna Vlahiotis1
Brian Griffin2
A Thomas Stavros3
Jay Margolis1
1Value Based Care, Outcomes
Research, Truven Health Analytics, an IBM Company, Bethesda, MD USA; 2Value Based Care, Outcomes
Research, Truven Health Analytics, an IBM Company, Newark, NJ, USA;
3Seno Medical Instruments, Inc., San
Antonio, TX, USA
Background: Little data exist on real-world patterns and associated costs of downstream breast diagnostic procedures following an abnormal screening mammography or clinical exam.
Objectives: To analyze the utilization patterns in real-world clinical settings for breast imag-ing and diagnostic procedures, includimag-ing the frequency and volume of patients and procedures, procedure sequencing, and associated health care expenditures.
Materials and methods: Using medical claims from 2011 to 2015 MarketScan Commercial and Medicare Databases, adult females with breast imaging/diagnostic procedures (diagnostic mammography, ultrasound, molecular breast imaging, tomosynthesis, magnetic resonance imaging, or biopsy) other than screening mammography were selected. Continuous health plan coverage without breast diagnostic procedures was required for ≥13 months before the first found breast diagnostic procedure (index event), with a 13-month post-index follow-up period. Key outcomes included diagnostic procedure volumes, sequences, and payments. Results reported descriptively were projected to provide US national patient and procedure volumes.
Results: The final sample of 875,526 patients was nationally projected to 12,394,432 patients annually receiving 8,732,909 diagnostic mammograms (53.3% of patients), 6,987,399 breast ultra-sounds (42.4% of patients), and 1,585,856 biopsies (10.3% of patients). Following initial diagnostic procedures, 49.4% had second procedures, 20.1% followed with third procedures, and 10.0% had a fourth procedure. Mean (SD) costs for diagnostic mammograms of US$349 ($493), ultrasounds US$132 ($134), and biopsies US$1,938 ($2,343) contributed US$3.05 billion, US$0.92 billion, and US$3.07 billion, respectively, to annual diagnostic breast expenditures estimated at US$7.91 billion.
Conclusion: The volume and expense of additional breast diagnostic testing, estimated at US$7.91 billion annually, underscores the need for technological improvements in the breast diagnostic landscape.
Keywords: breast cancer, mammography, imaging, diagnosis, health care utilization, expenditures
Summary
This study, using health care claims data from 2011 to 2015, estimated that follow-on breast diagnostic procedures in the US amounted to an annual expenditure of $7.91 billion (USD), annually affecting 12,394,432 patients who received 8,732,909 diagnostic mam-mograms, 6,987,399 breast ultrasounds, and 1,585,856 biopsies, underscoring the need for diagnostic modalities providing better specificity and greater diagnostic confidence that can lower the health care expenditures and shorten the patient’s diagnostic journey.
Background and objectives
Breast cancer is the most common malignancy among women worldwide and the second leading cause of cancer-related deaths in females,with an estimated 292,130 Correspondence: Anna Vlahiotis
Truven Health Analytics, an IBM Company, 7700 Old Georgetown Road, 6th Floor, Bethesda, MD 20814, USA Tel +1 314 307 5306
Email [email protected]
Journal name: ClinicoEconomics and Outcomes Research Article Designation: ORIGINAL RESEARCH
Year: 2018 Volume: 10
Running head verso: Vlahiotis et al
Running head recto: Breast imaging & diagnostic procedures after screening mammography DOI: http://dx.doi.org/10.2147/CEOR.S150260
ClinicoEconomics and Outcomes Research downloaded from https://www.dovepress.com/ by 118.70.13.36 on 21-Aug-2020
For personal use only.
Dovepress
Vlahiotis et al
new cases diagnosed in the US in 2015.1–3 Survival rates have increased steadily over recent decades as earlier detection enables treatment at earlier stages when treatment is more effective and less costly.4–6 While evidence-based guidelines for breast cancer screening issued by several organizations in the US, including the American Cancer Society, National Comprehensive Cancer Network, US Preventive Services Task Force, American College of Radiology, and the Society for Breast Imaging, may differ on the timing (annually, bien-nially) and ages for screening (to begin at age 40 or 50 years, screening after age 74 years),7–13 controversy remains in balancing breast cancer screening costs with rates of detec-tion, rates of false-positives or overdiagnoses, and reduction in mortality.14–16
Studies have estimated that 5% to over 20% of patients are subsequently recalled for follow-up procedures following their initial screening.17–20 Around 10% of abnormal screen-ing mammograms (<1% of those screened) are subsequently diagnosed as breast cancers.19,21 Patient recall extends the diagnostic journey through a series of one or more additional breast imaging and diagnostic procedures based on recom-mendations of the radiologist and guided by the American College of Radiology’s Breast Imaging Reporting and Data System (BI-RADS), categorizing breast lesions on a scale of 0–6, before definitive diagnosis or no further need for addi-tional imaging can be determined. The diagnostic imaging journey has evolved in recent years to increase the sensitiv-ity of breast cancer imaging, which may include diagnostic mammography, tomosynthesis, ultrasonography (ultrasound), magnetic resonance imaging (MRI), or molecular breast imaging (MBI).22 Suspicious lesions (BI-RADS category 4 or 5) warranting a biopsy are found in ~10% of those having an additional diagnostic imaging procedure.12,13,23
Women receiving a positive result from an abnormal screening mammogram not subsequently resulting in a breast cancer diagnosis are considered to have had a false-positive screening result, which adds potential psychological distress, additional health care visits, diagnostic tests, and associated costs. Despite improvements in technology, the rate of false-positive results remains high, estimated to occur in 13%–16% of recalls and as high as 61% of patients over a cumulative 10-year period.16,24 Biopsies were performed in 25%–29% of patients with false-positive screening mammograms, with cumulative 10-year biopsy exposure of 7%–9% of all screened patients.16,24
Published guidelines7–13 describe recommendations for the use and sequence of the available breast diagnostic pro-cedures; yet, there is little literature published on the actual
patterns of use seen in clinical practices and the costs of implementing these procedures. The objective of this study was to analyze the patterns of diagnostic breast imaging and diagnostic procedures used for patients recalled in real-world clinical settings (following screening mammography or other abnormal examination findings), including the frequency and volume of patients and procedures, the most common sequences in which procedures are performed, and the associ-ated health care expenditures.
Materials and methods
Data source
Administrative health care claims data from the Truven Health MarketScan® 2011–2015 Commercial and Medicare Supplemental Databases were used for this study, providing a nationally projectable large and diverse real-world patient sample. These databases contain the complete longitudinal records of inpatient and outpatient services for ~35 million commercially insured and over 3 million Medicare-eligible patients in each of the study years, covered under a variety of health plans, including dates of service, places of ser-vice, and all payments. All database records and data are statistically de-identified and fully compliant with the US patient confidentiality requirements set forth in Sections 164.514 (a)-(b)1ii of the Health Insurance Portability and Accountability Act. As this study used only de-identified patient records and did not involve the collection, use, or transmittal of individually identifiable data, Institutional Review Board approval to conduct this study was not necessary.
Patient selection
Adult (aged 18+ years) females who had at least one medical claim for a breast imaging or breast diagnostic procedure (diagnostic mammography, ultrasound, MBI, tomosynthesis, MRI, or biopsy) between January 1, 2012 and June 30, 2014 were selected. Coding for these procedures is provided in Table 1. The first found diagnostic procedure date was labeled the index date. At least 13 months of continuous health plan coverage was required before the index date (baseline period) and after the index date (follow-up period). The 13-month baseline and follow-up periods allow 1 year plus an additional 30 days for capturing follow-on services delayed beyond rec-ommended clinical guidelines (i.e., repeating procedures in 12 months) to enable reimbursement by payers. The complete study period spanned January 1, 2011 through July 31, 2015, which included 13-month baseline and follow-up periods surrounding the 2012–2014 patient selection window.
ClinicoEconomics and Outcomes Research downloaded from https://www.dovepress.com/ by 118.70.13.36 on 21-Aug-2020
Dovepress Breast imaging & diagnostic procedures after screening mammography
Patients who had one of the diagnostic breast imaging procedures (including biopsies) during the 13-month baseline period or who had breast surgery within 90 days of a breast cancer diagnosis (Table 1) during the baseline period were excluded.
Study measures
Baseline demographic variables included age, health plan type, primary payer (commercial or Medicare), urban/rural residence, and geographic location within the nine US Census Bureau divisions.25
Key outcomes reported during the follow-up period included diagnostic procedure volume (total procedure count and number of patients with a procedure) and health care payments per procedure. Biopsies were further stratified by imaging guidance type (ultrasound guided and guided by any other, which included stereotactic and MRI guidance) and specimen collection type (surgical, core, vacuum-assisted, and fine needle aspiration).
Another key outcome was analysis of sequences in which diagnostic procedures occurred across the study population, referred to as “real-world care paths”, reported as the number (and percentage) of patients with a particular procedure as their first procedure, the number who then progressed to a second particular procedure, and so on. Sequences were ana-lyzed as point prevalences, that is, the proportion of the study population receiving a particular procedure at different points
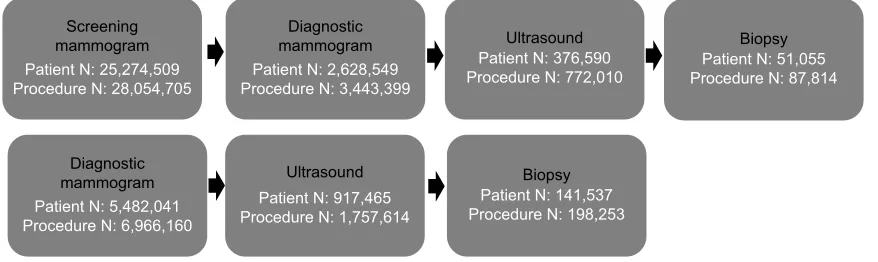
of diagnostic procedure progressions. Procedures occurring on the same day were arbitrarily prioritized in the following order: diagnostic mammogram, tomosynthesis, ultrasound, MBI, biopsy, MRI. The two most common real-world care paths are shown in Figure 1. It should be noted that screening mammography was not used as a patient selection criterion; however, subsequent analyses identified patients having a screening mammogram during the pre-index period.
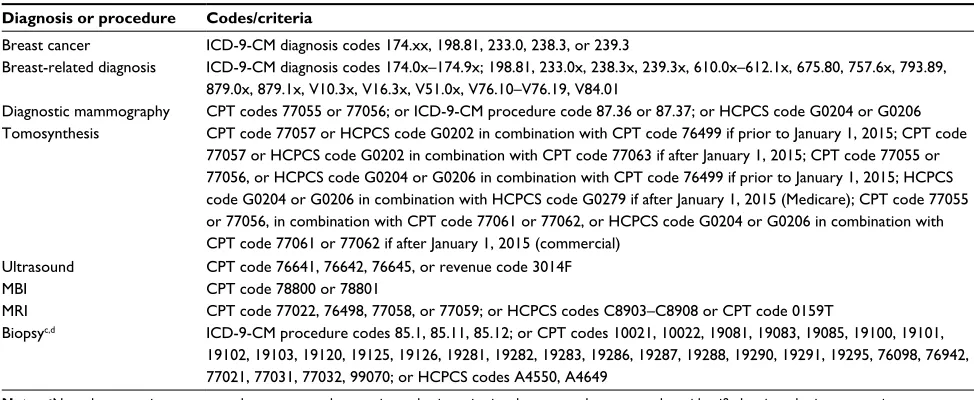
Health care payments were measured using the financial fields in medical claims incurred during the 13-month follow-up period, expressed in 2015 constant dollars, adjusted using the Medical Care component of the Consumer Price Index. Health care payments included the gross covered payments by all payers for all health care services or products including the group health plan’s payment, the Medicare-covered portion of payment (for Medicare-covered patients), deductibles, copay-ments, other plans’ or employers’ coordination-of-benefit payments, and any out-of-pocket patient expenses. Payments for services provided under capitated arrangements were imputed based on the average payments for non-capitated claims at the region, year, and procedure level within the MarketScan databases. Services ancillary to biopsy pro-cedures (anesthesia, pathology, and physician office visits) were also reported, defined as services provided within 3 days of a biopsy claim that included a breast-related diag-nosis (Table 1). Imaging (e.g., mammogram or ultrasound) performed following biopsy to confirm the placement of Table 1 Codes used to identify breast diagnoses and diagnostic proceduresa,b
Diagnosis or procedure Codes/criteria
Breast cancer ICD-9-CM diagnosis codes 174.xx, 198.81, 233.0, 238.3, or 239.3
Breast-related diagnosis ICD-9-CM diagnosis codes 174.0x–174.9x; 198.81, 233.0x, 238.3x, 239.3x, 610.0x–612.1x, 675.80, 757.6x, 793.89, 879.0x, 879.1x, V10.3x, V16.3x, V51.0x, V76.10–V76.19, V84.01
Diagnostic mammography CPT codes 77055 or 77056; or ICD-9-CM procedure code 87.36 or 87.37; or HCPCS code G0204 or G0206 Tomosynthesis CPT code 77057 or HCPCS code G0202 in combination with CPT code 76499 if prior to January 1, 2015; CPT code
77057 or HCPCS code G0202 in combination with CPT code 77063 if after January 1, 2015; CPT code 77055 or 77056, or HCPCS code G0204 or G0206 in combination with CPT code 76499 if prior to January 1, 2015; HCPCS code G0204 or G0206 in combination with HCPCS code G0279 if after January 1, 2015 (Medicare); CPT code 77055 or 77056, in combination with CPT code 77061 or 77062, or HCPCS code G0204 or G0206 in combination with CPT code 77061 or 77062 if after January 1, 2015 (commercial)
Ultrasound CPT code 76641, 76642, 76645, or revenue code 3014F
MBI CPT code 78800 or 78801
MRI CPT code 77022, 76498, 77058, or 77059; or HCPCS codes C8903–C8908 or CPT code 0159T
Biopsyc,d ICD-9-CM procedure codes 85.1, 85.11, 85.12; or CPT codes 10021, 10022, 19081, 19083, 19085, 19100, 19101,
19102, 19103, 19120, 19125, 19126, 19281, 19282, 19283, 19286, 19287, 19288, 19290, 19291, 19295, 76098, 76942, 77021, 77031, 77032, 99070; or HCPCS codes A4550, A4649
Notes:aNote that screening mammography was not used as a patient selection criterion; however, subsequent analyses identified patients having a screening mammogram
during the pre-index period, identified in claims using ICD-9-CM procedure codes V76.11, V76.12, V76.19, HCPCS code G0202, or CPT code 77057. bThis table shows the
coding used over the time period of this study. Note that numerous CPT codes and code definitions changed during this time. cBiopsy coding was for diagnostic breast biopsy
only, and did not include axillary biopsies or preoperative needle localization/seed/SAVI® localization. dBiopsy coding was used to identify surgical biopsy procedures as well
as ancillary procedures associated with the actual surgical biopsy.
Abbreviations: CPT, Common Procedural Terminology code; HCPCS, Healthcare Common Procedure Coding System code; ICD-9-CM, International Classification of Diseases, Ninth Revision, Clinical Modification, procedure code; MBI, molecular breast imaging; MRI, magnetic resonance imaging.
ClinicoEconomics and Outcomes Research downloaded from https://www.dovepress.com/ by 118.70.13.36 on 21-Aug-2020
Dovepress
Vlahiotis et al
the post-biopsy markers was not coded as biopsy related in claims data, and so was not included as a biopsy ancillary service. Some biopsy payments may have included ancillary services bundled as part of the biopsy claim.
US national projections
The frequency and volume of breast diagnostic procedures, and volumes of patients in real-world care paths, were pro-jected to derive US national patient and procedure volumes associated with breast diagnostic imaging by applying nation-ally projected figures from two Truven Health data sources, Outpatient View and Inpatient View, which provide utilization rates by calendar period, payer, age, gender, site, and proce-dure. The utilization rates were built directly from public and private claims streams, including national federal surveys. These rates were multiplied by their appropriate populations at the ZIP-code level to yield procedure volume estimates for the US total inpatient and outpatient market for all pro-cedures of interest. The projected populations and volumes are representative of the 2015 US adult female population and all insurance coverages, including commercial, Medicare, other government insurances, and uninsured.
All analyses were conducted using Statistical Analysis Software (SAS®) version 9.4 (SAS Institute Inc., Cary, NC, USA).
Results
The study selection criteria identified a final sample of 875,526 patients meeting all the criteria (Table 2). The study cohort’s mean age was 52.5 years with 69.9% of patients between 45 and 64 years old (only 0.8% of the sample was younger than 35 years of age). Most patients resided in urban areas (86.0%), and 90% had commercial insurance cover-age (Table 3). Patient counts, procedure frequencies, and
procedure volumes for this sample population were projected to the US national population.
Projecting these patients to the US population yielded a total of 12,394,432 female patients who had received at least one of the designated diagnostic breast procedures during the 13-month follow-up period (Tables 3 and 4). Projected patients more closely echoed the US distribution for payers (commercial 75.6%, Medicare eligible 20.6%) and geographic distribution. A total of 18,903,337 breast imaging and biopsy procedures were received by the nation-ally projected population during their 13-month follow-up period. The most commonly performed imaging procedure was diagnostic mammography, with 8,732,910 procedures performed in 6,603,297 patients (53.3% of patients) and 6,987,399 diagnostic ultrasound procedures performed in 5,253,354 patients (42.4% of patients). The newer breast imaging modalities were less commonly performed, with 5% or fewer patients experiencing tomosynthesis, MBI, or breast MRI, which may be expected considering access to devices or facility availability and insurance coverage policies relative to the years of our study data. An estimated 1,585,856 biopsies were performed in 1,277,844 patients (10.3% of patients) during the follow-up period. The most common approaches were ultrasound-guided core biopsies (1,007,417 biopsies [63.5%] in 949,118 patients [74.3%]) and ultrasound-guided localization of surgical biopsies (311,426 biopsies [19.6%] in 279,323 patients [21.9%]). Ultrasound guidance was used in 87% of biopsies (1,406,006 of 1,585,856 biopsies).
Sequences of procedures in the breast diagnostic care path were quite variable, as shown in Table 5. The most common first diagnostic procedures were diagnostic mammography for 88.0% of patients and ultrasound for 10.8%. Following the first procedure, 49.4% of patients proceeded to a second procedure, which was most often ultrasound (57.4%) or
Figure 1 Two most common breast imaging and diagnostic care paths, with projected annual US patient and procedure volumesa,b.
Notes:aPatient and procedure volumes only reflect those of the two most common care paths and do not equal the total volume for all procedure types. bThese are annual
patient and procedure volumes, projected to the US national population.
Biopsy
Patient N: 51,055 Procedure N: 87,814
Screening mammogram
Patient N: 25,274,509 Procedure N: 28,054,705
Diagnostic mammogram
Patient N: 5,482,041 Procedure N: 6,966,160
Ultrasound
Patient N: 917,465 Procedure N: 1,757,614
Biopsy
Patient N: 141,537 Procedure N: 198,253
Diagnostic mammogram
Patient N: 2,628,549 Procedure N: 3,443,399
Ultrasound
Patient N: 376,590 Procedure N: 772,010
ClinicoEconomics and Outcomes Research downloaded from https://www.dovepress.com/ by 118.70.13.36 on 21-Aug-2020
Dovepress Breast imaging & diagnostic procedures after screening mammography
diagnostic mammography (33.5%). Biopsy was performed for 6.3% of patients following their first diagnostic imaging procedure. Of the patients receiving a second procedure, 40.8% experienced a third round of diagnostic testing, most commonly diagnostic mammography (54.2%) or ultrasound (27.4%). Biopsy was performed for 13.8% of patients expe-riencing a third round of diagnostics. Half of the patients with three diagnostic procedures went to a fourth round of procedures (Table 5).
Paid amounts for breast diagnostic procedures for all patients are shown in Table 6. A further stratification of the paid amounts by payer (commercial or Medicare) may be found in Table S1. The least expensive procedure was ultrasound, with mean (SD) paid amount of $132 ($134) per procedure over all patients. The most common procedure, diagnostic mammograms, averaged $349 ($493). Biopsies were the most expensive procedures at an overall mean (SD) cost of $1,938 ($2,343), with ultrasound-guided localization of surgical biopsies being the most expensive image-guided specimen collection type at $1,909 ($2,199). Although less commonly performed (data not shown), MRI-guided biopsies were associated with higher mean (SD) payments ($1,804 [$1,689]) than ultrasound-guided core biopsy procedures ($1,032 [$1,200]). Ultrasound-guided fine needle aspiration biopsy procedures were the least expensive at $249 ($467) and were less commonly performed. Ancillary services for biopsy procedures combined for an average additional $3,120, including office visits at a mean (SD) expenditure of $735 ($891), pathology services $1,264 ($2,463), and anesthesia $1,120 ($1,146). (Authors’ note: Health care cost data have long been observed to exhibit substantial skewness
with long right-sided tails, commonly resulting in large SDs often approaching or exceeding the value of the mean.26)
Discussion
This study examined breast diagnostic procedure utilization occurring in real-world clinical practices across a large geo-graphically diverse population of women in the US during their first year of a diagnostic journey that may have included one or more of five available diagnostic breast imaging procedures and/or biopsy following either screening mam-mography or as a result of abnormal findings during clinical examination in the pre-index period. Data were extrapolated to the US population of women with commercial or Medicare coverage, with a resulting projected population of 12,394,432 affected individuals. The three most common components of the breast diagnostic care paths were diagnostic mammog-raphy, ultrasound, and biopsy. Using the mean paid amounts for each of these procedures (Table 6), the national expen-diture for 8,732,910 diagnostic mammograms, 6,987,399 ultrasounds, and 1,585,856 biopsies is estimated to cost $3.05 billion, $0.92 billion, and $3.07 billion, respectively, contributing with the other diagnostic procedures (tomo-synthesis, MBI, MRI) to an estimated annual expenditure of $7.91 billion.
Follow-up for patients with abnormal screening mam-mography results is critical.12 Routine clinical practice and associated guidelines call for further imaging studies prior to invasive biopsy procedures upon finding a suspicious screen-ing mammogram result.7,8,11 Our data confirm this practice, with diagnostic mammography performed for 88.0% of initial diagnostic workups. Following the first diagnostic procedure, Table 2 Attrition
Patient selection criteria n %
Patients in MarketScan® Commercial and Medicare Research Databases from January 1, 2011–July 31, 2015a 131,603,746
Female 67,754,615 100.0
Received a screening mammographyb 11,687,689 17.3
Received a breast imaging diagnostic procedure (diagnostic mammography, ultrasound, MBI, tomosynthesis, MRI, or biopsy)c
2,168,710 3.2
Continuous health plan coverage ≥13 months prior to the index dated 1,544,629 2.3
Aged ≥18 years at index 1,275,804 1.9
No inpatient or outpatient claims with a procedure code indicating any diagnostic breast imaging in the pre-index period (except screening mammography)
1,040,601 1.5
No inpatient or outpatient claims with a new breast cancer diagnosis at any time in the pre-index period 1,039,473 1.5
Patients with ≥13 months of continuous eligibility 875,526 1.3
Notes:aAll patients with health coverage in the MarketScan database, including patients who did NOT have any breast imaging procedures. bScreening mammography was
identified using ICD-9-CM procedure codes V76.11, V76.12, V76.19, HCPCS code G0202, or CPT code 77057. cPatients receiving breast imaging diagnostic procedures
were not required to have had a claim for screening mammography. dThe index date is the first medical claim date for any diagnostic mammography, ultrasound, MBI,
tomosynthesis, MRI, or biopsy performed.
Abbreviations: CPT, Common Procedural Terminology code; HCPCS, Healthcare Common Procedure Coding System code; ICD-9-CM, International Classification of Diseases, Ninth Revision, Clinical Modification, procedure code; MBI, molecular breast imaging; MRI, magnetic resonance imaging.
ClinicoEconomics and Outcomes Research downloaded from https://www.dovepress.com/ by 118.70.13.36 on 21-Aug-2020
Dovepress
Vlahiotis et al
around half of the patients proceed to a second imaging pro-cedure, most commonly ultrasound (57.4% of second line procedures) or diagnostic mammography (33.5%), or biopsy (6.3%). It is possible that some diagnostic mammograms may have been coded as screening mammograms, either mistakenly or to obviate insurance coverage issues, which may account for some patients (0.3%) with biopsy as a first diagnostic procedure.
Biopsy is the most expensive individual procedure and the costliest overall for health plans. This study found the
average price per biopsy of $1,938, which we feel is conser-vative, since this amount may not always include the mean paid amounts for follow-up office visits ($735), pathology ($1,264), or anesthesia ($1,120), unless separately billed.27 Our rate of 10.3% for breast biopsies following recall is in agreement with several other independent studies.12,13,19,23 The published rates of false-positive biopsies are high. A recent study of false-positive screening mammograms estimated that 24.9% of patients with false-positive screening procedures had received biopsies.16 A National Cancer Institute analysis Table 3 Demographic characteristics of patients
Patient characteristic Study cohort, N=875,526
Age (mean [SD]) 52.5 9.5
Age group, years (n, %)
18–34 6,584 0.8
35–44 189,845 21.7
45–54 325,154 37.1
55–64 276,735 31.6
65–74 56,443 6.4
75+ 20,765 2.4
Geographic region (n, %)
New England 47,963 5.5
Mid-Atlantic 152,677 17.4
East North Central 158,213 18.1
West North Central 34,427 3.9
South Atlantic 174,326 19.9
East South Central 74,700 8.5
West South Central 89,219 10.2
Mountain 38,970 4.5
Pacific 88,801 10.1
Unknown 16,230 1.9
Urban vs rural residence (n, %)
Urban residence 750,147 85.7
Rural residence 109,612 12.5
Unknown 15,767 1.8
Insurance plan type (n, %)
Comprehensive 43,286 4.9
HMO 6,756 0.8
POS 107,335 12.3
PPO 69,023 7.9
CDHP 517,235 59.1
Other 3,606 0.4
Primary payer (n, %)
Commercial 776,161 88.7
Medicare 78,620 9.0
Transitiona 20,745 2.4
Presence of capitation (n, %)
Non-capitated patients 816,933 93.3
Capitated patients 58,593 6.7
Index year (n, %)
2012 327,651 37.4
2013 319,969 36.5
2014 227,906 26.0
Note: aPatients who transitioned from commercial health insurance only to
Medicare-based coverage during the follow-up period.
Abbreviations: CDHP, consumer-driven health plan; HMO, health maintenance organization; POS, point of service; PPO, preferred provider organization.
Table 4 Patient and procedure volume in 13-month follow-up (projected)a
Procedure Counts %
Any diagnostic procedure
Number of patients (n, %) 12,394,432 100.0 Number of procedures performed (n) 18,903,337
Pre-index screening mammography (n, %) 10,543,647 85.1 Diagnostic mammography
Number of patients (n, %) 6,603,297 53.3
Number of procedures performed (n) 8,732,910 Tomosynthesis
Number of patients (n, %) 145,423 1.2
Number of procedures performed (n) 152,504 Ultrasound
Number of patients (n, %) 5,253,354 42.4
Number of procedures performed (n) 6,987,399 Molecular breast imaging
Number of patients (n, %) 13,796 0.1
Number of procedures performed (n) 14,251 Magnetic resonance imaging
Number of patients (n, %) 615,738 5.0
Number of procedures performed (n) 700,330 Biopsy
Number of patients (n, %) 1,277,844 10.3
Number of procedures performed (n) 1,585,856 Surgical biopsy
Ultrasound-guided localization
Number of patients (n, %) 279,323 2.3
Number of procedures performed (n) 311,426 Other surgical
Number of patients (n, %) 33,644 0.3
Number of procedures performed (n) 34,524 FNA biopsy
Ultrasound-guided FNA
Number of patients (n, %) 83,766 0.7
Number of procedures performed (n) 87,163 Other FNA
Number of patients (n, %) 25,027 0.2
Number of procedures performed (n) 26,103 Core biopsy
Ultrasound-guided core
Number of patients (n, %) 949,118 7.7
Number of procedures performed (n) 1,007,417
Note:aTable S2 provides reference figures for the 2015 US Census estimates of all
adult women and health care coverages.
Abbreviation: FNA, fine needle aspiration.
ClinicoEconomics and Outcomes Research downloaded from https://www.dovepress.com/ by 118.70.13.36 on 21-Aug-2020
Dovepress Breast imaging & diagnostic procedures after screening mammography
of Breast Cancer Surveillance Consortium (BCSC) data through 2009 reported a positive predictive value (the rate of positive cancer detection following biopsy, PPV3) for breast biopsy of 29.0%, implying a false-positive rate of 71.0%.20 An earlier study using BCSC data from 1996 to 2001 similarly found 26.9% of biopsies with invasive cancer and 6.3% with carcinoma in situ, thus 66.8% were noncancerous. Using the more recent BCSC estimate of false-positive biopsies puts the expenditure for false-positive biopsies at $2.18 billion,
a substantial cost assuming the estimated rate and cost of biopsies in our data.27
False-positives are a sensitive issue in the breast cancer diagnostic journey due to the impact on health care resources, expenditure, and psychosocial effects, with estimates ranging from 13.0% to 16.3% of initial recalls overall and as high as 61% of individual patients with screening mammogra-phies over a cumulative 10-year period.16,24 The estimated annual cost of false-positive mammograms in the US was Table 5 Diagnostic procedure sequencesa
All patients, %
Diagnostic mammography, %
Tomosynthesis, % Ultrasound, % MBI, % MRI, % Biopsy, %
First diagnostic procedure 100 88.0 0.1 10.8 0.04 0.8 0.3
Patients receiving a second procedure
49.4 50.4 22.9 42.5 14.6 39.6 31.9
Procedure received (second procedure)
33.5 1.2 57.4 0.0 1.6 6.3
First to second procedure detail
To diagnostic mammography 32.9 50.0 36.9 67.9 57.4 68.2
To tomosynthesis 1.3 2.7 0.0 1.9 0.1 0.0
To ultrasound 58.2 44.6 54.2 5.7 16.7 14.0
To molecular breast imaging 0.0 0.0 0.0 17.0 0.0 0.3
To magnetic resonance imaging 1.4 2.2 1.8 5.7 22.9 10.7
To biopsy 6.2 0.5 7.0 1.9 2.8 6.7
Patients with two procedures receiving a third procedure
40.8b 35.7 79.5 40.4 40.9 55.1 60.7
Procedure received (third procedure)
54.2 0.6 27.4 0.1 3.9 13.8
Second to third procedure detail
To diagnostic mammography 36.6 4.6 62.6 61.9 69.0 67.8
To tomosynthesis 2.0 0.0 0.0 0.0 0.0 0.0
To ultrasound 45.9 94.5 18.2 15.9 17.1 11.1
To molecular breast imaging 0.0 0.0 0.1 1.6 0.3 0.2
To magnetic resonance imaging 2.5 0.4 2.7 6.3 3.1 16.3
To biopsy 13.0 0.4 16.4 14.3 10.5 4.6
Patients with three procedures receiving any fourth procedure
49.6c 53.1 66.3 36.6 55.2 61.3 57.9
Procedure received (fourth procedure)
32.7 1.1 37.3 0.1 22.7 6.1
Third to fourth procedure detail
To diagnostic mammography 18.1 5.4 46.6 63.5 64.6 59.8
To tomosynthesis 1.8 0.0 0.1 0.0 0.0 0.0
To ultrasound 45.6 92.8 33.2 11.8 18.6 15.4
To molecular breast imaging 0.1 0.0 0.1 0.0 0.4 0.3
To magnetic resonance imaging 3.5 0.6 3.7 2.4 3.5 19.5
To biopsy 30.9 1.3 16.4 22.4 13.0 5.0
Notes:aHow to read Table 5: Example using diagnostic mammography. About 88% of all patients had diagnostic mammography as their first procedure. Of those with
diagnostic mammography as their first procedure, 50.4% had any second procedure. Of all patients with any second procedure, 33.5% had diagnostic mammography. Of the patients with diagnostic mammography as their first procedure, 32.9% had diagnostic mammography as their second procedure, 1.3% had tomosynthesis, 58.2%
had ultrasound, and so on. In the next section describing patients with two procedures receiving a third procedure, of all patients receiving diagnostic mammography as their second procedure, 35.7% had any third procedure. Of all patients with any third procedure, 54.2% had diagnostic mammography. Of the patients with diagnostic mammography as their second procedure, 36.6% had diagnostic mammography as their third procedure, 2.0% had tomosynthesis, 45.9% had ultrasound, and so on. This same logic applies to the next section (patients with three procedures receiving a fourth procedure). bAbout 40.8% of those patients receiving two procedures had a third
procedure. This may also be stated that 20.1% of all patients received a third procedure. cAbout 49.6% of those patients receiving three procedures received a fourth
procedure. This may also be stated that 10.0% of all patients received a fourth procedure.
Abbreviations: MBI, molecular breast imaging; MRI, magnetic resonance imaging.
ClinicoEconomics and Outcomes Research downloaded from https://www.dovepress.com/ by 118.70.13.36 on 21-Aug-2020
Dovepress
Vlahiotis et al
$2.8 billion.16 In this study, we did not determine whether there was a breast cancer diagnosis following any diagnostic procedure, so estimates of false-positives were derived from other published reports. The discrepancy between estimated volumes of post-screening mammogram procedures per-formed and reported cancer incidence rates in view of their positive predictive value suggests considerable unmet medical need for more sensitive and specific breast diagnostic tools.
Our data provide mean and median unit costs for each of the procedures and ancillary services, derived from a large nationally representative database composed of real-world medical claims across a wide range of providers, health plans, and patients in commercially insured and Medicare-covered populations. The unit costs we derived for breast cancer diag-nostic procedures may be of value for other researchers and managed care organizations to use in examining the costs of breast diagnostic services. Other studies to date have provided costs in aggregate, with or without including accompanying (ancillary) or follow-up services, and some only for specific payers such as Medicare.16,27,28 Costs for patients under the age of 65 years are a large portion of the overall national health care expenditure, especially considering the median age at diagnosis of 61 years and an estimated 57.7% of new cases occurring in patients aged 18–64 years.3,29 The costs presented in this paper provide a broad national average of
commercially insured expenditure rates. According to the US Centers for Disease Control and Prevention, 73.4% of women with health care coverage age 40–64 years received a mammogram within a 2-year window (2013 data).30 This is a large population to consider in view of the health care resource use and expenditure by health plans, and we believe our data are relevant to that population.
Breast cancer screening remains a controversial clinical, public health, and social issue. Data on the frequencies and costs of breast cancer diagnostic procedures are sparse, with many prior studies relying on Medicare records that pertain primarily to older segments of the affected populations and typically lower expenditure rates for procedures.28,31 The risks and high costs of these diagnostic procedures point to unmet medical need, especially for technological advance-ments and quality initiatives that could minimize unnecessary invasive procedures, reduce costs, and optimize patient care for women during their breast diagnostic journey.
Limitations
This study is subject to several limitations. Misclassification error is possible when relying on procedure and diagnosis coding from health care claims in the absence of patient charts or provider attestations, where the extent of data entry error, undercoding, or overcoding is unknown. Patients’ medical history was limited to health care claims during the reporting years in this study, such that comorbidities or other sociodemographic factors outside of this data were unknown. Coding of diagnostic radiologic procedures may be subject to data coding limitations as well as coding changes and revised code definitions that occurred during the time of the study. BI-RADS information is lacking in the MarketScan administrative claims data. Similarly, clinicians’ rationales for use of various diagnostic procedures and evidence of whether patients were symptomatic or asymptomatic are not found in claims data. The distinction between screening and diagnostic ultrasound procedures and criteria for dense breast tissue in distinguishing screening versus diagnostic ultrasounds are not available using standard reimbursement codes, and our ability to make this distinction using sequencing of events or other algorithms is limited. Unmeasurable characteristics of patients with different diagnostic pathways or progressions, such as the patient’s income level, proximity and availability of diagnostic services or specialists, family situation (e.g., support network, spouse, dependents), and other sociode-mographic factors, may account for the differences found in health care costs and utilization. Controlling for specific Table 6 Mean (SD) and median paid amounts for breast
diagnostic procedures in US dollars
Diagnostic imaging procedure Mean (SD) Median
Diagnostic mammography $349 ($492) $234
Tomosynthesis $134 ($102) $113
Ultrasound $132 ($134) $95
Molecular breast imaging $296 ($422) $135 Magnetic resonance imaging $1,197 ($1,054) $1,021
Biopsya $1,938 ($2,343) $1,211
Surgical biopsy
Ultrasound-guided localization $1,909 ($2,199) $1,245 Other surgical procedures $356 ($675) $193 FNA biopsy
Ultrasound-guided FNA $249 ($467) $153
Other FNA $217 ($286) $172
Core biopsy
Ultrasound-guided core $1,032 ($1,200) $694 Procedures ancillary to biopsy
Follow-up office visit $735 ($891) $451
Pathology $1,264 ($2,463) $501
Anesthesia $1,120 ($1,146) $776
Notes:aDue to billing code inconsistencies for differentiation of biopsy types,
some payments were not included when reporting by specific biopsy type, but were
included in the overall mean (SD) costs for all biopsies.
Abbreviation: FNA, fine needle aspiration.
ClinicoEconomics and Outcomes Research downloaded from https://www.dovepress.com/ by 118.70.13.36 on 21-Aug-2020
Dovepress Breast imaging & diagnostic procedures after screening mammography
comorbidities, overall comorbidity burden, or other clini-cal characteristics was beyond the scope of this study, but should be considered for future investigations. Similarly, we did not examine outcomes related to the end point of positive breast cancer diagnosis, another consideration for future research. This study was a convenience sample of individuals in the US with commercial health coverage or private Medicare supplemental coverage, and consequently, results of this analysis may not be generalizable to patients with other insurance, without health insurance coverage, or to international populations.
Conclusion and take-home points
The breast imaging care path is a critical component in diag-nosing breast cancer in the USA. An estimated 12,394,432 patients in the USA during the period 2012–2015 annually received 8,732,909 diagnostic mammograms, 6,987,399 breast ultrasounds, and 1,585,856 biopsies, contributing to annual expenditure of $7.91 billion for follow-on breast diagnostic procedures in the USA. Breast biopsy, with average payments of $1,938, not including ancillary services, has shown false-positive rates in the USA estimated at 71.0%, representing annual false-positive expenditures of $2.18 billion. An esti-mated 49.4% of all breast diagnostic patients were recalled for a second diagnostic procedure, 20.1% had three diagnostic procedures, and 10.0% had four diagnostic procedures, fur-ther underscoring the volume and expense of patient recalls to address conscientious clinicians’ uncertainty for positive diagnosis using the current arsenal of diagnostic procedures. Although the technologies have evolved, diagnostic modalities providing better specificity and greater diagnostic confidence can have great potential impact on lowering health care expen-ditures and shortening the patient’s diagnostic journey.
Acknowledgments
The authors gratefully acknowledge the key contributions of Douglas Weldon (Truven Health Analytics) for his work in defining, extracting, and assembling the data. This study was sponsored by Seno Medical Instruments, Inc., San Antonio, TX, USA.
Disclosure
Anna Vlahiotis, Brian Griffin, and Jay Margolis are employ-ees of Truven Health Analytics, an IBM company, which was paid by Seno Medical Instruments in connection with the development of this paper. Thomas Stavros is an employee of Seno Medical Instruments. The authors report no other conflicts of interest in this work.
References
1. DeSantis CE, Fedewa SA, Goding Sauer A, Kramer JL, Smith RA, Jemal A. Breast cancer statistics, 2015: convergence of incidence rates between black and white women. CA Cancer J Clin. 2016;66(1):31–42. 2. Centers for Disease Control and Prevention. Cancer among women.
Updated June 16, 2016. Available from: http://www.cdc.gov/cancer/ dcpc/data/women.htm. Accessed October 22, 2016.
3. SEER Cancer Stat Facts: Female Breast Cancer. National Cancer Insti-tute. Bethesda, MD. Available from: http://seer.cancer.gov/statfacts/ html/breast.html. Accessed January 23, 2017.
4. Berry DA, Cronin KA, Plevritis SK, et al. Effect of screening and adjuvant therapy on mortality from breast cancer. N Engl J Med. 2005; 353(17):1784–1792.
5. Nelson HD, Tyne K, Naik A, Bougatsos C, Chan BK, Humphrey L; U.S. Preventive Services Task Force. Screening for breast cancer: an update for the U.S. Preventive Services Task Force. Ann Intern Med. 2009;151(10):727–737, W237-42.
6. Blumen H, Fitch K, Polkus V. Comparison of treatment costs for breast cancer, by tumor stage and type of service. Am Health Drug Benefits. 2016;9(1):23–32.
7. Lee CH, Dershaw DD, Kopans D,et al. Breast cancer screening with imaging: recommendations from the society of breast imaging and the ACR on the use of mammography, breast MRI, breast ultrasound, and other technologies for the detection of clinically occult breast cancer.
J Am Coll Radiol. 2010;7(1):18–27.
8. Mainiero MB, Lourenco A, Mahoney MC, et al. ACR appropriateness criteria breast cancer screening. J Am Coll Radiol. 2016;13(11S): R45–R49.
9. Oeffinger KC, Fontham ET, Etzioni R, et al. Breast cancer screening for women at average risk: 2015 guideline update from the American Cancer Society. JAMA. 2015;314(15):1599–1614.
10. American Cancer Society. American Cancer Society Guidelines for the early detection of cancer. Available from: http://www.cancer.org/healthy/ findcancerearly/cancerscreeningguidelines/american-cancer-society-guidelines-for-the-early-detection-of-cancer. Accessed October 22, 2016. 11. National Comprehensive Cancer Network. NCCN Clinical Practice
Guideline in Oncology: Breast Cancer Screening and Diagnosis. Ver-sion 1.2016, 07/26/16. Available from: https://www.nccn.org/store/ login/login.aspx?ReturnURL=https://www.nccn.org/professionals/ physician_gls/pdf/breast-screening.pdf. Accessed January 23, 2017. 12. Siu AL; U.S. Preventive Services Task Force. Screening for breast
cancer: U.S. preventive services task force recommendation statement.
Ann Intern Med. 2016;164(4):279–296.
13. Nelson HD, Cantor A, Humphrey L, et al. MSUS Preventive Services Task Force. Evidence Summary: Screening for Breast Cancer. Effective-ness of Breast Cancer Screening: Systematic Review and Meta-Analysis to Update the 2009 U.S. Preventive Services Task Force
Recommen-dation. Available from: https://www.uspreventiveservicestaskforce.
org/Page/Document/evidence-summary-screening-for-breast-cancer/ breast-cancer-screening1. Accessed January 23, 2017.
14. National Committee for Quality Assurance. 2016 State of health care quality: Breast Cancer Screening. Available from: http://www.ncqa. org/report-cards/health-plans/state-of-health-care-quality/2016-table-of-contents/breast-cancer. Accessed January 23, 2017.
15. Bleyer A, Welch HG. Effect of three decades of screening mammog-raphy on the incidence of breast cancer. N Engl J Med. 2012;367(21): 1998–2005.
16. Ong MS, Mandl KD. National expenditure for false-positive mammo-grams and breast cancer overdiagnoses estimated at $4 billion a year.
Health Aff (Millwood). 2015;34(4):576–583.
17. Rabinovich K, Kaplan S, Carcano C, Nadjafi L, Salom I. Double reading of screening mammography: effect on reducing false positive rates. Presentation delivered May 16, 2016, at the American College of Radiology Annual Meeting (ACR 2016) in Washington, DC, USA. Available at https://www.acr.org/~/media/ACR/Documents/PDF/ Annual-Meeting/Abstracts/2016/16079/16079_Rabinovich.pdf?la=en. Accessed January 23, 2017.
ClinicoEconomics and Outcomes Research downloaded from https://www.dovepress.com/ by 118.70.13.36 on 21-Aug-2020
Dovepress
Vlahiotis et al
18. Grabler P, Sighoko D, Wang L, Allgood K, Ansell D. Recall and cancer detection rates for screening mammography: finding the sweet spot.
AJR Am J Roentgenol. 2017;208(1):208–213.
19. Barry M, Gemignani ML. Follow-Up for Women with Abnormal Mam-mograms. NEJM Journal Watch, Women’s Health, April 14, 2011. Avail-able from: http://www.jwatch.org/wh201104140000001/2011/04/14/ follow-women-with-abnormal-mammograms. Accessed January 23, 2017. 20. NCI-funded Breast Cancer Surveillance Consortium (HHSN261201-100031C). Downloaded from the Breast Cancer Surveillance Consortium Web site – http://breastscreening.cancer.gov/. http://www.bcsc-research. org/statistics/performance/. Accessed January 23, 2017.
21. Chae EY, Cha JH, Shin HJ, Choi WJ, Kim HH. Reassessment and follow-up results of BI-RADS Category 3 lesions detected on screen-ing breast ultrasound. AJR Am J Roentgenol. 2016;206(3):666–672. 22. Sia J, Moodie K, Bressel M, et al. A prospective study comparing digital
breast tomosynthesis with digital mammography in surveillance after breast cancer treatment. Eur J Cancer. 2016;61:122–127.
23. American College of Radiology. Breast Imaging Reporting and Data System® (BI-RADS®). Reston, VA: American College of Radiology.
1998.
24. Hubbard RA, Kerlikowske K, Flowers CI, Yankaskas BC, Zhu W, Miglioretti DL. Cumulative probability of false-positive recall or biopsy recommendation after 10 years of screening mammography: a cohort study. Ann Intern Med. 2011;155(8):481–492.
25. United States Census Bureau. Geographic Terms and Concepts – Census Divisions and Census Regions. Available from: https://www.census. gov/geo/reference/gtc/gtc_census_divreg.html. Accessed January 23, 2017.
26. Mihaylova B, Briggs A, O’Hagan A, Thompson SG. Review of statisti-cal methods for analysing healthcare resources and costs. Health Econ. 2011;20(8):897–916.
27. Gutwein LG, Ang DN, Liu H, et al. Utilization of minimally invasive breast biopsy for the evaluation of suspicious breast lesions. Am J Surg. 2011;202(2):127–132.
28. Gross CP, Long JB, Ross JS, et al. The cost of breast cancer screen-ing in the medicare population. JAMA Intern Med. 2013;173(3): 220–226.
29. Welch HG, Gorski DH, Albertsen PC. Trends in metastatic breast and prostate cancer-lessons in cancer dynamics. N Engl J Med. 2015;373(18): 1685–1687.
30. National Center for Health Statistics. Health, United States, 2015: With Special Feature on Racial and Ethnic Health Disparities. Table 70. Hyattsville, MD. 2016. Available from: https://www.cdc.gov/nchs/ data/hus/hus15.pdf#070. Accessed January 23, 2017.
31. Elmore JG, Gross CP. The cost of breast cancer screening in the United States: a picture is worth…a billion dollars? Ann Intern Med. 2014;160(3):203.
ClinicoEconomics and Outcomes Research downloaded from https://www.dovepress.com/ by 118.70.13.36 on 21-Aug-2020
Dovepress Breast imaging & diagnostic procedures after screening mammography
ClinicoEconomics and Outcomes Research
Publish your work in this journal
Submit your manuscript here: https://www.dovepress.com/clinicoeconomics-and-outcomes-research-journal
ClinicoEconomics and Outcomes Research is an international, peer-reviewed open-access journal focusing on health technology assess-ment, pharmacoeconomics and outcomes research in the areas of diagnosis, medical devices, and clinical, surgical and pharmacological intervention. The economic impact of health policy and health systems
organization also constitute important areas of coverage. The manu-script management system is completely online and includes a very quick and fair peer-review system, which is all easy to use. Visit http://www.dovepress.com/testimonials.php to read real quotes from published authors.
Dovepress
Supplementary materials
Table S1 Mean (SD) and median paid amounts for breast diagnostic procedures, all patients and by payer, in US dollars
All patients N=875,526
Commerciala
n=789,062
Medicareb
n=73,768
Transitionc
n=12,696
Mean (SD) Median Mean (SD) Median Mean (SD) Median Mean (SD) Median
Diagnostic mammography $349 ($492) $234 $354 ($490) $239 $297 ($518) $172 $347 ($477) $229
Tomosynthesis $134 ($102) $113 $136 ($102) $115 $110 ($102) $93 $115 ($88) $93
Ultrasound $132 ($134) $95 $137 ($135) $100 $76 ($109) $54 $112 ($120) $83
Molecular breast imaging $296 ($422) $135 $299 ($406) $133 $291 ($530) $190 $175 ($165) $77 Magnetic resonance imaging $1,197 ($1,054) $1,021 $1,228 ($1,054) $1,073 $875 ($1,005) $615 $1,130 ($984) $954 Biopsy $1,938 ($2,343) $1,211 $1,940 ($2,177) $1,246 $1,901 ($3,424) $918 $2,064 ($2,862) $1,154 Surgical biopsy
Ultrasound-guided localization $1,909 ($2,199) $1,245 $1,902 ($2,002) $1,276 $1,951 ($3,438) $971 $2,075 ($2,466) $1,105 Other surgical procedures $356 ($675) $193 $361 ($676) $203 $290 ($599) $155 $502 ($993) $236 FNA biopsy
Ultrasound-guided FNA $249 ($467) $153 $251 ($467) $154 $240 ($480) $146 $208 ($406) $118
Other FNA $217 ($286) $172 $220 ($298) $173 $193 ($135) $159 $173 ($82) $181
Core biopsy
Ultrasound-guided core $1,032 ($1,200) $694 $1,036 ($1,077) $712 $999 ($1,950) $578 $1,041 ($1,407) $695 Procedures ancillary to biopsy
Follow-up office visit $735 ($891) $451 $720 ($886) $432 $811 ($926) $570 $783 ($807) $516
Pathology $1,264 ($2,463) $501 $1,243 ($2,371) $502 $1,381 ($3,075) $471 $1,682 ($2,882) $660 Anesthesia $1,120 ($1,146) $776 $1,178 ($1,143) $843 $702 ($1,058) $356 $1,166 ($1,312) $793
Notes:aCommercial: data from active employees, early retirees, health care coverage under the Consolidated Omnibus Budget Reconciliation Act of 1985 continues, and
dependents insured by employer-sponsored plans (i.e., persons not eligible for Medicare). bMedicare/Medicare supplemental: data from individuals enrolled in Medicare who
also have group health insurance coverage paid for by a current or former employer. cTransition: data for patients who transitioned during the reporting period from having
only commercial insurance to then having Medicare plus a supplemental insurance paid for by their current or former employer.
Abbreviation: FNA, fine needle aspiration.
ClinicoEconomics and Outcomes Research downloaded from https://www.dovepress.com/ by 118.70.13.36 on 21-Aug-2020