University of South Carolina
Scholar Commons
Theses and Dissertations
2014
Executive Compensation in the Banking Industry
and Systemic Risk
SEUNGHO CHOI
University of South Carolina - Columbia
Follow this and additional works at:https://scholarcommons.sc.edu/etd
Part of theBusiness Administration, Management, and Operations Commons
This Open Access Thesis is brought to you by Scholar Commons. It has been accepted for inclusion in Theses and Dissertations by an authorized administrator of Scholar Commons. For more information, please [email protected].
Recommended Citation
CHOI, S.(2014).Executive Compensation in the Banking Industry and Systemic Risk.(Master's thesis). Retrieved from
E
XECUTIVEC
OMPENSATION IN THEB
ANKINGI
NDUSTRY ANDS
YSTEMICR
ISKby
Seungho Choi
Bachelor of Science Hanyang University, 2009
Master of Science University of Illinois, 2011
Submitted in Partial Fulfillment of the Requirements
For the Degree of Master of Science in
Business Administration
Darla Moore School of Business
University of South Carolina
2014
Accepted by:
Allen Berger, Director of Thesis
Shingo Goto, Reader
A
BSTRACTIn this paper, I investigate empirically whether executive compensation structure
contributes to the entire systemic risk among 92 firms that highly contribute to systemic
risk from 2000 to 2012. Based on Brownlees and Engle (2011) and Acharya, Pedersen,
Philippon, and Richardson (2010), I use SRISK and MES as systemic risk measures.
Firstly, I find that the ratio of stock options has a positively significant influence on
systemic risk. Also, I find weak evidence that the ratio of cash bonus in compensation
structure positively related to systemic risk. However, I find no significant evidence that
the ratio of stock grants has a negative relation with systemic risk. It might be caused by
the growth trend in non-traditional banking activities. Third, I find that TARP fund
induces a manager’s risk-seeking. This is because the interests of owners and managers
are aligned to take more risk for the purpose of maximizing their own wealth. Lastly, I
find that the positive relationship between stock-based compensation and systemic risk is
T
ABLE OFC
ONTENTSABSTRACT ... iii
LIST OF TABLES ...v
CHAPTER 1INTRODUCTION ...1
CHAPTER 2LITERATURE REVIEW ...10
2.1STOCK-BASED COMPENSATION ...10
2.2SYSTEMIC RISK ...13
CHAPTER 3HYPOTHESIS DEVELOPMENT ...17
CHAPTER 4DATA AND METHODOLOGY ...20
4.1DATA ...20
4.2DEPENDENT VARIABLES AND INDEPENDENT VARIABLES ...21
4.3CONTROL VARIABLES ...22
4.4MODELS ...22
CHAPTER 5EMPIRICAL RESULTS ...28
CHAPTER 6CONCLUSION AND DISCUSSION ...41
REFERENCES ...45
L
IST OFT
ABLESTable 4.1 Variable Definitions ...25
Table 4.2 Summary Statistics ...26
Table 4.3 Correlation Matrix ...27
Table 5.1 Systemic Risk and Incentive Compensations ...33
Table 5.2 Systemic Risk and Stock-Based Compensations ...34
Table 5.3 SRISK and the Use of Stock Options, Stock grants, and Cash Bonus ...35
Table 5.4 MES and the Use of Stock Options, Stock Grants, and Cash Bonus ...36
Table 5.5 SRISK and the Use of Stock Options, Stock grants, and Cash Bonus – Testing without Firm Fixed Effect ...37
Table 5.6 SRISK and the Use of Stock Options, Stock grants, and Cash Bonus – Testing without Time Fixed Effect ...38
Table 5.7 Systemic Risk, the Use of Stock Options, Stock Grants, Cash Bonus, and the Impact of TARP fund...39
CHAPTER
1
I
NTRODUCTIONThe recent subprime lending crisis from the third quarter of 2007 to the fourth quarter of
20091 has led to an increased focus on corporate governance and regulation in the
financial services industry. Specifically, an increased focus on managerial decisions
along with moral hazard issues have once again risen to the surface and are of particular
concern to both politicians and academics who are trying to figure out the causes and
consequences of the crisis.
In particular, during the recovery stage of the financial crisis, moral hazard may
have become even more serious among firms that received the government relief. This is
because remedial measures such as deposit insurance and too-big-to-fail protection
provide management with moral hazard incentives. Merton (1977) argues that deposit
insurance might be considered a put option on the value of a bank's assets at an exercise
price equal to the promised maturity value. He also states that banks seeking to maximize
the value of their equity will maximize the value of the option by increasing asset risk or
minimizing invested capital relative to assets. Thus, Keeley (1990) states that deposit
insurance results in the moral hazard of excessive risk taking. Also, Mishkin, Stern, and
Feldman (2006) state that deposit insurance providing a government safety net and the
too-big-to-fail policy increase moral hazard for major banks. Berger and Turk-Ariss
1 Berger and Bouwman (2013) describe the financial crises that occurred in the US from the first quarter of
(2013) show that government reaction for the recent financial crisis such as expanding
deposit insurance and aiding troubled firms may result in mitigation of market discipline.
This can explain the increases in moral hazard for firms receiving government’s help.
Furthermore, Lambert, Noth, and Schuwer (2013) state that banks that are affected by
enforcement of the U. S. Emergency Stabilization Act experience increases in their
insured deposit, and these banks tend to be riskier because expanding insured deposit
might mitigate market discipline and induce the banks to take risky projects.
For example, the case of American International Group (AIG) illustrates one
example of a financial institution that spent a lot of money on bonuses for its executives
even though it received fund from the Troubled Asset Relief Program (TARP). This is
because financial firms that receive TARP funds may be encouraged to take excessive
risk (e.g., Black and Hazelwood, 2012; Duchin and Sosyura, 2012).
Thus, among the various problems that financial companies face, one of the most
pressing that need to be cared through ample discussion involves executive compensation
structure. That is, a compensation structure that contains base salaries, bonuses, and extra
incentives for top executives has become a serious problem as moral hazards seem
inevitable. If corporate funds are exploited for a manager’s private purposes, such as
excessive risk taking to maximize his or her wealth, this might have a significant negative
influence on firm value and shareholder wealth. Thus, an appropriate compensation
structure is necessary to ensure interests are aligned, and interest in this issue is growing.
Diamond and Rajan (2009) states that CEOs are compensated based on the profits
they produce and this can have negative influences on other firms. Some large financial
to catch up with the large firms. Executives in relatively smaller financial firms might
take excessive risks to improve the performance and profits of firms. Even if managers of
smaller firms recognize that the projects they invest are negative NPV projects, a desire
to skyrocket their stock prices and own wealth might make them to estimate the projects
as great opportunities for them. These phenomena in financial industry lead financial
firms to default and make the whole economy riskier. It implies that systemic risk might
be increased, which means that it would cause the collapse of the entire economy.
Hence, in this paper, I examine the relation between compensation structure and
systemic risk. I mainly hypothesize that changes in the stock-based compensation
structure such as stock options and stock grants may affect systemic risk. To be specific, I
expect that the portion of stock options and systemic risk to be positively related and that
the portion of stock grants and systemic risk to be negatively related. This is because the
stock options are the options on stock price and the stock grants are the options on firm
performance. Managers with stock options might tend to increase short-term firm
performance because they need to maximize the margin between the strike price and the
stock price before the expiration date of the options. On the other hand, managers with
stock grants may tend to focus on long-term firm performance because they can receive a
certain amount of stock compensation after the vesting period. Also, I expect that the
relationship between cash bonus and systemic risk is positive because higher cash bonus
in total compensation package induces managers to pursue short-term performance
because managers receive the bonus when they achieve the short-term performance goals.
The managers with higher incentive compensations may be motivated to take risks that
internalized by each firm. Hence, the systemic risk may increase because of firms’ risk
taking. Furthermore, because both each firm’s contribution to the systemic risk and
market risk are positively interacted, both factors contribute to increase overall systemic
risk. Finally, I examine whether the Troubled Asset Relief Program (TARP) affect the
relationship between stock-based compensation and systemic risk. I expect that TARP
fund may induce manager’s risk-seeking behavior because losses of TARP recipients
may be covered by TARP fund. The results show that my hypotheses are generally
supported. Higher systemic risk has negative external cost on the entire system, and it
causes capital losses of firms. This also increases the probability of default. Thus, firms
may need to mitigate systemic risk and the compensation structure may be a tool to
mitigate the risk.
In the banking industry, an owner tends to be risk seeking, but a manager tends to
be risk averse. Since the owner’s wealth is much larger than the manager’s and the
manager has career and reputation concerns, the impact of losses caused by excessive risk
taking on the two groups differs. The losses account for a relatively small portion of the
owner’s wealth. In contrast, the losses are a relatively large fraction of the manager’s
wealth and the losses can result in executive turnover. Thus, the owner wants to take
excessive risk to maximize his or her rewards, but the manager wants to minimize risk
and losses in his or her own wealth and to protect his or her job security. However, these
two groups’ behavior may change as their compensation structure changes.
Thus, a board of directors must hire appropriate managers based on the board’s
shareholders. That is, the board of directors ultimately aims to improve the value of the
firm. This objective has been applied in the compensation structure.
To encourage the manager to take the ideal level of risk, which is same as the
owner’s interest, the board of directors provides incentive compensation, such as stock
options as this incentive structure. This is designed to make managers to take on positive
NPV projects. However, since managers with excessive stock-based incentive
compensation would be more sensitive to stock return volatility and have incentives to
maximize their own wealth regardless of the owner’s wealth and to engage in debt
finance to invest on the projects, granting excessive stock-based incentive compensation
may result in excessive risk taking and aggravation of firm value. This creates the moral
hazard of excessive risk taking. To avoid the moral hazard of the excessive risk taking,
the board of directors determines balanced incentive compensation packages including
stock options, stock grants, and cash bonuses in the compensation structure.
Since stock-based compensation of a bank manager is tied to stock price
appreciation and banks are generally highly leveraged, bank managers have a strong
incentive to take risks to maximize their personal wealth if they have equity based
incentive contracts.
In particular, a manager with stock options earn huge compensation as firm’s
stock price increases, but there is no huge loss on his or her compensation as firm’s stock
price decreases because the manager can abandon the right to exercise the options when
the stock price is below a strike price. This implies that stock options provide limited
downside risk and unlimited upside reward. Thus, the manager who has stock options
On the other hand, different from stock options, stock grants, which means that a
manager is endowed with firm’s shares, do not have a strike price. So, a manager who
has stock grants receives huge rewards when the stock price increases and also earns
rewards that are generally at least larger than zero profit even though the stock price
decreases sharply and the amount of reward is pretty small. Thus, stock grants may make
the manager more prudent in making investment decisions because the manager’s
interests are closely aligned with the shareholders’ interests and the amount of
compensation is tied to the change in stock price symmetrically. Hence, because of its
symmetric compensation structure, a manager who has stock grants is less likely to take
excessive risk than the manager who has stock options.
Many studies examine the relation between executive compensation and market
risk. The discussion concerning financial institutions’ risk is important because the
relation between risk and the compensation structure is closely related to legislation,
enactment, and the enforcement of regulation. However, few studies examine the relation
between executive compensation and systemic risk even though previous financial crises
demonstrate the importance of systemic risk.
Systemic risk is different from systematic risk. Systematic risk, which is
sometimes called market risk, is the risk inherent in the aggregate market that cannot be
eliminated through diversification. While systematic risk cannot be eliminated by
diversification, it can be mitigated by appropriate hedges. For example, if an investor
builds a well-diversified portfolio with products in the United States, the idiosyncratic
risk of the investor’s portfolio may be mitigated but systematic risk exists. If the dollar
be mitigated if the investor includes some products that are appreciated by the other
currency in his or her portfolio.
On the other hand, systemic risk is generally described as risk caused by an event
at the firm level that is severe enough to cause instability in the financial system. This
means that an externality exists. Thus, unless the external costs of systemic risk are
internalized by each firm, firms will have incentive to take risks that are not borne by the
firm but by the entire economy. Hence, the financial firm’s risk is a negative externality
for the whole system. Also, unlike systematic risk, systemic risk cannot be mitigated by
diversification or hedging. These two risks combine and interact in a complementary way
to increase overall systemic risk, which is the probability of a crisis in the financial
industry. From the perspective of measures of the risks, the difference between systemic
risk measure and beta, which is a widespread measure of market risk, arises from the fact
that systemic risk is based on tail dependence rather than average covariance.
Brunnermeier, Dong, and Palia (2012) show that commercial banks with higher
non-interest income such as trading income and investment banking/venture capital
income to interest income ratios have higher systemic risk. This implies that higher level
of investment banking activities, which are not traditional commercial banks’ activities,
are associated with a larger contribution to systemic risk. In addition, the authors state
that there is a large increase in the average non-interest income to interest income ratio
from 2000 to 2008. This indicates that the portion of investment banking services of most
major banks has increased over time. As such, the link between collapses in financial
system and negative externalities of the collapses to the entire economy will play a
Since systemic risk is the risk of the collapse of an entire financial system and
compensation structure is affected by firms’ condition and firm value, the relation
between systemic risk and firm value cannot be ignored when firms design their
managers’ compensation structures. This is because the collapse in financial system
might cause negative impact on firms’ condition and value. Also, because the systemic
risk measure shows its predictive power (e.g., eight of ten firms with higher contribution
to systemic risk have really troubled when systemic risk measure was high and the
financial crisis occurred2), a board of directors can use compensation policies as a tool to
prevent a manager from taking excessive risk and elevating systemic risk before financial
crisis occurs. This may cause relatively stable firm value and lower level of systemic risk.
Some previous studies suggest that non-interest income is more volatile than
interest income over time in the United States so it increases revenue volatility and
systemic risk. (e.g., Smith, Staikouras and Wood, 2003; DeYoung and Roland, 2001;
Brunnermeier, Dong, and Palia, 2012). Since stock-based compensation usually occupies
a significant portion of the entire pay package for bank executives and non-traditional
activities are prevalent among the major banks, managers may engage in non-traditional
activities to maximize both firm value and his or her total compensation. Thus, this
activity might affect the growth trend in non-interest income and systemic risk.
The main contributions of my study are as follows: First of all, to the best of my
knowledge, the study that examines the relation between compensation structure and
systemic risk is rare. Thus, the findings in this paper may show how firms sensitively
2 Brownlees and Engle (2011) state that one year and a half before the Lehman bankruptcy, eight firms that
react to mitigate the systemic risk when the firms design their management’s
compensation structure. Second, if the clear relationship between the systemic risk and
the compensation is empirically established, this would be helpful in constructing the
optimal compensation structure for the perspective of firms and in designing a policy that
could prevent the managers from pursuing only their own wealth, protect firm stability,
and reduce the externalities on the entire economy for the perspective of regulators.
The remainder of this paper is organized as follows. I first review the existing
literatures on executive compensation in financial firms and systemic risk. In Section 3, I
develop testable hypotheses. Section 4 describes the data and sample selection procedures
and the methodology and discusses possible outlines for my research. Section 5 provides
CHAPTER 2
L
ITERATURER
EVIEW2.1 Stock-based compensation
If an owner of the firm is the CEO, management and shareholder interests are
aligned, so there is no agency cost at the CEO level. However, if ownership and
management are separated, shareholders need to monitor managerial behavior and
prohibit manager’s rent-seeking behavior. Incentive compensation such as stock-based
compensation may help resolve any conflict of interest between shareholder and
managers and to maximize the wealth of shareholders (e.g., Jensen and Murphy, 1990).
There are two general types of stock-based compensation: stock option and stock
grants. Stock options have traditionally been considered as appropriate incentive policy in
order to mitigate the principal-agent problem between a manager and shareholders (e.g.,
Haugen and Senbet, 1981; Jensen and Murphy, 1990; Morgan and Poulsen, 2001). For
the purpose of improving firm value, stock options were introduced in 1920s. In 1980s,
stock options were widely spread to promote shareholder’s interest and to motivate
managers during the economic slump. As a result, 83 percent of the 100 largest firms in
the U.S. had option plans for their managers in 1980s (e.g., Defusco, Zorn, and Johnson,
1991). According to Murphy (1999), stock options occupied the largest portion of CEO
compensation packages in the early 1990s. Also, the dollar-valued amount of stock
These show that stock options are used as one of the most important compensation
methods for management.
Stock options, since they are call options, present managers with limited
downside risk and unlimited upward potential due to their asymmetric payoffs. Stock
options thus provide managers incentives to engage in risk-seeking (e.g., Brookfield and
Ormrod, 2000). Hence, excessive stock option might cause excessive risk taking, and this
may cause a decrease in firm value and default.
For the perspective of stock grants, the wealth of a manager follows firm
performance and firm value. It means that the manager’s wealth is closely related to
long-term firm performance instead of short-long-term stock return volatility. That is, stock grants
provide more symmetric payoffs than stock options, so the manager with stock grants
tends to be prudent when he or she make investment decisions.
The findings of previous research that examine the impact of stock options are
mixed. Some previous studies state that stock options, which is one of the most popular
incentive compensation, ease agency costs; the manager’s moral hazard is reduced when
the manager receives stock options. This, in turn, leads to improvement of firm
performance. (e.g., Jensen and Meckling, 1976, Haugen and Senbet, 1981, Barnea,
Haugen, and Senbet, 1981)
On the other hand, Bebchuk and Fried (2003) find that conferring stock options
might cause agency problems. They show that bad corporate governance leads to
excessive stock options compensation for managers. This is because both the firm’s
corporate governance and incentive compensation for managers can mitigate the
problem, more stock options for managers are needed when the firm’s corporate
governance is bad.
Amihud and Lev (1981) argue that compensating with stock grants gives a
manager strong incentive to receive their maximized compensation because the interest
of the manager and the shareholders is aligned. The manager tends to be risk-averse to
avoid losses in his or her own stock. The authors also state that it might cause lower firm
value in the long run. On the other hand, since a manager who has received stock options
can choose whether he or she exercises the option based on the difference between the
stock price and the exercise price, stock options may provide a manager a shield in that
he can avoid a risk of decreasing compensation as stock price falls. It can reduce the
manager’s risk-averse tendency, so the manager can invest actively. The progressive
investment behavior by the manager make firms avoid the losses in firm value due to
passive decision making. Thus, the stock options in the executive compensation structure
contribute to improve firm performance in the long run. (e.g., Haugen and Senbet, 1981,
Core and Guay, 1999)
In addition, Yermack (1995) shows that stock options are more attractive
compensation method than stock grants for the perspective of the manager. Thus, the
author argues that the ratio of stock option in the executive compensation package might
increase if the manager can affect the decision for the executive compensation structure.
That implies that the manager prefer to have more stock options. The excessive stock
options may cause a reduction in firm value because excessive stock options give the
manager an incentive to be risk-seeking. (e.g., Cassidy, 2002; Hall & Murphy, 2002;
Also, DeFusco, Zorn, and Johnson (1991) and Yeo, Chen, Ho, and Lee (1999)
find that conferring stock options to executives does not affect long-term performance of
firms or even negatively affect the firms’ performance in the long run.
Furthermore, according to recent research on this issue by Dittmann and Maug
(2007), to reduce compensation costs, CEOs should have lower base salaries and receive
stock grants instead of stock options. The contracts would reduce average compensation
costs by 20% while providing the same incentives and the same utility to CEOs.
Hence, according to previous studies, stock options, stock grants, and base
salaries are important factor to determine a manager’s incentive to take excessive risk, so
these compensation policies are also crucial to improve firm value by reducing a
manager’s moral hazard.
2.2 Systemic risk
According to Brunnermeier, Dong, and Palia (2012), commercial banks that
pursue more non-traditional banking activities such as investment banking, venture
capital, and trading activities cause increases in systemic risk in comparison with
commercial banks that concentrate on traditional banking activities such as deposit taking
and lending. This is because the return of non-traditional banking is more volatile than
traditional banking.
Although there are several kinds of systemic risk measures, it is still debatable
which one is the most efficient and appropriate measure of systemic risk. Acharya,
Pedersen, Philippon, and Richardson (2010) propose a simple model of systemic risk.
They argue that its systemic expected shortfall (SES) can measure each financial
undercapitalized when the system as a whole is undercapitalized. SES measure captures a
bank’s exposure given that there is a systemic crisis. The authors also state that the
Marginal Expected Shortfall (MES), which is the equity loss of each individual firm in
the tail of the aggregate system’s loss distribution, is simple to compute and forecast
systemic risk. The MES measures how firm’s risk taking adds to the bank's overall risk.
That is, the MES might be measured by estimating firm’s losses when the firm is
suffering economy slump. They show that the MES and leverage forecast each firm’s
contribution to the entire systemic risk.
Brownlees and Engle (2011) define the systemic risk of a financial institution as
its contribution to the total capital shortfall of the financial system that can be expected in
a future crisis. Also, the authors propose a systemic risk measure (SRISK) that captures
the expected capital shortage of a firm given its degree of leverage and Marginal
Expected Shortfall (MES) based on a study of Acharya, Pedersen, Philippon, and
Richardson (2010).
In this paper, I would like to measure the expected capital loss of each individual
firm given its degree of leverage and the average expected return of each individual firm
if the systemic crisis occurs. Since both MES and SRISK focus on the magnitude of a
bank's exposure to a systemic crisis, it is proper measures for my issues. Thus, I use
SRISK from Brownlees and Engle (2011) to measure individual firm’s contribution to the
entire systemic risk. Also, because of its easiness to compute and forecast systemic risk, I
run the robustness tests with MES from Acharya, Pedersen, Philippon, and Richardson
easily accessible through the volatility institute of Stern business school
(http://vlab.stern.nyu.edu/analysis/RISK.USFIN-MR.MES).
In addition to SRISK and MES, there are various systemic risk measures. To
measure systemic risk, Brunnermeier, Dong, and Palia (2012) considered several kinds of
widely used measures for systemic risk. Among several kinds of measurements, they
decided to use two measures: ∆CoVaR and Systemic expected shortfall (SES).
Adrian and Brunnermeier (2011) describe CoVaR as the value at risk of the
financial system conditional on institutions being in distress. They define an institution’s
contribution to systemic risk as the difference between CoVaR conditional on the
institution being in distress and CoVaR in the median state of the institution. Thus, it can
be expressed as ∆CoVaR.
Allen, Bali, and Tang (2012) develop an alternative measure for systemic risk,
CATFIN. CATFIN is a measure of aggregate systemic risk using the 1% VaR measures
of a cross-section of financial firms that complements bank-specific systemic risk
measures by forecasting macroeconomic downturns six months into the future using
out-of-sample tests conducted with U.S., European, and Asian bank data. The authors state
that micro-level measures of systemic risk focus on the interrelationships across
individual financial institutions. On the other hand, macro-level measures of systemic
risk focus on whether interbank externalities are substantial enough to threaten real
macroeconomic conditions. Hence, they argue that CATFIN can be used in conjunction
with micro-level measures to calibrate regulatory limits and risk premiums on individual
Furthermore, Rodríguez-Moreno and Peña (2012) argue that a simpler measure is
better than a complicated measure. They argue that the best indicators of systemic risk
are the first Principal Component of the single-name CDSs, followed by the LIBOR-OIS
and LIBOR-TBILL spreads. They also insist that the least reliable indicators are the
Co-Risk measures and the systemic spreads extracted from the CDO indexes and their
tranches. Using three different criteria such as causality tests, price discovery tests and
their correlation with an index of systemic events, the authors examine the comparison
among six different sets of systemic risk measures: Principal components of the bank’s
Credit Default Swaps (CDSs), Interbank interest rate spreads, Structural credit risk
models, Collateralized Debt Obligations (CDOs) indexes and their tranches, Multivariate
densities computed from CDS spreads and Co-Risk measures.
Systemic risk measures that I use in this paper show that we can capture systemic
risk level by measured the losses of the market value of equity of financial firms in the
prior year’s 5% worst case periods of aggregate stock market losses. It implies that the
systemic risk measures explain changes in market capitalization, which is the proxy for
firm value, so it means that higher systemic risk causes falls in firm value (e.g., Acharya,
Lester, Pedersen, Philippon and Richardson, 2009). Since drops in firm value is important
problem for the owner, shareholders, and even managers, the board of directors may take
CHAPTER
3
H
YPOTHESISD
EVELOPMENTAccording to Brunnermeier, Dong, and Palia (2012), there is the growth trend in
non-interest income, and it results in higher systemic risk. Since traditional banking has less
pay-performance sensitivity and pay-risk sensitivity than non-traditional banking,
increases in non-interest income are related to aggressive investment of the manager. I
think that more incentive compensation for executives may result in the manager’s
excessive risk taking for several risky projects that are related to non-traditional banking.
It also lead to higher systemic risk.
Berle and Means (1932) state that agency cost decreases as a manager’s
ownership increases when ownership and management are separated, and the study also
show that decreasing the agency cost gives managers an incentive to align their interest
with shareholders. It means that stock grants for executive compensation might positively
affect firm value. Furthermore, according to Dittmann and Maug (2007), to reduce
compensation costs and to maximize the firm value, CEOs should have lower base
salaries and receive stock grants instead of stock options.
Thus, the portion of stock options in the compensation package of management
might increase systemic risk because excessive stock options give management an
incentive to be risk-seeking when they make decisions for investment with the goal to
period, firms pay for the executive’s stock grants later. So, managers need to make firms
performance better to avoid default. Thus, the managers might be prudent when they
make investment decisions. Otherwise, the portion of stock grants may have positive
relation to systemic risk. Since the stock grants are also one of incentive compensation, it
induce the managers to take positive NPV projects to maximize the wealth of
shareholders and their own wealth.
Hence, a board of directors may reduce the portion of stock options for executive
compensation and increase the portion of stock grants instead of stock options to mitigate
agency problem and to avoid a loss of shareholders’ profit and firm value.
Furthermore, if cash bonus is higher, the effect of cash bonus may be similar to
that of stock options. This is because the manager who has cash bonus needs to achieve
yearly goal or short-term goal to receive the cash bonus. Thus, the manager with higher
portion of cash bonus might take more risk to achieve the short-term goal and to increase
his or her own wealth. Also, because investment banking part has plenty of high risk and
high return projects and is prevalent after the deregulation, non-interest income might
increase and systemic risk also increases. Hence, I develop hypotheses that I mainly
examine in this paper.
Hypothesis 1: The portion of stock options for executive compensation positively affects a firm’s contribution to the entire systemic risk.
Hypothesis 2: The portion of stock grants for executive compensation inversely affects a firm’s contribution to the entire systemic risk.
Hypothesis 2A: The portion of stock grants for executive compensation positively affects a firm’s contribution to the entire systemic risk.
However, according to DeYoung, Peng, and Yan (2013), managers and owners of
banks that receive government remedies do not have an incentive to be risk-averse even if
they only have risky projects. Because of government’s funding such as the Troubled
Asset Relief Program (TARP), the banks have less downside risk. This implies that the
banks, which are TARP recipients, do not lose everything but can lose a certain degree of
their value. That is, both the owners and the managers of the TARP recipients prefer to
take excessive risky projects because the interest of the owners and the managers are
aligned. Thus, a board of directors induces the managers to take risky projects for
maximizing firm value. Hence, for the firms with the TARP, the amount of stock grants
that is originally intended to make the managers risk averse may not work well, and the
amount of stock options might have larger impact on the level of systemic risk, so I
develop more specified hypothesis.
Hypothesis 4: The TARP fund induces managers to take risk, so the impact of awarding stock options and stock grants on systemic risk is positive.
For the U.S. financial firms during the crisis, Balachandran, Kogut and Harnal
(2010) suggest that CEO equity-based compensation increases the probability of the
bank’s default. The bank’s default may cause the negative externalities to the entire
economy. It implies that systemic risk may increase. Thus, I expect that the ratios of
stock-based compensation such as stock options and stock grants might have stronger
positive relationships to systemic risk in the recent financial crisis as compared to
non-crisis periods.
CHAPTER 4
D
ATA ANDM
ETHODOLOGY4.1 Data
To test hypotheses, I need to gather systemic risk data and data about
compensation structure of executives. For the systemic risk data, I collect data of
systemic risk measures from the volatility institute of Stern business school at New York
University (http://vlab.stern.nyu.edu/analysis/RISK.USFIN-MR.MES). The institute
provides monthly systemic risk indices such as MES and SRISK for financial firms that
highly contribute to the entire systemic risk. I gather MES and SRISK data from 2000 to
2012. After merging all monthly datasets, I have 92 financial firms that contribute to the
entire systemic risk during the sample period from 2000 to 2012.
For the compensation data, I collect the top management compensation data
through Standard and Poor’s Execucomp database. Following sample firms that are
covered by systemic risk measures data from the volatility institute of Stern business
school, I collect all firm-year observations for the 92 firms from 2000 to 2012. Through
the compensation data, I collect data about the dollar value of total compensation, stock
options, stock grants, base salary, and bonuses. In addition to compensation data, I obtain
balance sheet data and income statement accounting data from COMPUSTAT
Fundamentals. The accounting data includes total asset, total equity, total debt, net
income. Also, I gather a firm’s stock price data and market capitalization data, which is
the U.S. Department of the Treasury, I collect the list of TARP recipients among my
sample firms. My sample is from 2000 to 2012, and consists of an unbalanced panel of 92
financial firms. The panel represents the most important companies in the banking
industry in the U.S. during the sample period.
4.2 Dependent variables and Independent variables
In light of the foregoing discussion of previous literatures, I study several factors
that affect my key variables. I use the measure of systemic risk as a key dependent
variable. According to past literature, there are several kinds of measures of systemic risk
and the accuracy of each measure is still debatable. In this paper, I use SRISK, which are
used as proxies for systemic risk from Brownlees and Engle (2011). Since a systemic risk
measure (SRISK) that captures the expected capital shortage of a firm given its degree of
leverage and Marginal Expected Shortfall (MES), which is the expected loss an equity
investor in a financial firm would experience if the overall market declined substantially,
the level of SRISK measure shows that firms’ contribution to the market
undercapitalization in a crisis explains the level of systemic risk of the firms.
My key independent variables are related to compensation structure. I focus on
the impact of incentive compensation structure on systemic risk contribution. Also, I
decompose incentive compensations into three kinds of components such as stock
options, stock grants, and bonuses. I examine the relationship between granting stock
options and systemic risk. Similarly, I examine the relationship between stock grants and
systemic risk and the relationship between bonuses and systemic risk. I use management
stock options variable, which is the dollar amount of shares that the executive can get if
an independent variable. In addition, I use the management stock grants variable. This is
the dollar amount of stock grants of the firm that the executive receives as the
compensation mean divided by the total amount of the compensation as an independent
variable. Lastly, I use the management cash bonus variable, which is the dollar amount of
bonuses that the executives receive divided by the total amount of the compensation as an
independent variable.
4.3 Control variables
To investigate clear relations between key independent variables and dependent
variables, I include some control variables, which are already proved that these influence
the dependent variable of this paper such as systemic risk measures. Acharya, Pedersen,
Philippon, and Richardson (2010) include leverage, volatility, and log of total asset in
their models and Brunnermeier, Dong, and Palia (2012) include market-to-book,
leverage, log of total asset, and the squared value of log of total asset. Following
Acharya, Pedersen, Philippon, and Richardson (2010) and Brunnermeier, Dong, and Palia
(2012), I include natural log of total asset of a firm as firm size variable and its squared
variable. Also, I include market to book ratio and leverage. Furthermore, to capture
market risk of each firm, I include volatility variable in my model. Detailed sources for
each specific variable used in the paper are given in Table 4.1.
4.4 Models
In this paper, to examine the relationship between executive compensation and
systemic risk, I use fixed effect models with unbalanced panel data. Since fixed effect
individual characteristics if I regress without fixed effect model, the results with fixed
effect models may be more accurate. The fixed effect model that I use is as follow.
Yit = µi + vt + β′𝑋𝑖𝑡+ 𝜀it (1)
In the equation (1), µi means each firm’s individual specific effect, and vt means
that time specific effect. 𝑋𝑖𝑡 is a set of explanatory variables, and 𝜀it is an error term,
which assumes that E(𝜀it)=0 and Var(𝜀it)=𝜎2. Based on this equation, I regress the
individual firm’s systemic risk contribution on its three different incentive compensations
over total compensation along with other control variables such as volatility, market to
book, financial leverage, and firm size and include firm and yearly fixed effects. The base
model is as follows.3
SRISK = µ+v+ β0 + β1RSO + β2RSG + β3RBP + β4MB + β5STD + β6SIZE + β7SIZE2 (2)
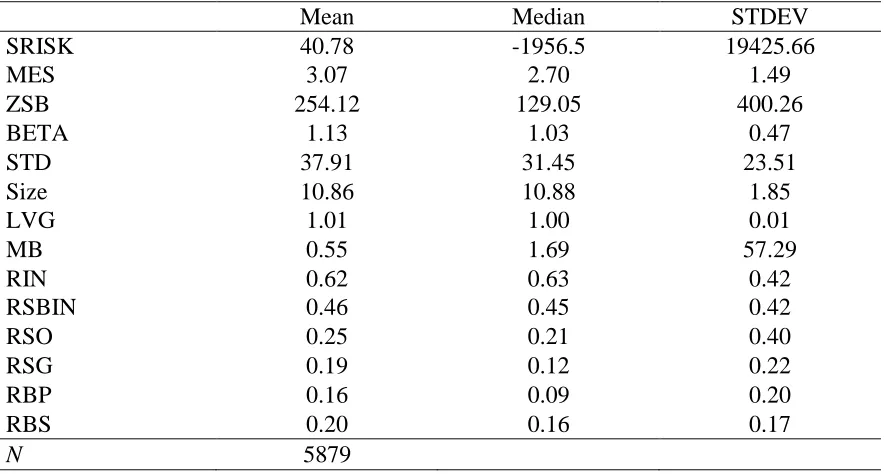
Table 4.2 presents the summary statistics. Average of firms’ contribution to the
market undercapitalization in a crisis is about $40.8 million and the deviation of SRISK
is too huge. This implies that a few firms get a large share of the entire systemic risk.
Also, the average asset size of the firms is $ 5.2 billion and the standard deviation of asset
size is 1.85. The average ratio of incentive compensation including stock-based
compensations and bonuses is 0.62. To be specific, the average ratios of stock options
and stock grants across sample periods are 0.25 and 0.19, respectively.
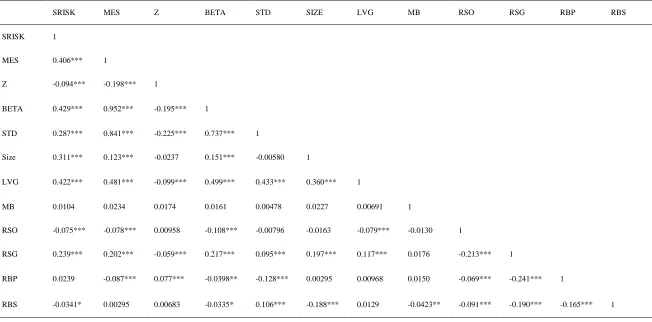
In Table 4.3, I find that the correlation between the two systemic risk measures
SRISK and MES is 0.401, suggesting that these two measures capture some similar
3 The base model includes following variables. RSO is the ratio of stock options, which is the dollar
patterns in systemic risk. Also, the correlation matrix reports correlation between
systemic risk measures and market risk measures such as the Altman’s Z-score and beta.
These correlation results show that systemic risk and market risk have same direction. I
find that higher volatility, leverage and size result in higher systemic risk. Furthermore,
the ratio of incentive compensations and that of stock-based compensation have positive
correlation with systemic risk. One important finding from the correlation matrix is that
the ratio of stock options is negatively correlated with systemic risk. This contradicts the
regression results of this paper. However, in this correlation matrix, we do not control
any other variables. On the other hand, we do control various variables in the regression
tests. Thus, the results from the regression tests are more important. Other incentive
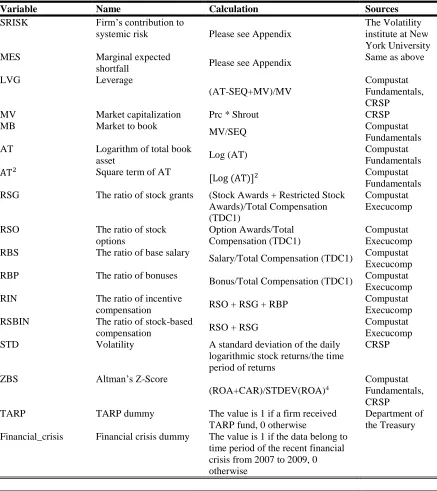
Table 4.1 Variable definitions
Variable Name Calculation Sources
SRISK Firm’s contribution to
systemic risk Please see Appendix
The Volatility institute at New York University
MES Marginal expected
shortfall Please see Appendix
Same as above
LVG Leverage
(AT-SEQ+MV)/MV
Compustat Fundamentals, CRSP
MV Market capitalization Prc * Shrout CRSP
MB Market to book
MV/SEQ Compustat
Fundamentals AT Logarithm of total book
asset Log (AT)
Compustat Fundamentals
AT2 Square term of AT
[Log (AT)]2 Compustat
Fundamentals RSG The ratio of stock grants (Stock Awards + Restricted Stock
Awards)/Total Compensation (TDC1)
Compustat Execucomp
RSO The ratio of stock
options
Option Awards/Total Compensation (TDC1)
Compustat Execucomp RBS The ratio of base salary
Salary/Total Compensation (TDC1) Compustat Execucomp RBP The ratio of bonuses
Bonus/Total Compensation (TDC1) Compustat Execucomp RIN The ratio of incentive
compensation RSO + RSG + RBP
Compustat Execucomp RSBIN The ratio of stock-based
compensation RSO + RSG
Compustat Execucomp STD Volatility A standard deviation of the daily
logarithmic stock returns/the time period of returns
CRSP
ZBS Altman’s Z-Score
(ROA+CAR)/STDEV(ROA)4
Compustat Fundamentals, CRSP
TARP TARP dummy The value is 1 if a firm received TARP fund, 0 otherwise
Department of the Treasury Financial_crisis Financial crisis dummy The value is 1 if the data belong to
time period of the recent financial crisis from 2007 to 2009, 0 otherwise
Table 4.2 Summary Statistics
Mean Median STDEV
SRISK 40.78 -1956.5 19425.66
MES 3.07 2.70 1.49
ZSB 254.12 129.05 400.26
BETA 1.13 1.03 0.47
STD 37.91 31.45 23.51
Size 10.86 10.88 1.85
LVG 1.01 1.00 0.01
MB 0.55 1.69 57.29
RIN 0.62 0.63 0.42
RSBIN 0.46 0.45 0.42
RSO 0.25 0.21 0.40
RSG 0.19 0.12 0.22
RBP 0.16 0.09 0.20
RBS 0.20 0.16 0.17
27
Table 4.3 Correlation Matrix
This table reports correlation coefficients for the key variables such as systemic risk measures, market risk measure, firm characteristics, and compensation structure for the regression analysis. The definition of key variables is on Table 4.1. * p < 0.05, ** p < 0.01, *** p < 0.001
SRISK MES Z BETA STD SIZE LVG MB RSO RSG RBP RBS
SRISK 1
MES 0.406*** 1
Z -0.094*** -0.198*** 1
BETA 0.429*** 0.952*** -0.195*** 1
STD 0.287*** 0.841*** -0.225*** 0.737*** 1
Size 0.311*** 0.123*** -0.0237 0.151*** -0.00580 1
LVG 0.422*** 0.481*** -0.099*** 0.499*** 0.433*** 0.360*** 1
MB 0.0104 0.0234 0.0174 0.0161 0.00478 0.0227 0.00691 1
RSO -0.075*** -0.078*** 0.00958 -0.108*** -0.00796 -0.0163 -0.079*** -0.0130 1
RSG 0.239*** 0.202*** -0.059*** 0.217*** 0.095*** 0.197*** 0.117*** 0.0176 -0.213*** 1
RBP 0.0239 -0.087*** 0.077*** -0.0398** -0.128*** 0.00295 0.00968 0.0150 -0.069*** -0.241*** 1
CHAPTER
5
E
MPIRICAL RESULTSI run a multivariate regression to examine the impact of incentive compensations and that
of stock-based compensation on systemic risk first. The results of which are given in
Table 5.1 and 5.2. The key dependent variable is the systemic risk measure SRISK, and I
include MES for the robustness test. Columns 1 and 2 are the tests with SRISK, and
columns 3 and 4 are the tests with MES. All independent variables are estimated with a
one year lag, and also include both firm and yearly fixed-effects. Columns 5 and 6 are the
tests without both fixed effects for the robustness tests. Since I use the fixed effect model
to avoid biased results caused by omitted variable, the results are robust if my hypotheses
are still supported even though I drop the fixed effect. This implies that there is no
omitted variable that closely affects the result.
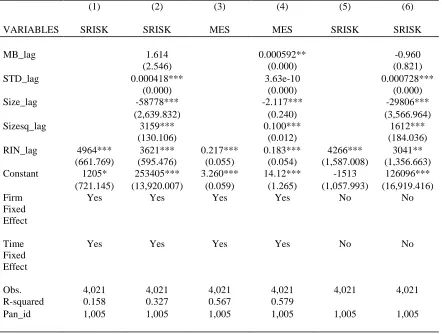
In the Table 5.1, I examine columns 1 and 3 with only the ratio of incentive
compensations, which is the main explanatory variable in the test. Through these two
tests, I ensure that the results are not resulted by other independent variables and spurious
correlation between independent variables. I find that the ratio of incentive
compensations is significantly positive to both SRISK and MES. It means that the higher
incentive compensation ratio leads to higher systemic risk. In columns 2 and 4, I add
control variables to check the results from tests in columns 1 and 3. I still find that the
ratio is significantly positive to both systemic risk measures but the values of coefficient
time fixed effects in columns 5 and 6. The results are still unchanged. These also show
the significantly positive relationship between systemic risk and the ratio of incentive
compensations.
In Table 5.2, I examine same tests that I do in Table 5.1 with different key
independent variable, which is the ratio of stock-based compensations. I find quite similar
results to results in Table 5.1. I find the positive relationship between the ratio of
stock-based compensations and systemic risk, and the results are robust through the robustness
tests with different systemic risk measure, which is MES, and without fixed effects,
respectively.
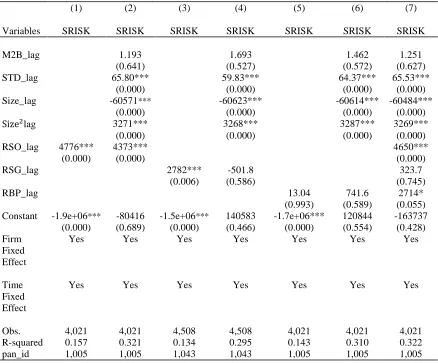
In Table 5.3, which is the main table of this paper, I subdivide the ratio of
stock-based compensations and include the ratio of cash bonus in the models. The ratio of
stock-based compensations is divided into the ratio of stock options and the ratio of stock
grants. Through tests in Table 5.3, I find that the ratio of stock options is significantly
positive to systemic risk and find weak evidence that the ratio of cash bonus is positively
affect systemic risk. But, I find that the ratio of stock grants has significantly positive
relation with systemic risk only when I examine the test including only the key
independent variable. That is, I find no significant evidence concerning the relationship
between the ratio of stock grants and systemic risk. Although the result about the ratio of
stock grants in columns 4 and 7 are insignificant, the signs of coefficients support my
hypothesis 2A, which expect that the impact of stock grants on systemic risk might be
positive. Also, the effects of both hypotheses 2A and 2B may be either weak or strong. If
both are strong, then both effects may offset each other. Thus, the results could be
Since past literature shows that non-traditional activities are prevalent among the
major banks after deregulation, which means that there are lots of projects related to
non-traditional banking, and the stock grants also provides a manager an incentive to take
risky project and aligns the interests between the manager and the owner, the manager
with stock grants may have an incentive to maximize both their own wealth and
shareholders’ wealth, and the manager might engage in non-traditional banking projects
when he or she choose the project to maximize both firm value and his or her total
wealth. Non-traditional banking not only improves firm value but also increases revenue
volatility and systemic risk. Thus, firms with the managers who engage in investment
banking activities to improve firm value may make systemic risk high regardless of the
amount of stock options and stock grants in the manager’s compensation package even
though stock options induce the managers to take more risky projects and the impact of
stock options in compensation structure might be greater than that of stock grants.
Hypothesis 3, which states that the higher portion of cash bonus may increase systemic
risk, is weakly supported by the results.
For the perspective of economic significance of the coefficients, the results show
that each unit increase in the ratio of stock options causes systemic risk measures to rise
by $ 4,535 million, which is the expected capital shortage and each unit increase in the
ratio of cash bonus causes systemic risk measures to rise by $ 2,382 million. For the
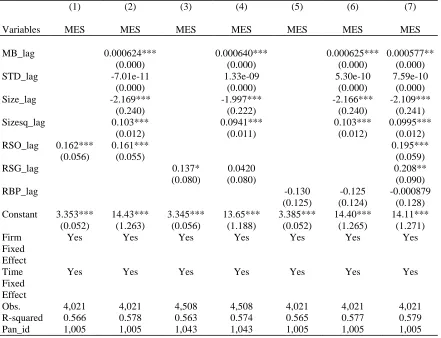
robustness tests, I examine same tests with MES, without firm fixed effect, and without
time fixed effect, respectively. The results are in Table 5.4, 5.5, and 5.6, respectively.
These results suggest that the ratio of stock options contributes positively to systemic risk
variable. Also, the regressions without either firm fixed effect or time fixed effect show
that the results are generally remained the same. Specifically, the regression tests in
column 7 of each table that includes all control variables and key independent variables
suggest that almost all results in column 7 for Table 5.4, 5.5, and 5.6 are statistically
significant and support my hypotheses. It implies that there is no significant omitted
variable that results in biased results.
In addition, I split the sample firms into four groups such as depository,
broker-dealer, insurance, and others and run the main test. The tables are not included in the
paper, but the results suggest that only depository has the positive impact of the ratio of
stock options on systemic risk but it is not statistically significant. These could be
explained that shareholders and managers in depository may have more risk-taking
behavior because of deposit insurance and the significance may be diluted because of too
small sample size. The impact of the other key variables are also mixed. This may
support the explanation that the impact of hypotheses 2A and 2B are both strong and
offset each other.
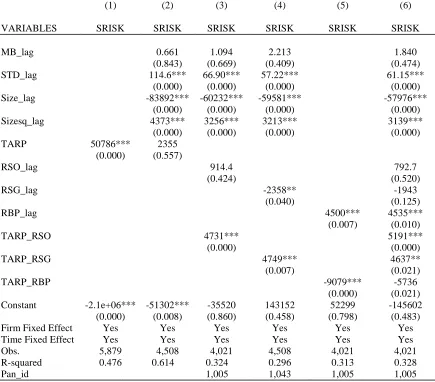
Table 5.7 includes the results of the models when considering the effect of the
TARP. The TARP fund may affect the effect of granting stock options, stocks, and cash
bonus on systemic risk. Almost all results concerning about stock options and stock
grants are statistically significant and the signs of coefficients are all positive. It implies
that TARP induces a management to take risky projects so it affects the level of systemic
risk. This supports my hypotheses that both managers and owners of firms receiving
TARP tend to be more risk-seeking because they do not lose everything they have even if
lose some amount of their wealth but the amount is not that huge because TARP fund
covers the loss. However, the impact of cash bonus has different direction. The
interaction terms between TARP recipient dummy and the ratio of cash bonus have
negative signs. It is statistically significant when I include the ratio of cash bonus
variable, its interaction variable with TARP recipient dummy, and control variables but
the significance disappears when I include all other key independent variables and
interaction terms. For the robustness test, I exclude firm fixed effect from the models. All
results are still statistically significant and suggest positive relationship between the ratios
of stock options and stock grants and systemic risk.
Lastly, I examine the relationship between systemic risk and the ratios of stock
options, stock grants, and cash bonus during the recent financial crisis. The results
suggest that all interaction terms such as Crisis_RSO, Crisis_RSG, Crisis_RBP have
positively significant relation to systemic risk measure. These results imply that
risk-taking behavior of managers with higher stock options or higher stock grants is even
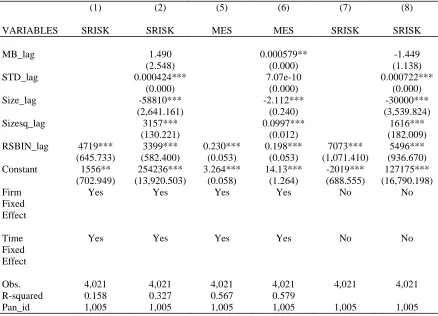
Table 5.1. Systemic Risk and Incentive Compensations
This table reports the regression estimates of the relation between the ratio of incentive compensation and systemic risk using SRISK as a key dependent variable. I also use Marginal Expected Shortfall (MES) for the robustness test in columns 3 and 4. I define the incentive compensation measure as the ratio of incentive compensation (RIN) and determine it as the dollar amount of incentive compensation including stock options, stock grants, and bonuses over the dollar amount of total compensation. All independent variables are lagged. MB is a measure of Market-to-book ratio, STD is volatility, Size is the natural log of total asset, and Sizesq is the squared value of the natural log of total asset. I indicate whether I use firm fixed effect and time fixed effect in the table. The sample period runs from 2000 to 2012. Please see Table 4.1 and relevant section in the paper for details on the definitions and determination of all variables utilized in the regressions. Standard errors in parentheses. ***, ** and * indicate significance at the 1%, 5% and 10% levels, respectively.
(1) (2) (3) (4) (5) (6)
VARIABLES SRISK SRISK MES MES SRISK SRISK
MB_lag 1.614 0.000592** -0.960
(2.546) (0.000) (0.821)
STD_lag 0.000418*** 3.63e-10 0.000728***
(0.000) (0.000) (0.000)
Size_lag -58778*** -2.117*** -29806***
(2,639.832) (0.240) (3,566.964)
Sizesq_lag 3159*** 0.100*** 1612***
(130.106) (0.012) (184.036)
RIN_lag 4964*** 3621*** 0.217*** 0.183*** 4266*** 3041** (661.769) (595.476) (0.055) (0.054) (1,587.008) (1,356.663) Constant 1205* 253405*** 3.260*** 14.12*** -1513 126096*** (721.145) (13,920.007) (0.059) (1.265) (1,057.993) (16,919.416) Firm
Fixed Effect
Yes Yes Yes Yes No No
Time Fixed Effect
Yes Yes Yes Yes No No
Obs. 4,021 4,021 4,021 4,021 4,021 4,021
R-squared 0.158 0.327 0.567 0.579
Table 5.2. Systemic Risk and Stock-Based Compensations
This table reports the regression estimates of the relation between the ratio of stock-based compensation and systemic risk using SRISK as a key dependent variable. I also use Marginal Expected Shortfall (MES) for the robustness test in columns 3 and 4. I define the stock-based compensation measure as the ratio of stock-based compensation (RSBIN) and determine it as the dollar amount of stock-based compensation including stock options and stock grants over the dollar amount of total compensation. All independent variables are lagged. MB is a measure of Market-to-book ratio, STD is volatility, Size is the natural log of total asset, and Sizesq is the squared value of the natural log of total asset. I indicate whether I use firm fixed effect and time fixed effect in the table. The sample period runs from 2000 to 2012. Please see Table 1 and relevant section in the paper for details on the definitions and determination of all variables utilized in the regressions. Standard errors in parentheses. ***, ** and * indicate significance at the 1%, 5% and 10% levels, respectively.
(1) (2) (5) (6) (7) (8)
VARIABLES SRISK SRISK MES MES SRISK SRISK
MB_lag 1.490 0.000579** -1.449
(2.548) (0.000) (1.138)
STD_lag 0.000424*** 7.07e-10 0.000722***
(0.000) (0.000) (0.000)
Size_lag -58810*** -2.112*** -30000***
(2,641.161) (0.240) (3,539.824)
Sizesq_lag 3157*** 0.0997*** 1616***
(130.221) (0.012) (182.009)
RSBIN_lag 4719*** 3399*** 0.230*** 0.198*** 7073*** 5496*** (645.733) (582.400) (0.053) (0.053) (1,071.410) (936.670) Constant 1556** 254236*** 3.264*** 14.13*** -2019*** 127175***
(702.949) (13,920.503) (0.058) (1.264) (688.555) (16,790.198) Firm
Fixed Effect
Yes Yes Yes Yes No No
Time Fixed Effect
Yes Yes Yes Yes No No
Obs. 4,021 4,021 4,021 4,021 4,021 4,021
R-squared 0.158 0.327 0.567 0.579
Table 5.3. SRISK and the Use of Stock Options, Stock grants, and Cash Bonus
This table reports the regression estimates of the relation between the ratios of stock options (RSO), stock grants (RSG), and cash bonus (RBP) and systemic risk using SRISK as a key dependent variable. The ratio of stock options is defined as the dollar amount of stock options in compensation package over the dollar amount of total compensation. The ratio of stock grants is defined as the dollar amount of stock grants in compensation package over the dollar amount of total compensation. The ratio of cash bonus is defined as the dollar amount of cash bonus in compensation package over the dollar amount of total compensation. All independent variables are lagged. MB is a measure of Market-to-book ratio, STD is volatility, Size is the natural log of total asset, and Sizesq is the squared value of the natural log of total asset. I indicate whether I use firm fixed effect and time fixed effect in the table. The sample period runs from 2000 to 2012. Please see Table 4.1 and relevant section in the paper for details on the definitions and determination of all variables utilized in the regressions. Standard errors in parentheses ***, ** and * indicate significance at the 1%, 5% and 10% levels, respectively.
(1) (2) (3) (4) (5) (6) (7)
Variables SRISK SRISK SRISK SRISK SRISK SRISK SRISK
M2B_lag 1.193 1.693 1.462 1.251
(0.641) (0.527) (0.572) (0.627)
STD_lag 65.80*** 59.83*** 64.37*** 65.53***
(0.000) (0.000) (0.000) (0.000)
Size_lag -60571*** -60623*** -60614*** -60484***
(0.000) (0.000) (0.000) (0.000)
Size2lag 3271*** 3268*** 3287*** 3269***
(0.000) (0.000) (0.000) (0.000)
RSO_lag 4776*** 4373*** 4650***
(0.000) (0.000) (0.000)
RSG_lag 2782*** -501.8 323.7
(0.006) (0.586) (0.745)
RBP_lag 13.04 741.6 2714*
(0.993) (0.589) (0.055) Constant -1.9e+06*** -80416 -1.5e+06*** 140583 -1.7e+06*** 120844 -163737
(0.000) (0.689) (0.000) (0.466) (0.000) (0.554) (0.428) Firm
Fixed Effect
Yes Yes Yes Yes Yes Yes Yes
Time Fixed Effect
Yes Yes Yes Yes Yes Yes Yes
Obs. 4,021 4,021 4,508 4,508 4,021 4,021 4,021
R-squared 0.157 0.321 0.134 0.295 0.143 0.310 0.322
Table 5.4. Marginal Expected Shortfall (MES) and the Use of Stock Options, Stock Grants, and Cash Bonus
This table reports the regression estimates of the relation between the ratios of stock options (RSO), stock grants (RSG), and cash bonus (RBP) and systemic risk using MES as a key dependent variable. MES is the marginal expected shortfalls of a stock given that the market return is below its 5th-percentile. The ratio of stock options is defined as the dollar amount of stock options in compensation package over the dollar amount of total compensation. The ratio of stock grants is defined as the dollar amount of stock grants in compensation package over the dollar amount of total compensation. The ratio of base salary is defined as the dollar amount of base salary in compensation package over the dollar amount of total compensation. All independent variables are lagged. MB is a measure of Market-to-book ratio, STD is volatility, Size is the natural log of total asset, and Sizesq is the squared value of the natural log of total asset. I indicate whether I use firm fixed effect and time fixed effect in the table. The sample period runs from 2000 to 2012. Please see Table 1 and relevant section in the paper for details on the definitions and determination of all variables utilized in the regressions. Standard errors in parentheses. ***, ** and * indicate significance at the 1%, 5% and 10% levels, respectively.
(1) (2) (3) (4) (5) (6) (7)
Variables MES MES MES MES MES MES MES
MB_lag 0.000624*** 0.000640*** 0.000625*** 0.000577**
(0.000) (0.000) (0.000) (0.000)
STD_lag -7.01e-11 1.33e-09 5.30e-10 7.59e-10
(0.000) (0.000) (0.000) (0.000)
Size_lag -2.169*** -1.997*** -2.166*** -2.109***
(0.240) (0.222) (0.240) (0.241)
Sizesq_lag 0.103*** 0.0941*** 0.103*** 0.0995***
(0.012) (0.011) (0.012) (0.012)
RSO_lag 0.162*** 0.161*** 0.195***
(0.056) (0.055) (0.059)
RSG_lag 0.137* 0.0420 0.208**
(0.080) (0.080) (0.090)
RBP_lag -0.130 -0.125 -0.000879
(0.125) (0.124) (0.128) Constant 3.353*** 14.43*** 3.345*** 13.65*** 3.385*** 14.40*** 14.11***
(0.052) (1.263) (0.056) (1.188) (0.052) (1.265) (1.271) Firm
Fixed Effect
Yes Yes Yes Yes Yes Yes Yes
Time Fixed Effect
Yes Yes Yes Yes Yes Yes Yes
Obs. 4,021 4,021 4,508 4,508 4,021 4,021 4,021
R-squared 0.566 0.578 0.563 0.574 0.565 0.577 0.579