1314
Model Improvement Through Comprehensive
Preprocessing For Loan Default Prediction
Ahmad Al-qerem, Ghazi Alnaymat, Mays AlhasanAbstract: for financial institutions and the banking industry, it is very crucial to have predictive models for their financial activities, as they play a major role in risk management. Predicting loan default is one of the critical issues that they focus on, as huge revenue loss could be prevented by predicting customer’s ability to pay back on time. In this paper, different classification methods (Naïve Bayes, Decision Tree and Random Forest) are being used for prediction, comprehensive different pre-processing techniques are being applied on the data set, and three different feature extractions algorithms are being used to enhance accuracy and performance. Results are compared using F1 accuracy measure, and improvement was over 3%.
Keywords: Classification, Pre-processing, Prediction, Features selection, Generic algorithm, PSO algorithm, Naïve Bayes, decision tree, SVM, Random Forest.
——————————◆——————————
I.
INTRODUCTION
A banking institution can be defined as a financial organization that accepts deposits and convey them into different lending activities. Banks provide accepting deposits services and variety of loan types besides basic investment products. Accepting deposits from the public is the main function in order to use this capital as loans for burrowers. Major functions of a bank can be summarized as follows: Primary functions which consist of accepting deposits (savings, fixed, current), and Granting loans and advances. Secondary functions, which consist of agency functions and general utility functions [1]. Loans as a bank service is one of the main value propositions financial institutions provide and charging interest rate is one of the main revenue streams [2]. Financial institutions provide loans to borrowers (customers) with the promise that they will pay it back; therefore, there is no real guarantee that they will pay back the loan, and if they stop making loan payments, the profit reflected from interest rate of the loan will be lost. It is very critical for financial institution to accurately estimate the riskiness level of borrowers in order to determine their eligibility for loans and the appropriate interest rate. Although credit measurement criteria has been modified and advanced through the years, it is still a high risk, consequently, it’s the most studied and researched area in the banking industry. Loan are paid back according to agreed terms and conditions in the promissory note, and failing to do so is known as “Loan default”. Loan default prediction relies on analysis techniques that utilize current and historical information, behavior of credit customer, loan and settlement information to be able to predict the customer’s ability to pay back the loan on time, in addition to accurately measure bank profitability. In this paper we aim at enhancing classification efficiency and accuracy through the application of intensive data preprocessing techniques, and applying three features selection algorithms: Information Gain (IG), Genetic Algorithm (GA) and Particle Swarm Optimization (PSO) prior to model building, then use 3 classifiers: Naïve Bayes, Decision Tree and Random Forest.
This paper is organized as follows: section II provides literature review. Section III explains our approach and methodologies, and an elaboration of data, preprocessing techniques, models and validation measures. Results are showed in section IV and section V is the conclusion of this paper. Finally references used in this paper are listed at the end.
II.
LITERATURE REVIEW
According to Angelini et al. [3]; Neural Networks (NNs) are reliable classifiers to design prediction models. They used two NNs approaches: Feed-forward Neural Network with ad-hoc connections and Feed-forward Neural Network with classical topology, using dataset of small business banks in Italy. Both approaches produced high prediction accuracy models with low error. Archana et al. [8] applied Decision Tree (DT), Support Adaptive Boosting Model (ABM), Vector Machine (SVM), Linear Regression (LR), Neural Network (NN) and Random Forest (RF) algorithms for build loan predictive model on a banking data from UCI machine learning data repository, and showed that SVM had the best accuracy, but low run time performance, and tuned it to only incorporate most important features. In [4], it was demonstrated that support vector machine SVM can be used efficiently for credit rating classification in the banking industry, and SVM predicting accuracy may increase when increased dataset sample is used, and feature selection approach applied or normal correlation significant test. But using multiple discriminate analysis (MDA) showed overfitting, and although it has the lowest training errors, testing accuracy was unacceptable. Yu Jin and Yudan Zhu [7] applied different attribute selection methodologies: Random Forest and Correlation Matrix in the model preparation stage to determine the top attributes that determine loan default, and used different data mining classification techniques for prediction model building; Decision Tree (DT), Neural Network (NN) and Support Vector machine (SVM) and concluded that SVM showed best performance. Amira Hassan and Ajith Abraham [5] used different algorithms with ensemble methods to build a loan default prediction model; scaled conjugate gradient backpropagation (SCG), Levenberg-Marquardt algorithm (LM), and One-step secant backpropagation (OSS), and applied different filtering methodologies on dataset then used different parameters for comparison. They concluded that Levenberg-Marquardt algorithm (LM) with PLs filter produced the best model. M.V. Reddy and B. Kavitha [6] showed that using ___________________________
• Ahmad al-qerem : Zarqa University, Computer
Science Dept., [email protected]
• Ghazi Alnaymat : Princess Sumaya University for Technology, King Hussein School of Computing
Sciences, [email protected].
• Mays Alhasan : Princess Sumaya University for Technology, King Hussein School of Computing
1315 Neural Networks through attribute relevance analysis to build a
prediction model increases the speed of Neural Network and feasible accuracy. The above researches focused on using different classification models and compared between them, or added features selection technique to improve prediction, while in this paper we used various preprocessing techniques, multiple classification models and multiple features selection algorithms to cover more than one aspect that might impact prediction accuracy and performance.
III. APPROACH
AND
METHODOLOGY
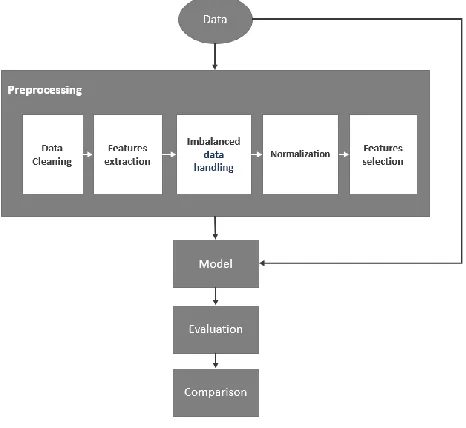
Data pre-processing is considered a significant and crucial initial step in data analysis and data mining projects, as the output of this stage is inputted to the model to obtain final results, therefore, data preprocessing impacts not only the accuracy of the model, but also the performance and efficiency [9]. Our model involved a thorough exploration of data, and application of multiple preprocessing techniques prior to classification stage. Once the data is tuned, three different classification algorithm models will be used to predict loan default, results of models will be compared with each other, and with prediction results of the same model prior to data preprocessing. Figure 1 illustrates our approach.
Fig. 1. Approach
A. Data Collection
The data set that is being used for this paper is a loan data set from lending club, with 145 features and around 43k records. Data includes loan info, e.g. amount, purpose, interest rate and instalments. customer info, e.g. demographic, employment, DTI, FICO and credit lines. customer’s behavior info, e.g. revolving balance, revolving utilization, delinquency and payments.
B. Data Pre-processing
This section presents the steps considered for preprocessing stage.
1) Data Cleaning.
The following data cleaning techniques were applied on the data set:
• Attributes with almost null values were deleted. • Attributes with unique values or only one value were deleted.
• Unstructured attribute with long free text were removed at this stage.
• Empty rows were removed.
• “loan status” attribute was used to extract the “loan status” class attribute, and “credit requirement” attribute that indicates whether the borrower meets credit policy requirements or not.
• Date attributes were used for features extraction, where new features were created according to numbers of days between the date and current date’s date.
• “xx” at the end of “zip code” attribute was replaced to “00”.
• “emp length” attribute was transformed from categorical values (1 year) to numerical values (1), 1 was assigned to “< 1 year” value as records have similar behavior of “1 year” in relevance to the class attribute and 0 was assigned to “n/a”.
• Null values in our dataset were handled using imputation techniques where numeric missing data were replaced with 0, categorical with “none” and date missing values were replaced with current date’s date.
After applying the different techniques mentioned above, the original dataset was reduced to 46 features.
2) Imbalanced Data Handling
Imbalanced data is a common machine learning issue where aggregation of instances in one class is significantly more than the total number of instances of the other class, which makes the classifier more biased towards the larger class. Oversampling based approach is one of the commonly used methodologies to overcome this issue [15]. In this paper Synthetic Minority Over-sampling (SMOTE) approach was implemented to increase minority class 100% using k = 2 of K-Nearest Neighbors.
3) Data Normalization
Data normalization is used to eliminate the unit of measurement of data, for easier data comparison, and it usually means to scale features to have values between 0 and 1. Data normalization is a process that reduces data redundancy [18].
4) Features Selection
Classification efficiency, speed and precision can be improved by decreasing features space, and noise features can be eliminated as well. Information gain is one of the commonly used features selection methodologies that selects key features from the data set, and deletes dispensable once [16]. IG measures the level of “information” a feature provides about the class using “Entropy” measure, where entropy is calculated as follows:
Entropy = − 𝑝𝑘 log2 𝑝𝑘
𝑝𝑘: The proportion of instances belonging to class 𝑘 (𝐾 = 1,…,𝑘), and 0log2 0 = 0.
When applying IG; features with low entropy had better ranking, and top ten features were selected to be used in the classification stage.
1316 is easy to implement but it is computationally intensive, and a
very powerful methodology that has been used in many fields including features reduction; by removing irrelevant and noisy features from the original dataset, and keeping only important and relevant features [12]. When applying PSO; data features space was reduced to ten features. These three features selection approaches were applied independently on the preprocessed dataset prior to classification, and classification efficiency improvement was calculated and compared at the end.
C. Models Construction and Validation
In this section we will briefly define the different data mining classification methodologies used in this paper, and highlight cross validation evaluation criteria used to compare results in the following section.
1) Naïve Bayes
A supervised data mining classification technique that assumes independency among predictors, has less computational complexity and memory requirements, good performance and prediction accuracy [10].
2) C4.5 Algorithm
A supervised decision tree-based classifier with good performance and accuracy, which depends on information gain and gain ratio when constructing the decision tree. Pruning is proposed for this technique to avoid over fitting [11]. In this paper we built two models using C4.5 decision tree; unpruned tree and pruned tree.
3) Random Forest
Known as random decision tree as well, is a prediction technique for classification and regression problems that achieves the best possible solution by constructing multiple uncorrelated decision trees, and uses majority voting for the final result [13]. It is robust to outliers and noise, has good prediction accuracy and does not overfit.
Models Validation
10-folds cross validation was used to evaluate classification models. Using this methodology, the data is randomly divided into ten sets of data; nine are used as training set, and the tenth is reserved for testing. This process is iterated ten times with different training set. In figure 2 it is demonstrated how cross validation works.
Fig. 2. Cross Validation
Then precision, recall and F1 were calculated for each model and used as evaluation measures. These measures are calculated as follows:
IV.
RESULTS
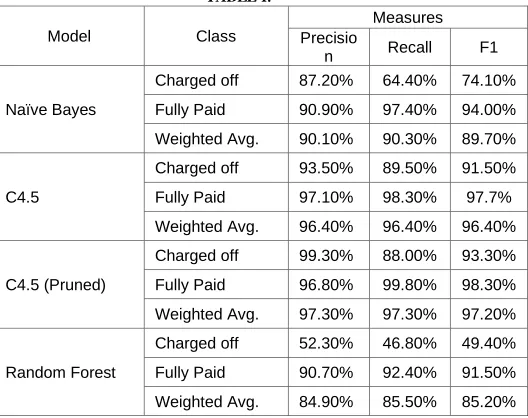
Four classification model were built; Naïve Bayes, unpruned C4.5 decision tree, pruned C4.5 decision tree and Random forest. Each one of these models were run four times and evaluation measures were recorded. In the first iteration; models used unprocessed data, and the other three used processed data with three different features selection algorithms. Evaluation measures of used models using unprocessed data set are shown in table 1 below.
TABLE I.
Model Class
Measures Precisio
n Recall F1 Naïve Bayes
Charged off 87.20% 64.40% 74.10% Fully Paid 90.90% 97.40% 94.00% Weighted Avg. 90.10% 90.30% 89.70%
C4.5
Charged off 93.50% 89.50% 91.50% Fully Paid 97.10% 98.30% 97.7% Weighted Avg. 96.40% 96.40% 96.40%
C4.5 (Pruned)
Charged off 99.30% 88.00% 93.30% Fully Paid 96.80% 99.80% 98.30% Weighted Avg. 97.30% 97.30% 97.20%
Random Forest
Charged off 52.30% 46.80% 49.40% Fully Paid 90.70% 92.40% 91.50% Weighted Avg. 84.90% 85.50% 85.20%
Fig. 3. Unprocessed data meausres.
Evaluation measures of Naïve Bayes, C4.5 decision tree (unpruned), C4.5 decision tree (pruned) and Random forest are shown in table2, table3, table4 and table 5 respectively. Where IG, GA and PSO algorithm were used as feature selection methodologies for each classifier.
TABLE II.
Model Algorithm Class
Measures Precisio
n Recall F1
Niave Bayes
Info Gain
Charged off 99.50% 64.80% 78.50% Fully Paid 88.80% 99.90% 94.00% Weighted
Avg. 91.60% 90.70% 89.90%
PSO
Charged off 99.20% 64.10% 77.90% Fully Paid 88.60% 99.80% 93.90% Weighted
Avg. 91.40% 90.40% 89.70%
Generic
Charged off 99.50% 64.80% 78.50% Fully Paid 88.80% 99.90% 94.00% Weighted
1317 TABLE III.
Model Algorithm Class
Measures Precisio
n Recall F1
C4.5
Info Gain
Charged off 96.60% 95.80% 96.20% Fully Paid 98.50% 98.80% 98.60% Weighted
Avg. 98.00% 98.80% 98.00%
PSO
Charged off 97.40% 95.80% 96.60% Fully Paid 98.50% 99.10% 98.80% Weighted
Avg. 98.20% 98.20% 98.20%
Generic
Charged off 96.60% 95.80% 96.20% Fully Paid 98.50% 98.80% 98.60% Weighted
Avg. 98.00% 98.00% 98.00% Fig. 5. C4.5 Decision Tree.
TABLE IV.
Model Algorithm Class
Measures Precisio
n Recall F1
C4.5 Pruned
Info Gain
Charged off 99.10% 96.00% 97.60% Fully Paid 98.60% 99.70% 99.20% Weighted
Avg. 98.70% 98.70% 98.70%
PSO
Charged off 99.40% 95.60% 97.40% Fully Paid 98.40% 99.80% 99.10% Weighted
Avg. 98.70% 98.70% 98.70%
Generic
Charged off 99.10% 96.00% 97.60% Fully Paid 98.60% 99.70% 99.20% Weighted
Avg. 98.70% 98.70% 98.70% Fig. 6. C4.5 Decision Tree (Pruned).
TABLE V.
Model Algorithm Class
Measures Precisio
n Recall F1
Rando m Forest
Info Gain
Charged off 98.50% 85.90% 91.80% Fully Paid 95.20% 99.50% 97.30% Weighted
Avg. 96.10% 95.90% 95.90%
PSO
Charged off 98.60% 86.70% 92.30% Fully Paid 95.50% 99.60% 97.50% Weighted
Avg. 96.30% 96.20% 96.10%
Generic
Charged off 98.30% 87.10% 92.40% Fully Paid 95.60% 99.50% 97.50% Weighted
Avg. 96.30% 96.20% 96.20%
Fig. 7. Random Forest.
The following matrix contains a calculation of weighted average F1 improvement percentage of each model and feature selection methodology when applying preprocessing techniques
TABLE VI.
Model Feature Selection Algorithm Info Gain PSO Generic
Naïve Bayes 0.20% 0.00% 0.20%
C4.5 1.60% 1.80% 1.60%
C4.5 (Pruned) 1.50% 1.50% 1.50%
Random Forest 10.70% 10.90% 11.00%
Fig. 8. “Wighted Average” F1 improvement.
In most application; misclassifying the minority class (false negative) is a lot more expensive than misclassifying the majority class (false positive). In the context of lending, losing money by lending to a risky borrower who is more likely to not fully pay the loan back is a lot costlier than missing the opportunity of lending to trust-worthy borrower (less risky). The improvement percentage of evaluation measure F1 of “Charged off” class between models prior to preprocessing stage (and without using any features selection algorithm), and models after applying preprocessing techniques on the original data set, and using three different features selection algorithms is shown in table 7 below.
TABLE VII.
Model Feature Selection Algorithm Info Gain PSO Generic
Naïve Bayes 4.40% 3.80% 4.40%
C4.5 4.70% 5.10% 4.70%
C4.5 (Pruned) 4.30% 4.10% 4.30%
Random Forest 42.4% 42.90% 43.00%
Fig. 9. “Charge off” F1 improvement.
V. CONCLUSION
This paper used Naïve Bayes, Decision tree (unpruned and pruned) and Random Forest classifiers to build loan default prediction models. This paper also applied several data preprocessing techniques, and compared between three features selection algorithms: Information Gain, Genetic Algorithm and Particle Swarm Optimization. Applying preprocessing techniques definitely improved prediction of minority class. Improvement varied between the different classifiers. Using features selection algorithms improved model as well, though improvement variation between the three used algorithms was not remarkable. It can be concluded that data preprocessing stage is an important stage when building a classification model, as it has a valuable impact on model accuracy. Applying features selection algorithms is very significant as well when having a large dataset, not only it enhances accuracy but it also improves performance. Future work would involve other classifiers and features selection algorithms, as well using datasets from different banks to investigate if our findings apply on datasets with different nature.
REFERENCES
[1] Gaurav Akrani., Kaylan City Life (20-Apr-2011), Available: http://kalyan-city.blogspot.com/2011/04/functions-of-banks-important-banking.html. [Accessed: 1- Jan- 2019] [2] Businessmodelinnovationmatters (24-Apr-2012),
1318 https://businessmodelinnovationmatters.wordpress.com/2
012/03/24/understanding-the-business-model-of-a-bank/.[Accessed: 1- Jan- 2019]
[3] E. Angelini, A. Roli, and G. di Tollo, “A neural network approach for credit risk evaluation”, The Quarterly Review of Economics and Finance, vol. 48, pp. 733–755, 2008. [4] Chun F. Hsu and H. F. Hung, “Classification Methods of
Credit Rating - A Comparative Analysis on SVM, MDA and RST”, International Conference on Computational Intelligence and Software Engineering, pp. 1–4, 2009. [5] Amira Hassan and Ajith Abraham, “Modeling Consumer
Loan Default Prediction Using Ensemble Neural Networks”, International Coference on Computing, Electrical and Electronic Engineering (ICCEEE), pp. 719 – 724, 2013.
[6] M.V. Jagannatha Reddy and B. Kavitha, “Neural Networks for Prediction of Loan Default Using Attribute Relevance Analysis”, International Conference on Signal Acquisition and Processing, pp. 274 – 277, 2010.
[7] Yu Jin and Yudan Zhu, “A Data-Driven Approach to Predict Default Risk of Loan for Online Peer-to-Peer (P2P) Lending”, Fifth International Conference on Communication Systems and Network Technologies, pp. 609 – 613, 2015.
[8] Archana Gahlaut, Tushar and Prince Kumar Singh, “Prediction analysis of risky credit using Data mining classification models”, 28th International Conference on Computing, Communication and Networking Technologies (ICCCNT), pp. 1-7, 2017.
[9] Li Xiang-wei and Qi Yian-fang, “A Data Preprocessing Algorithm for Classification Model Based On Rough Sets”, 2012 International Conference on Solid State Devices and Materials Science, pp. 25-29, 2012.
[10] Kalyan Netti and Y Radhika, “A novel method for
minimizing loss of accuracy in Naive Bayes classifier”, IEEE International Conference on Computational Intelligence and Computing Research (ICCIC), pp. 1-4, 2015.
[11] Z. Xiaoliang et al., “Research and Application ofthe improved Algorithm C4.5 on Decision Tree”, International Conference on Test and Measurement, pp. 184 – 187, 2009.
[12] Afsaneh Mahanipour and Hossein Nezamabadi-pour,
“Improved PSO-based feature construction algorithm using Feature Selection Methods”, 2nd Conference on Swarm Intelligence and Evolutionary Computation (CSIEC), pp. 1-5, 2017.
[13] Raul Eulogio, ORACLE + Data Science (2017, Aug, 12),
Available:
https://www.datascience.com/resources/notebooks/rando m-forest-intro. [Accessed: 2- Jan- 2019]
[14] M. Bentlemsan et al., “Random Forest and Filter Bank Common Spatial Patterns for EEG-Based Motor Imagery Classification”, th International Conference on Intelligent Systems, Modelling and Simulation, pp. 235 – 238, 2014.
[15] Chioka (2013, Aug, 30), Available:
http://www.chioka.in/class-imbalance-problem/. [Accessed: 2- Jan- 2019]
[16] Hong Zhang, Yong-gong Ren and Xue Yang, “Research
on Text Feature Selection Algorithm Based on Information Gain and Feature Relation Tree”, 10th Web Information System and Application Conference, pp. 446 – 449, 2013.