Scholarship@Western
Scholarship@Western
Electronic Thesis and Dissertation Repository
8-31-2017 10:30 AM
Analysis of Framing Failures in Wood-Frame Residential Roofs
Analysis of Framing Failures in Wood-Frame Residential Roofs
Under Wind Load
Under Wind Load
Sarah A. Stevenson
The University of Western Ontario
Supervisor Dr. Greg Kopp
The University of Western Ontario Joint Supervisor Dr. Ayman El Ansary
The University of Western Ontario
Graduate Program in Civil and Environmental Engineering
A thesis submitted in partial fulfillment of the requirements for the degree in Master of Engineering Science
© Sarah A. Stevenson 2017
Follow this and additional works at: https://ir.lib.uwo.ca/etd
Part of the Structural Engineering Commons
Recommended Citation Recommended Citation
Stevenson, Sarah A., "Analysis of Framing Failures in Wood-Frame Residential Roofs Under Wind Load" (2017). Electronic Thesis and Dissertation Repository. 4851.
https://ir.lib.uwo.ca/etd/4851
This Dissertation/Thesis is brought to you for free and open access by Scholarship@Western. It has been accepted for inclusion in Electronic Thesis and Dissertation Repository by an authorized administrator of
i
Abstract
Wood-frame residential roof failures are among the most common and expensive types of
tornado damage. Hip roofs are commonly understood to be more resilient during extreme
wind in relation to gable roofs. However, inspection of damage survey data from recent
tornadoes has revealed a previously unstudied failure mode in which hip roofs suffer partial
failure of the framing structure. This research focuses on proving the concept of framing
failures in hip roofs. Evidence of partial framing failures and statistics of their occurrence
are explored and discussed, and common roof design and construction practice is reviewed.
Two-dimensional finite element models are developed to estimate the element-level load
effects on hip roof trusses and stick-frame components. Following model development to
estimate the maximum demand on the framing elements, the elements’ capacities are
estimated. The likelihood of failure in each member is defined based on relative
demand-to-capacity ratios. Trussed and stick-frame structures are compared to assess the relative
performance of the two types of construction. The present analyses verify the common
understanding that toe-nailed roof-to-wall connections are likely to be the most vulnerable
elements in a wood-frame roof. However, the results also indicate that certain framing
members and connections display significant vulnerability under the same wind uplift, and
the possibility of framing failure is not to be discounted. Furthermore, in the case where
the roof-to-wall connection uses hurricane straps, certain framing members and joints
become the likely points of failure initiation. The analysis results and damage survey
observations are used to expand the understanding of wood-frame residential roof failures,
as they relate to the Enhanced Fujita Scale, and provide assessment of potential gaps in
residential design codes.
Keywords
Wood-Frame Structures, Finite Element Modeling, Tornado Damage, Enhanced Fujita
Scale, Hip Roofs, Metal Plate Connected Trusses, Prescriptive Design, National Building
ii
Acknowledgements
Foremost, I would like to express my sincere gratitude to my advisors, Dr. Greg Kopp and
Dr. Ayman El Ansary. I am thankful to them for their continuous support, patience, and
advice. Their complementary expertise has enabled this research, and I have grown
personally from working with each of them. The insightful, constructive feedback and
warm encouragement I have received from Dr. Kopp and Dr. El Ansary has inspired me to
continue pursuing my goals and challenging myself, and they have set a tremendous
example of collaboration which I feel very fortunate to continuously benefit and learn from.
I would also like to acknowledge Dr. David Prevatt, not only for providing the data to
enable this work in the first place, but additionally for his encouragement and the engaging
discussions we shared during our short time together at ACWE13. The technical assistance
and advice of Dr. David Henderson and Dr. Rakesh Gupta, and the oversight of Mr. Gero
Michel and Mr. Paul Kovacs is also gratefully acknowledged.
This work was funded by NSERC under the Collaborative Research and Development
Grant titled, “Linking hazard, exposure and risk across multiple hazards,” as well as by the
Ontario government through the Queen Elizabeth II Graduate Scholarships in Science and
Technology. I would also like to offer my special thanks to the Canadian Wood Council
for their financial support and recognition through the Catherine Lalonde Memorial
Scholarship. I sincerely hope that I have honored Mrs. Lalonde’s outstanding legacy.
On a personal note, I would like to show my heartfelt appreciation for my friends and
family. My “Western family”; Emilio, Rahul, Anant, Cheng, Matt W., and many others,
have made my graduate experience to date as enjoyable as possible. Their continued
friendship and enthusiasm has boosted me up several steep learning-curves.
To my partner, Matthew Lynch, I owe a very important debt for his enormous support and
the countless hours spent talking through my research and reviewing my thesis, being my
biggest/only fan at my volleyball games, and encouraging me through both good and bad
days. I thank Matt, my parents Lori and Peter, and my sister Amy for their loving support
iii
Contents
Abstract ... i
Keywords ... i
Acknowledgements ... ii
Contents ... iii
List of Tables ... vi
List of Figures ... viii
1 Introduction ... 1
Background ... 1
Observations from Tornado Damage Surveys ... 2
1.2.1 Tornado Intensity Estimation using the Enhanced Fujita Scale ... 2
1.2.2 Survey Data from Recent Tornadoes ... 5
Wood-Frame Residential Roofs ... 16
1.3.1 Trussed-Roof Construction ... 17
1.3.2 Stick-Frame Construction ... 19
1.3.3 Roof Shapes and Performance Under Wind Loads ... 20
Past Research on Residential Roof Performance ... 22
1.4.1 Experimental Studies ... 22
1.4.2 Finite Element Analysis of Wood Frame Residential Roofs ... 23
1.4.3 Experimental Data for Truss Model Validation... 31
1.4.4 Finite Element Modeling of Stick-Frame Construction... 33
Objectives ... 35
Research Approach ... 36
2 Development and Validation of a Numerical Truss Model ... 37
iv
2.1.1 Truss Validation Models ... 39
2.1.2 Truss Deflection Validation ... 41
2.1.3 Force Envelope Validation ... 46
Model of Truss Under Uplift ... 55
Conclusions ... 60
3 Demand-to-Capacity Model of Hip Roof Trusses under Wind Uplift ... 62
Element Capacity Calculations ... 63
3.1.1 Member Capacity ... 63
3.1.2 Connection Capacity ... 65
3.1.3 Commentary on Current Design Practice ... 67
Demand-Capacity Analysis ... 68
Conclusions ... 72
4 Demand-to-Capacity Analysis of Stick-Frame Roofs... 74
Design of Stick-Frame Roofs... 74
D/C Analysis of Stick Frame Members and Joints ... 76
4.2.1 Analysis of Demand on Stick-Frame Member ... 76
4.2.2 Capacity Estimation for Stick-Frame Elements ... 78
4.2.3 D/C Analysis of Jack Rafter ... 79
Additional Discussion of Observed Stick-Frame Failures... 79
Conclusions ... 83
5 Conclusions and Recommendations ... 84
Key Findings of the Current Work ... 85
Recommendations for Future Work... 89
References ... 91
v
Appendix B: Initial and Adjusted Wind Load Calculations ... 99
Appendix C: Calculation of Orthotropic Moduli of Elasticity for Truss A2 Members .. 102
Appendix D: Truss A2 Joint Demand under Initial and Updated Uplift ... 103
Appendix E: Truss Joint Capacity Calculations and Minimum Joint Capacities for Truss 2A ... 106
Appendix F: Results of D/C Analysis of Truss A2 with Initial Loading Applied ... 114
Appendix G: Design Notes for Stick-Frame Hip Roof ... 115
Appendix H: Nailed Connection Capacity Calculations ... 116
vi
List of Tables
Table 1-1: DOD descriptions and wind speed estimates for the FR12 DI, as adopted by
Environment Canada (2013) ... 3
Table 1-2: Elastic Ratios for Longleaf Pine Lumber, Obtained from Chapter 4 of (Forest
Products Laboratory, 1999) ... 31
Table 2-1: List of model analog combinations and naming convention. Insertion point
analogs are named as per SAP2000 Insertion Point naming convention ... 39
Table 2-2: Deflection validation of trusses modelled according to experimental program
in Wolfe et al. (1986) – results obtained from trusses which contained overdesigned plate
connections ... 43
Table 2-3: Deflection validation of trusses modelled according to experimental program
in Wolfe and LaBissoniere (1991) – results obtained from trusses of conventional design
... 44
Table 2-4: Comparison of connectivity analogs, based on joint force estimates, from the
CL insertion point models of Truss 3H from FPL-1991... 50
Table 2-5: Comparison of connectivity analogs, based on joint force estimates, from the
BL insertion point models for Truss 6H from FPL-1991 ... 51
Table 2-6: Comparison of insertion point joint force envelopes for the 3H truss from
FPL-1991 ... 52
Table 2-7: Validation of force envelope method by comparing the envelope models
against FPL-1996 data. Note that Truss L3 includes inaccurate readings ... 53
Table 3-1: Material properties and calculated member strengths for truss members using
SPF No. 2 sawn lumber ... 64
Table 3-2:Demand-Capacity ratios and governing failure mode for Truss A2 under 0.57
N/mm uplift ... 71
Table 4-1: Maximum member and joint demand on jack rafter under 0.38 N/mm uplift.
vii
Table 4-2: Member and joint capacity estimates for jack rafter under uplift ... 78
Table 4-3: Member and joint D/C ratios for jack rafter under 0.38 N/mm uplift ... 79
Table A-1: Joint stiffness assignment for Semi-Rigid analog ... 98
Table A-2: External pressure coefficients from Table 27.4-1 in ASCE 7-10 ... 100
Table A-3: Truss A2 joint demand under initial uplift loading ... 104
Table A-4: Truss A2 joint demand under adjusted uplift loading ... 105
Table A-5: Truss A2 minimum joint capacities ... 113
viii
List of Figures
Figure 1-1: Example of roof sheathing failure, corresponding to DOD-4 ... 4
Figure 1-2: Example of roof-to-wall connection failure, corresponding to DOD-6 ... 4
Figure 1-3: Partial hip roof failure observed following EF2 tornado in Angus, Ontario, June 2014. ... 8
Figure 1-4: Hip roof failures in Moore, OK following the EF5 Tornado of May 21, 2013. a) Framing failure of similar, neighboring hip roofs b) Framing failure of steep, stick-frame hip roof c) Hip roof displaying material failure of the wood framing members .... 11
Figure 1-5: West end of tornado damage path following the May 22, 2011 tornado in Joplin, MO; two present study regions are shown by white outlines ... 13
Figure 1-6: Map of Region 1 neighborhood (Sunset Drive) with aerial photography showing the aftermath of the tornado in Joplin, MO ... 14
Figure 1-7: Example of typical hip roof configuration in Region 1, with an aerial photo showing the footprint of the partial failure on the right-hand side of the figure ... 15
Figure 1-8: Partial hip roof failure in Region 2 ... 16
Figure 1-9: Illustration of MPC Truss with Components Labelled ... 18
Figure 1-10: Illustration of Stick-Frame Hip Roof with Components Labelled ... 20
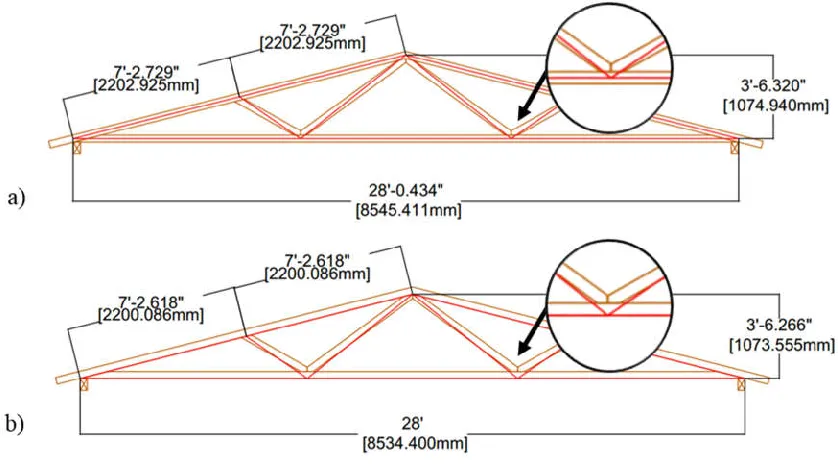
Figure 1-11: Geometric analogs applied to a 3:12 slope Fink truss, using different chord member insertion points: a) Chord Centerline, b) Chord Bottom-Line ... 29
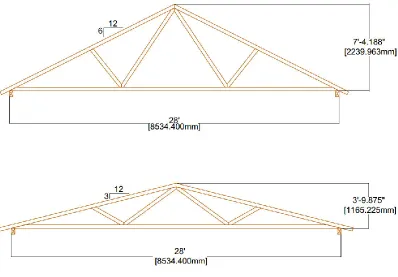
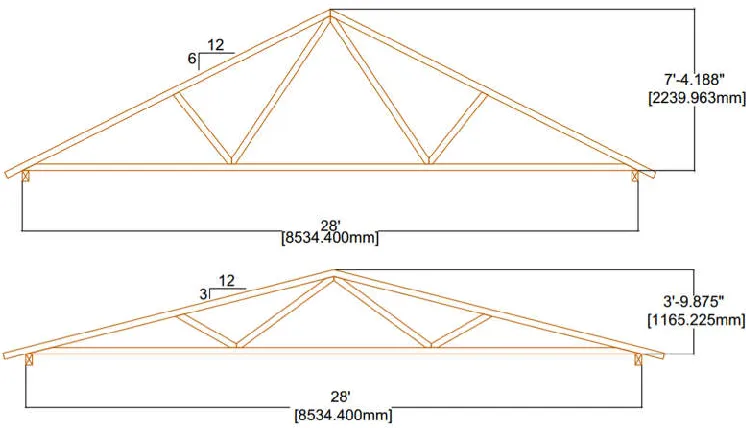
Figure 1-12: Illustration of Fink trusses used in 2-D model validation, based on the 6:12 slope and 3:12 slope truss configurations tested in FPL (1986, 1989, 1991, 1996) ... 32
Figure 2-1: Overview of Fink Trusses used in 2-D Model Validation, based on the 6:12 (upper) and 3:12 (lower) Truss Configurations Tested by (Wolfe, et al., 1986) and (Wolfe & LaBissoniere, 1991) ... 40
ix
Figure 2-3: 6:12 slope trusses tested in FPL-1996, with members labeled and
approximate locations of force data readings shown by location of member labels ... 54
Figure 2-4: Model rendering of full-scale hip roof tested by Henderson et al. (2013) ... 56
Figure 2-5: Dimensioned drawing of hip roof Truss A2 from the full-scale house tested at the Insurance Research Lab for Better Homes ... 58
Figure 2-6: SAP2000 model of Truss A2, with numbered joint labels and lettered member labels ... 58
Figure 2-7: Sample of relative axial force results from the rigid SAP2000 model of Truss A2, under 1.22 N/mm uniform uplift. The blue positive results indicate tension and the red results indicate compression ... 59
Figure 2-8: Sample of relative member moments from the rigid SAP2000 model of Truss A2, under 1.22 N/mm uniform uplift ... 59
Figure 3-1: Half of modeled hip roof truss with MPC joints and members labeled according to truss manufacturer’s drawing package ... 66
Figure 3-2: Schematic of failure locations in Truss A2 based on estimated D/C ratios from Table 11 ... 72
Figure 4-1: Plan-view, dimensioned stick-frame member layout drawings ... 75
Figure 4-2: SAP2000 model of jack rafter under 0.38 N/mm uniform uplift ... 77
Figure 4-3: Failure of stick-frame roof with irregular roof shapes ... 80
Figure 4-4: Partial stick-frame, hip roof failure with ceiling joists intact ... 81
Figure 4-5: Loss of the entire surface of a stick-frame hip roof with intact ceiling joists. 82 Figure A-1: Diagram of Truss A2 under uplift pressure ... 99
Figure A-2: Truss A2 Joint 3 diagram with member TC1 contact area shown ... 106
1
Introduction
Background
Wood-framed houses comprise the highest percentage of housing in North America (Amini
& van de Lindt, 2014; Standohar-Alfano & van de Lindt, 2016). These structures are highly
susceptible to damage from extreme wind events such as tornadoes and hurricanes due to
their light weight and possible weak links in the vertical load path. Residential failures
caused by tornadoes can cause catastrophic damage in densely populated areas, however
current design practice does not include tornado-resistant design due to the low probability
of occurrence for any one building. When these events do occur, they can result in
significant losses (Graettinger, et al., 2014; Changnon, 2009). In fact, it has been reported
that overall losses due to tornadoes are similar in magnitude to those from hurricanes in
the United States (Simmons, et al., 2015). The resilience of houses during extreme wind
events is essential to ensure safety of occupants and minimize damage to internal contents.
Significant work has been completed to date to address commonly observed failure modes
in residential structures, which are primarily related to the roof and wall cladding systems
and the vertical load path between the structural components (van de Lindt, et al., 2013).
Roof cladding systems in North America commonly consist of plywood sheathing fastened
to the roof structure using common wire nails, and topped with asphalt shingles (Canada
Mortgage and Housing Corporation, 2014). These systems fail through pullout of the
sheathing fasteners, resulting in loss of the cladding panels and introduction of these
elements into the wind field as damaging debris (Reed, et al., 1997). The weak link in the
vertical load path is commonly located at the connection between the roof structure and the
top plate of the load-bearing walls. Pullout failure of nailed roof-to-wall connections can
result in removal of the entire roof, leading to collapse of the walls which are left laterally
unbraced. Research over the past few decades has resulted in the invention of hurricane
straps and other methods for improving sheathing performance, holding the roof down, and
strengthening the vertical load path. Observations from post-storm damage surveys
discussed herein have suggested an additional failure mode in which the roof framing
has not been studied in the available work to date, and the conditions under which it may
govern are unknown.
Observations from Tornado Damage Surveys
Damage surveys following destructive wind events offer the opportunity to improve
construction practice and understand the complexity of structural behaviour under
turbulent winds. It is not feasible to directly measure wind speeds due to the sporadic,
highly localized, and intense nature of tornadoes. For this reason, structures and vegetation
are inspected for damage following an event and common failures are analyzed to estimate
the bounds of probable wind speeds (Kopp, et al., 2012). This section reviews the literature
pertaining to damage observations for wood-frame houses following tornadoes.
1.2.1
Tornado Intensity Estimation using the Enhanced Fujita Scale
Because it is not practically feasible to assess tornado intensity directly using wind speed
measurements, tornadoes are classified according to the levels and types of damage they
inflict upon buildings and vegetation. The first standardized method for measuring
tornadoes in this way was proposed by Fujita (1971). The Fujita Scale was used widely for
over 30 years before it received significant updates. Through its use, the Fujita scale was
found to have many limitations leading to inconsistencies in its use and inaccurate wind
speed estimates (Wind Science and Engineering Centre, 2006; Sills, et al., 2014).
In 2006, researchers from Texas Tech University brought together a forum of Fujita scale
users to review and revise it. The Enhanced Fujita (EF) Scale was proposed as a result of
these efforts (Wind Science and Engineering Centre, 2006). The major enhancements to
the scale included improved wind speed estimates and a more comprehensive list of
common structures which can be assessed following a tornado. In 2013, Environment
Canada further modified the EF-Scale to better suit the Canadian context. The present study
will refer to the Canadian version of the EF-Scale for assessment of residential structures.
More information on the Canadian modifications to the scale can be found in (Sills, et al.,
The current version of the EF-Scale provides refined wind speed estimates for 31 categories
of common structures and vegetation, referred to as Damage Indicators (DIs). Under each
DI, the EF-Scale utilizes the concept of Degrees of Damage (DOD). DODs describe the
sequential modes of damage that have been observed to occur in a particular DI. Each DOD
is associated with a minimum, maximum, and expected wind speed. These values represent
the estimated wind speeds required to cause the specified damage. They can be related back
to the EF-Scale wind speeds to estimate the intensity of a tornado, from EF0 to EF5. In the
present study, the DI for one- and two-family residences (FR12) is of particular interest.
DOD descriptions and wind speed estimates are shown for this DI in Table 1-1.
Table 1-1: DOD descriptions and wind speed estimates for the FR12 DI, as adopted
by Environment Canada (2013)
DOD Description of Damage
Wind Speed Estimates [km/h] Lower
Bound Expected Upper Bound 1 Threshold of visible damage 85 105 130 2 Loss of roof covering material (up to 20%), gutters and/or awning; loss of vinyl or metal siding 100 125 155 3 Broken glass in door and windows 125 155 185 4
Uplift of roof deck and loss of significant roof covering material (more than 20%); collapse of chimney; garage doors collapse inward; failure of porch or carport
130 155 185
5 Entire house shifts off foundation 165 195 225 6 Large sections of roof structure removed (more than 50%); most walls remain standing 165 195 230 7 Exterior walls collapsed 180 210 245 8 Most walls collapsed, except small interior rooms 205 245 285 9 All walls collapsed 230 274 320 10 Destruction of engineered and/or well-constructed residence; slab swept clean 265 320 355
The EF-Scale offers a systematic method of assessing tornado intensity, and it helps
investigators discern what fails, or what should fail first, so that unexpected failures can be
easily identified. The FR12 DI covers typical wood-frame houses constructed in Canada
and the United States. In the present study, the DODs of interest are DOD-4 and DOD-6
for residential structures, corresponding to roof sheathing failure and loss of large sections
of the roof structure, respectively. Most past research on roof damage focuses on sheathing
and roof-to-wall connection (RTWC) failures, and it is apparent that the wind speed
failure modes. Figure 1-1 shows an example of typical sheathing failure, and Figure 1-2
shows failure of the RTWC. The current understanding of DOD-6 is limited to research
focused on RTWC failures.
Figure 1-1: Example of roof sheathing failure, corresponding to DOD-4 (Image
provided by Dr. David Prevatt of University of Florida)
Figure 1-2: Example of roof-to-wall connection failure, corresponding to DOD-6
As seen in the shaded row of Table 1-1, DOD-6 describes failure of the RTWC and
subsequent loss of large roof sections, which can occur at an expected wind speed of 195
km/h. This wind speed corresponds to relatively weak EF2 tornadoes (Environment
Canada, 2013). DOD-4 occurs at lower wind speeds; however, loss of a single sheathing
panel can allow for water ingress, which often results in loss of the entire house and its
contents (Sparks, et al., 1994). As discussed in the following sections, gable roofs have
been observed to perform poorly under these modes, especially DOD-6, relative to
neighboring hip roofs of similar construction. In fact, the FR12 listing from the Canadian
EF-Scale notes that for hip-roof homes, the upper-bound wind speeds for DODs 4 and 6
can be assumed. This is counter to the original EF-Scale documentation (Wind Science and
Engineering Centre, 2006) which specifies that the lower bound of DOD-6 is due to
inadequate construction or large overhangs while the upper bound is due to enhanced,
construction such as the use of hurricane straps. The difference between the two versions
of the EF-Scale is a significant point, which warrants further investigation.
1.2.2
Survey Data from Recent Tornadoes
Although the method of forensic investigation is the most appropriate method to date for
assessing tornado intensity, it is limited in that the progression of failure cannot be
observed. Survey data following a major event provides information about the end state of
the components of a structure. Closer inspection of failed members can provide additional
information about state of the structure leading up to the event. If the geographic location
of the failed structure is known, online mapping tools such as Google Earth can also be
used to gain an understanding of what the intact structure looked like. In research, the
ability to make accurate assumptions regarding the initial structure is important for
studying the most likely progression of failure. In experimental work such as that carried
out by Henderson et al. (2013) and in numerical studies (Martin, 2010; Pfretzschner, 2012;
Jacklin, 2013), proper construction is assumed and model structures are designed and
constructed according to code and common practice. This method provides an indication
of how the structure should behave, and may help to understand the conditions or
Residential roof failures are among the most common and expensive types of tornado and
hurricane damage and, thus, have been studied extensively. The density of houses relative
to other structures in any populated area leads to high occurrence of residential failures
during extreme winds and increased risk to neighboring structures due to blowing debris.
The relative vulnerability of residential roofs is additionally important because loss of a
single sheathing panel, which occurs at relatively low wind speeds, can allow for water
ingress. This often leads to loss of the entire structure and its contents due to the heavy
rainfall that accompanies extreme wind events. Sparks et al. (1994) compared insured
losses to observed damage and gradient wind speeds from past hurricanes. Their analysis
indicated a sudden rise in insured losses between 151 km/h and 172 km/h 10-meter mean
wind speeds (64 m/s and 72 m/s 3-second gust speeds). Statistics from damage survey
observations identified the cause of this rise to be failure of the building envelope through
loss of roof sheathing panels and broken windows or doors.
The straight-line wind speeds from Sparks et al. (1994) can’t be directly compared to the
EF-Scale wind speed estimates for FR12, however an important finding of Sparks’s study
showed that over half of insured losses in a major hurricane are due to failure of the
building envelopes of houses. Even though the walls don’t often collapse, serious damage
occurs once the seal provided by the roof or walls has been broken. Repetitive, similar
failures are frequently observed across neighborhoods where a common design was
implemented or the same party was responsible for construction of many houses. This is
often the case in modern subdivisions. Identical failures of similar components suggest that
widespread mitigation is possible; improved design approaches and innovative fasteners
have been recommended to help mitigate the prevalent sheathing and RTWC failure modes
in the work to date.
Damage survey observations have previously led to the identification of important failure
trends in various building components. In particular, residential gable roofs have been the
subject of a number of studies due to their tendency to lift off at the toe-nailed roof-to-wall
connection during a tornado. Hip-roof structures are commonly considered more resilient
has revealed a previously unstudied failure mode in which hip roofs suffer partial framing
failure, presumably initiated at member connections.
1.2.2.1
EF2 Tornado in Angus, Ontario
Following an EF2 tornado that damaged a residential neighborhood in Angus, Ontario on
June 17, 2014, Kopp et al. (2016) evaluated damage to 101 houses and analyzed the
observed failures. Repetitive failures of similar building components were observed across
the study area. The statistics of these failures were presented in Kopp et al. (2016), followed
by fragility analyses of comparable gable and hip roofs. The fragility analyses showed that
for failure of the roof-to-wall connections in a hip roof, the required wind speeds fall above
the range specified in the EF-Scale for DOD-6, i.e., about 50 km/h higher than the wind
speeds required for that in a gable roof. This is greater than one category in the EF-Scale.
Kopp et al. (2016) concluded that when toe-nailed RTWCs are used on gable roofs, the
RTWCs are more likely to fail than the sheathing panels. In hip roofs, depending on the
length of the sheathing fasteners, sheathing loss may be more likely than failure of the
RTWC. Both categories of failure occur at much lower wind speeds in gable roofs. Though
this study confirmed that hip roofs are more resistant to the common failure modes for
residential roofs, failure was still observed in hip roofs or in the hip portions of combination
roofs.
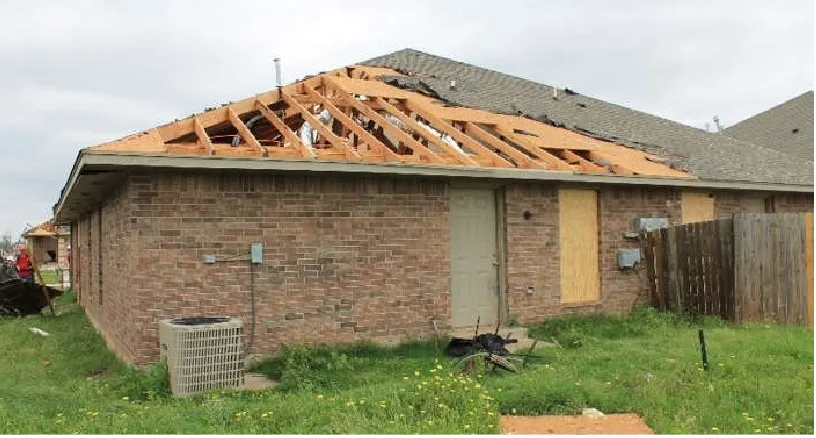
An example of a partial hip roof failure from the Angus tornado is shown in Figure 1-3.
This failure does not appear to have occurred simply as sheathing failure or failure of the
RTWC. At the left corner of the damaged house there is an opening where it appears that
a portion of the roof has been removed. Inside of the opening intact trusses are still visible.
This suggests either that hip trusses near the edge of the roof have failed, or that smaller
framing members making up the corner of the roof have been removed. In either scenario,
partial failure of the roof frame has occurred, though it may have been initiated by failure
of the RTWC at the corner. Several other observed failures which do not clearly fall into
the sheathing or RTWC failure categories will be introduced in the following section,
Figure 1-3: Partial hip roof failure observed following EF2 tornado in Angus,
Ontario, June 2014. (Image provided by Dr. Greg Kopp)
Framing failures in hip roofs may address a gap in the current DOD listing for residential
roofs. Although DOD-6 allows for failures other than that of the RTWC, hip framing
failures - and the wind speeds at which they are likely to occur - have not been studied in
the literature to date. Further evidence for these possible failure modes is examined in the
next section.
1.2.2.2
EF4 and EF5 Tornadoes in the Southern US
Additional data from recent events in the United States have been obtained for examination
in the present research. These data were gathered following destructive tornadoes in the
Southern US, including the Moore, Oklahoma tornado of 2013 (EF5) and the Tuscaloosa,
Alabama (EF4) and Joplin, Missouri (EF5) tornadoes of 2011. They were provided to the
author by Dr. David Prevatt of the University of Florida. A forensic assessment team of
researchers, engineers, and students spent the days following these events surveying the
affected areas and documenting observed damage. Their reports on these tornadoes can be
database provides thousands of images of damage to houses, ranging from sheathing loss
to total destruction.
The Moore, OK tornado was determined to be an EF5 event, with damage ranging from
EF0 to EF5 observed across the path of the tornado. This event killed 24 people and was
estimated to have caused $3 billion of economic loss (Graettinger, et al., 2014). EF0 to EF2
winds typically comprise about 85% of the damage area of a strong EF4 or EF5 tornado,
and so many stages of damage progression could be identified (Graettinger, et al., 2014).
The survey performed following this event has informed subsequent research including
identification of new methods for improved damage surveys, fragility analyses of house
components, and the development of improved laboratory simulations for tornadoes
(Graettinger, et al., 2014). It also led to changes in the Moore, OK building code such that
wood-frame houses have new prescriptive requirements to mitigate up to DOD-6 damage.
The raw database of photos taken following the Moore, Tuscaloosa and Joplin tornadoes
was used in the present study to examine the nature of hip roof failures. Many instances of
partial hip roof failures were identified in the data. As with the findings of the fragility
analyses in Kopp et al. (2016), the observed failures evoked additional questions regarding
the likelihood and conditions under which partial hip roof failures may occur. Select
examples of the observed failures from Moore are shown in Figure 1-4 and discussed
below.
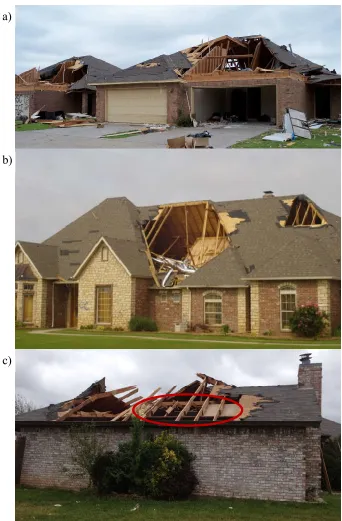
Figure 1-4(a) shows neighbouring hip-roofed homes that exhibit similar failures of the
front face of the roof. The RTWC appears to be intact around the remaining perimeter of
the roof and it is apparent that several members of the roof frame have failed or been
removed, in addition to the sheathing covering this portion. At the right side of the photo
the remaining part of the roof is sagging, which further indicates that the underlying frame
has failed. The houses shown in Figure 1-4 (a) were located along Kyle Drive at the western
edge of Moore, OK. Several houses along this short stretch had similar failures of hip roof
framing. The houses in this area had similar structural configurations and were built around
2006 (Graettinger, et al., 2014). Inspection of the damage photos from this neighborhood
have failed through similar partial failures. In these cases, it appears that the frame failed
at the nailed connections between the members, as no broken lumber is visible. The
following section will present additional statistics and observations from two selected
neighborhoods following the Joplin, MO tornado.
Figure 1-4(b) shows a similar failure to that in 4(a) but of a much steeper roof. The RTWC
appears to be intact, and a large open cavity is visible where both framing members and
sheathing have been removed. Similar to 4(a), it is apparent that this roof did not
exclusively suffer sheathing loss, although the smaller area of sheathing loss at the right
side of the photo should be noted. The lack of visible internal members in the cavity,
especially those supporting the intact opposite face of the roof, strongly suggest that this
roof was built as a stick-frame structure as opposed to one containing prefabricated trusses.
Many of the failed hip roofs in the available data appear to have used stick-framing. The
trussed and stick-frame construction methods will be described in Section 1.3.
Figure 1-4 (c) shows a partial failure of a combined hip/gable roof. This failure is unique
from those shown in Figures 1-4(a) and 1-4(b) because material failure of the wood
members is apparent. The RTWC appears to be intact, with the lower part of the roof having
lost only sheathing on the right side, and framing members in addition to sheathing on the
left. Near the peak of the roof, the frame has failed on both faces. This structure appears to
contain either trusses or stick-framing with robust connections. As indicated on the figure
just above the RTWC, the members were connected or otherwise reinforced using nailed
Figure 1-4: Hip roof failures in Moore, OK following the EF5 Tornado of May 21,
2013. a) Framing failure of similar, neighboring hip roofs b) Framing failure of steep,
stick-frame hip roof c) Hip roof displaying material failure of the wood framing
members (Images provided by Dr. David Prevatt)
a)
b)
Upon inspection of the failures shown in Figure 1-4 and similar damage in the available
photos, it becomes apparent that partial framing failures are another possible, repetitive
mode of failure occurring in hip roofs. When comparing these hip roof failures to nearby
structures from the data, it was determined that framing failures such as those shown in
Figure 1-4 may govern in hip roofs at EF2 wind speeds, rather than RTWC failures or
sheathing loss. It was also noted that the construction of the roof may be important. The
observed stick-frame failures especially suggest that the performance of stick-frame roofs
may need to be distinguished from that of trussed structures in analysis and design, as well
as in the present research.
1.2.2.3
Statistics for Occurrence of Partial Roof Failure
For a complete analysis of the occurrence of partial roof failures, all observed damage
within the DOD-4 and DOD-6 ranges must be categorized further to identify whether the
observed failures are related to the sheathing, RTWCs, or the roof framing. Sorting the data
by neighborhood offers additional information about trends across small regions, compared
to the entire damage track of an event. As mentioned, the survey data provided by the
University of Florida includes a database of photos. Some of these photos include
geographical metadata, however many do not. Additional manipulation of the data, and the
provided damage assessment spreadsheets, is required to allow for mapping of all photos
and locations of rated damage. Preliminary work in this area has focused on the data from
the Joplin, MO tornado of May 22, 2011.
The damage survey data provided from the Joplin tornado includes an Excel spreadsheet
which lists every photo that was used for assessing the event in accordance with the
EF-Scale. The longitude, latitude, and EF-Scale rating at each location was listed, along with
the file and path name for each image. The EF-ratings were assigned by the damage survey
team at the time of the investigation. Using this data to manually create source code for the
.kml file type used by Google Earth, it is possible to map the photos, including those with
no GPS metadata, and label them using color-coded pins to represent the EF-Scale ranking.
A sample from the resulting map is shown in Figure 1-5. This map shows the two areas
analyzed to obtain the preliminary statistics presented herein. These neighbourhoods are
EF3 damage was analyzed because these rankings correspond to the DOD-4 and DOD-6
wind speeds for residential roofs. In the figure, EF1, EF2, and EF3 rankings are represented
by yellow, orange, and red pins, respectively.
Figure 1-5: West end of tornado damage path following the May 22, 2011 tornado in
Joplin, MO; two present study regions are shown by white outlines
Two study areas, outlined in white on Figure 1-5, were analyzed and the occurrence of
different failure modes can be compared across them. The damage photos at the marked
locations in each region were inspected and the perceived mode of failure was noted. This
pass through the data marked each separate residence based on whether the damage
appeared to be wall, RTWC, sheathing, or framing failure. Wall failures corresponding to
DOD-7 were included because the expected wind speeds causing this failure mode falls
under the same EF category as DOD-6. The study areas were selected based on the
characteristics of the houses in each. Region 1, on the left side of Figure 1-5, was found to
contain houses that appeared to be newer, most with steep-sloping hip roofs and large
building footprints. The homes in Region 2 mostly appeared to be older, masonry homes
The results of the present analysis found that in Region 1, 42% of the houses with relevant
damage failed through partial framing failure, while 40% showed signs of failure of the
RTWC. Figure 1-6 shows Region 1 at a smaller scale, including aerial imagery depicting
the aftermath of the tornado. As can be seen, most of the damage in this neighborhood was
limited to the EF2 range, aside from one location on Jessica Drive. Figure 1-7 shows an
example of the steep-sloping hip roofs visible throughout this neighbourhood, with an
aerial image showing how the surface area of the roof was affected by the failure. In many
instances, the largest surfaces of the roof were removed, while parts of the structure
enclosing smaller spaces remained in place. Many of these structures also appeared to be
of stick-frame construction.
Figure 1-6: Map of Region 1 neighborhood (Sunset Drive) with aerial photography
showing the aftermath of the tornado in Joplin, MO (Image provided by Dr. David
Figure 1-7: Example of typical hip roof configuration in Region 1, with an aerial photo
showing the footprint of the partial failure on the right-hand side of the figure (Image
provided by Dr. David Prevatt, Google Earth)
The distribution of failure types in Region 2 is different from that of Region 1; 15% showed
partial failures, while 2%, 22%, and 18% suffered RTWC failure, sheathing failure, and
wall collapse, respectively. This shift could have occurred due to a number of factors;
however, it was noted that many of the houses in Region 2 appeared to be of older
construction than those in Region 1, and had lower-sloping roofs. While this observation
may suggest that roof slope contributes to the occurrence of framing failures, it is not
apparent what other factors may have had an additional impact. For example, the lack of
lateral restraint in older houses may have led to increased numbers of wall collapses, and
aging structures may also be less resistant to debris damage. In the example shown in
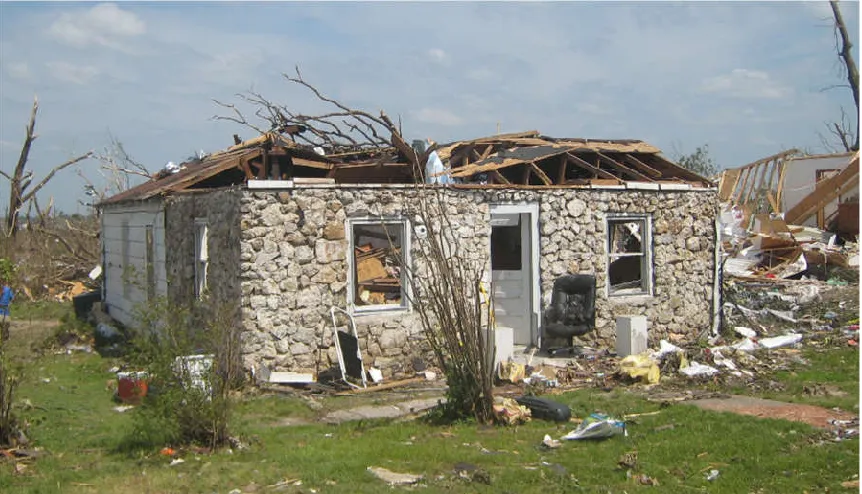
Figure 1-8, partial roof failure occurred. However, this failure may have occurred due to
the tree debris visible on top of the failed roof. Other instances of partial failure in Region
2 were similarly ambiguous, and because Region 2 was downwind of Region 1, debris
likely played a larger role. In both regions, partial failures were found to occur at least as
often as other modes of roof failure. More work is required to obtain a complete set of
statistics on these failures and better define the regional conditions that may contribute to
Figure 1-8: Partial hip roof failure in Region 2 (Image provided by Dr. David
Prevatt).
Wood-Frame Residential Roofs
More than 90% of the residential building stock in North America consists of light-frame
wood construction (van de Lindt & Dao, 2009). By far, wood-frame residential buildings
are the most prevalent in any community, but they are also among the most susceptible to
wind damage. Wood-frame construction in Canada and the US take similar approaches in
that prescriptive or conventional designs are predominant (Canada Mortgage and Housing
Corporation, 2014; van de Lindt, et al., 2007). For the roof structure, these approaches
consist of following documents such as the International Residential Code or Part 9 of the
National Building Code of Canada (NBCC) to determine member size, spacing and
fastener requirements. In Canada, these requirements are taken from tabulated values based
on the design snow loads.
Prescriptive design approaches include additional requirements for buildings located in
regions of higher wind or earthquake risk, which occurs in about 50 locations across the
country. These requirements include ties capable of resisting 3 kN of uplift at the RTWCs,
fortified roof structures. Buildings that fall within the “Extreme” exposure category must
be fully engineered, however there is only one region in Canada (Resolution Island,
Nunavut) which falls into this category for wind. Aside from this single region for wind,
and three regions for earthquake exposure, all new houses in Canada may be constructed
according to prescriptive approaches unless architectural choices lead to exceptions.
Provincial adoptions of the NBCC may impose additional requirements, however most
provinces have either fully or majorly adopted the same provisions as the NBCC in their
provincial building codes (National Research Council of Canada, 2017).
Prescriptive design encompasses both stick-frame and trussed roofs, although the trusses
themselves are required to be designed to handle regional snow loads, and come with site
instructions for care, handling, and installation. Trusses are becoming the predominant
form of new residential roof construction in Canada (Canada Mortgage and Housing
Corporation, 2014), however stick-framing is still used and much of the aging housing
stock consist of stick-frame construction. The two construction methods will be described
in more detail in the following sections. Trussed and stick-frame structures both require
consideration in the present study because both types of roof have been observed to fail in
the available survey data. Ongoing research has identified a number of common design
issues and construction errors that occur throughout North America, and it has become
apparent that many factors must be considered and addressed to significantly mitigate roof
failures. The factors contributing to wood-frame roof vulnerability at present include gaps
in current design practice; these gaps may occur in different forms for trussed and
stick-frame structures. It is also important to note that current design codes specify wind loads
based on straight-line winds only.
1.3.1
Trussed-Roof Construction
Metal-Plate-Connected (MPC) trusses have been used in residential structures in North
America as early as the 1950’s. Today, trussed roofs are constructed using prefabricated
portions of the roof frame which are manufactured in a plant and shipped to site for
assembly. Trusses consist of standard sizes of sawn lumber connected into a certain
configuration. Metal plates with teeth punched out of the surface, and that protrude from
MPC trusses are now implemented in many applications due to efficient production
techniques, increased levels of quality control, ease of erection, and economy. As
previously mentioned, trusses consist of two primary elements: sawn lumber members and
the metal plates that join them.
Figure 1-9 illustrates the parts of a MPC truss and shows the nomenclature used in the
present study. On site, trusses are placed on top of the wall top plate at equal spacing. Roof
sheathing is fastened to the top of the top chords to enclose the roof, and ceiling drywall is
typically fastened directly to the bottom faces of the bottom chord members. In gable roofs,
all trusses in a roof may be identical in shape and configuration, while hip roofs require
progressively taller trusses moving towards the centre of the roof, as well as short jack
trusses placed perpendicular to the outermost full-length trusses to complete the roof slope
at the eaves. For the reader’s reference, Figure 2-4, later in this thesis shows a
3-dimensional model of an entire trussed hip roof, including full-length hip trusses and jack
trusses.
Figure 1-9: Illustration of MPC Truss with Components Labelled
MPC trusses are designed based on a tributary load distribution by companies who
specialize in truss fabrication. Analysis for design is typically carried out using specialized
computer software developed by these companies. Truss design software is commonly
based on the Finite Element (FE) method. However, it is also usually proprietary software
so model assumptions, simplifications to the design method, or any built in
“rules-of-thumb” are not disclosed. The governing bodies for truss design publish procedures and
Truss Plate Institute of Canada (TPIC) are responsible for publishing design and testing
methodology in the US and Canada, respectively. The Wood Truss Council of America
(2002) published a handbook to guide the use and design of MPC trusses. This resource
provides a comprehensive guide and history of MPC trusses.
1.3.2
Stick-Frame Construction
Stick-frame roof structures consist primarily of repetitive, sloped rafters, nailed at the peak
of the roof to the ridge board or hip rafter, and connected at the base of the roof to the wall
top plate. Horizontal restraint that prevents the rafters from kicking outwards under gravity
loads may be provided by the ceiling joists, which also rest on the wall top plate and are
nailed to the rafters, or by horizontal collar ties which connect opposite rafters partway up
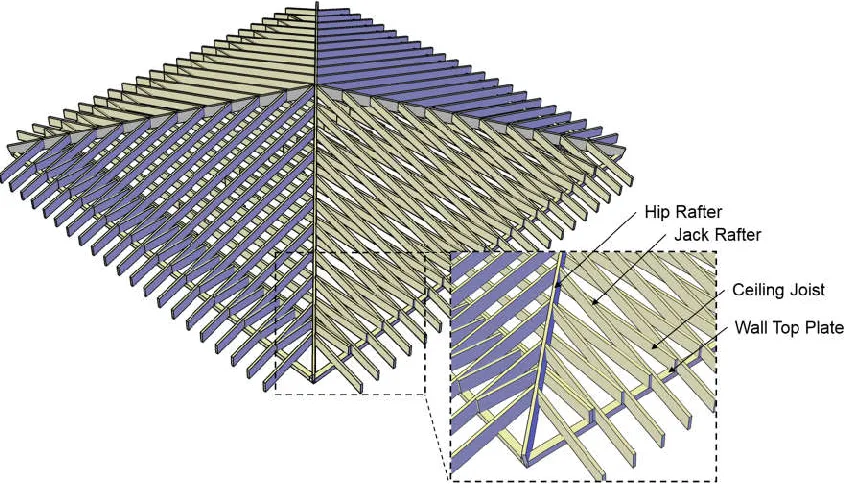
the slope. Figure 1-10 shows a labelled illustration of a stick-frame hip roof structure with
a square footprint. This design was prepared by the author, in accordance with Part 9 of the
NBCC (2010). The Canada Mortgage and Housing Corporation (CMHC) (2014) published
a general guide which describes common residential design in accordance with the same
version of the NBCC. Additional explanation and figures describing recommended roof
construction practices can be found in the CMHC document.
In stick-frame roofs such as that shown in Figure 1-10, the closely-spaced jack rafters are
structural members, while the larger hip rafters simply provide a rigid, continuous member
for the jack rafters to frame into. There is no requirement in the code to join the hip rafters
together at the peak of the roof, and it is expected that the roof sheathing significantly
contributes to load sharing throughout each face of the roof. The connections between the
jack rafters and hip rafters along the ridge typically consist of nails going through the side
of the hip rafter and into the end of the jack rafter, though they can alternatively be
horizontal nailed connections. It is well understood that both end-nailing and
toe-nailing yield weak connections, and strength reduction factors must be applied to these
values during capacity estimation (Canadian Wood Council/Canadian Standards
Association, 2015). At the RTWC, the jack rafter is nailed to the ceiling joist using several
nails perpendicular to the length of each member, and both the jack rafter and the ceiling
Figure 1-10: Illustration of Stick-Frame Hip Roof with Components Labelled
New housing construction in Canada largely consists of trussed structures (Canada
Mortgage and Housing Corporation, 2014); however, stick-framing has prevailed
historically so many existing structures in Canada and the US are still of stick-frame
construction. The significant difference between trussed structures and stick-framing is the
use of engineered trusses versus an entirely prescriptive approach, which is commonly the
case for stick-built homes. In addition, truss framing members are joined by toothed metal
plates, while stick-frame members are connected by nails in specified patterns. In a recent
study, Weston and Zhang (2017) recognized that the use of nailed connections and aging
of structures results in connections that are weaker than the framing members that they
join.
1.3.3
Roof Shapes and Performance Under Wind Loads
Residential roofs can be constructed using a range of shapes and slopes. Many include
dormers or other discontinuities to cover irregular shaped houses. Out of the various roof
shapes possible in wood-frame construction, the most common in North America are gable
with sloping faces on all sides of the roof, as opposed to two sloped faces in the gable roof
shape. Samples of standard hip roof designs are shown in Figure 1-10 and Figure 2-4.
Wind engineering research for residential roofs has historically focused on gable roofs.
They have been observed to fail frequently, and under two predominant modes during
relatively weak tornadoes. Damage surveys following wind storms, and subsequent
research, has frequently identified a disparity in damage between the different geometric
forms of residential roofs (Meecham, 1992). Hip roofs are generally known to perform
better than other roof shapes. Recent work at the University of Western Ontario (Gavanski
& Kopp, 2017) has even suggested that a single DI for residential structures in the
EF-Scale may be inadequate due to significant variations in the estimated failure wind speeds
for different roof shapes, although this has not been quantified in damage surveys.
Several past studies have investigated the superior performance of hip roof homes
(Meecham, et al., 1991; Meecham, 1992), with some more recent works directly
investigating hip roof behaviour with regard to roof sheathing 4) and RTWC
(DOD-6) performance (Kopp, et al., 2016; Henderson, et al., 2013). In 1991, Meecham et al.
(1991) performed wind tunnel testing to further the technical understanding of hip roof
performance and found that there is an important relationship between pressure distribution
and underlying framing configuration in wood-frame roofs. Despite significant differences
between the pressure distributions recorded for the gable and hip roof models, the overall
roof uplift and overturning moments were found to be quite similar. This verified that
preferable aerodynamic geometry is not the only reason for improved performance of hip
roofs.
Meecham’s (1991) results indicated that the orientation of framing members in a hip roof,
relative to the distribution of uplift, provides additional resilience. In contrast, the shape of
the gable roof causes higher localized peak pressures and the orientation of framing
members result in unfavorable load sharing. In addition to this, hip roofs have RTWCs
around their entire perimeters, while gable roofs are only connected to the wall framing
roofs, these factors are generally believed to make hip roofs significantly more resistant to
wind uplift.
Past Research on Residential Roof Performance
Past research on tornado damage to residential structures is largely limited to interpreting
data from field observations. Experimental work to study the progression of failure is not
generally feasible due to the destructive nature of these tests and the risk of debris damage
to test facilities. Computer modelling of tornado failures may be possible, however finite
element modeling for entire houses has been limited to straight-line wind assessments and
the general flexibility response and system effects of the roof structure (Pfretzschner, 2012;
Martin, 2010; Jacklin, 2013). It is valuable to understand the body of existing knowledge
from both experimental and numerical studies to aid model development and validation in
the present research.
1.4.1
Experimental Studies
In practice, residential structures are designed to withstand idealized uniform positive and
negative pressures, yielding equivalent static load effects on the members and components
within prescribed roof zones (Kopp, et al., 2012; Henderson, et al., 2013). However, the
true wind field within a tornado or other extreme wind events is a highly turbulent
environment, affected by many factors including building shape, size, and terrain
roughness conditions. These factors cause the wind loading to vary both in space and time
over the surface of a roof. The simplifications involved in building code designs and
standardized product tests often result in load envelopes that neglect the effects of the
complex wind behaviour. Numerous new facilities and test methods have emerged recently
to assist in assessing the full-scale behaviour of residential structures under realistic wind
loads. These methods also improve the evaluation of damage survey observations by
attempting to replicate observed failures through experiments. Kopp et al. (2012) provides
an overview of current methods and facilities employed to assess the true effects of spatial
and temporal variations in wind loading on low-rise structures.
In addition to emerging full-scale tests and the ability to obtain realistic loading from wind
stiffness and resistance data. Shanmugam, et al. (2009) tested four existing residential
structures in the field to determine the uplift capacities of RTWCs and sheathing units.
Fragility analyses were carried out and the distribution of capacities was identified. From
these results, an analytical model to approximate RTWC behaviour was developed. Other
component-level test results provide validation data for modeling the nonlinear behaviour
of sheathing fasteners (Dao & van de Lindt, 2008) and RTWCs (Morrison & Kopp, 2011),
as well as the overall deflection of entire trusses (Wolfe, et al., 1986). The present research
uses some of the available data for validation of the truss models. It also requires an
in-depth review of past modeling studies to identify appropriate methods for the present
analysis.
1.4.2
Finite Element Analysis of Wood Frame Residential Roofs
To construct an analytical model of any structural system, approximations must be made
carefully to ensure that the numerical model can accurately predict the behaviour of the
structure. The approximation of a structural member in modeling is commonly referred to
as the ‘analog’. In wood-frame structures, the most important analog decisions are
concerned with accurately modeling the size, shape, and location of structural members,
and the behaviour of the connections between members. These analogs have been found to
vary throughout the literature. Other approximations which must be defined in models of
wood-frame houses include support conditions, the behaviour and connection of the roof
sheathing, and the anisotropic material properties of wood. This section presents a review
of the published literature related to the development of finite element models for
wood-framed roofs. The primary focus will be on identifying appropriate methods of modelling
roofs containing MPC trusses, as these structures contain complex elements and
connections relative to that of the stick-frame structure.
Past research has included analytical evaluation of MPC wood joints with varying degrees
of finite element model intricacy. Mackerle (2005) prepared a literature review of past
studies involving finite element analysis in wood research. This review provides 300
references to Finite Element Modeling (FEM) studies related to wood materials, fasteners,
and structures including trusses and frames. The summary of the listed studies provides a
by Mackerle, in addition to several more recent publications, were of importance to the
present work for demonstrating the current state of FEM methods for wood trusses and
providing additional justification for the approaches taken herein.
Many past finite element analyses and experimental studies have focused narrowly on the
detailed sheathing or RTWC behaviour, or on the general flexibility behaviour of the roof
components or the wood-frame house as a system. The present analysis requires
element-level estimates of forces, moments, and capacities within the framing that comprises the
residential roof. Since no other study has modelled wood-framed roofs in this context, a
detailed study of all relevant truss model analogs is carried out to identify the modeling
methods that may be suitable for the present purpose. Several modeling techniques, applied
in the literature for other purposes, are reviewed and the most practical analogs are
identified, validated, and compared, as presented in Chapter 3.
As mentioned, review of past truss and roof modeling studies has suggested that there are
two predominant analog categories to be considered. First, joint connectivity assumptions
define the way that connected members interact with one another at the joints. The methods
employed have varied across the published research and have been found to influence the
flexibility of the truss. The second important analog category is that of member insertion
points. These assumptions reflect the concentric or eccentric behaviour of the framing
members. These categories will be explained further and their use will be discussed in the
following sections, followed by material property considerations and a review of
experimental work on trusses and analytical work on stick-frame structures.
1.4.2.1
Joint Connectivity
Traditionally, MPC trusses are modelled either as trusses having pinned connections with
rotational freedom, or as frames with rigid joints. However, reality most often occurs
between or beyond these two conditions due to semi-rigid joint behavior (Riley, 1998).
Metal truss plates deform and interact with the surface of the connected wood members in
ways that allow local axial, shear, and rotational deformation to occur before failure. These
stiffness parameters (in units of force/distance), which can be modelled using partial end
releases or spring elements in most finite element modeling software.
If semi-rigidity is to be incorporated in a model, experimental data or analytical tools that
estimate the material behaviour of the joint elements must be used to determine joint
stiffness in its nonlinear form, or simplified as a linear value. Joint strength and stiffness
parameters depend on many factors including wood species and grade, plate type,
orientation of plate, orientation of loading, and geometry of the plate-to-wood contact.
Stiffness values for modeling are difficult to estimate due to the complexity of joint
behaviour. Furthermore, experimental data can only be considered accurate for truss
models in which the joint parameters closely resemble those that were tested.
In past studies, experimental stiffness values have been obtained as needed for validation;
however, these studies are limited and often focus on specific joints (Vatovec, 1996) or
behaviour such as out-of-plane bending (Liu, 2013). In the absence of experimental joint
stiffness data or appropriate estimates for all configurations, MPC trusses are statically
indeterminate structures and must be modelled with idealized pinned or rigid connections,
or a combination thereof.
Several studies have attempted to estimate the semi-rigid behaviour of MPC truss joints
through theoretical models. These models attempt to predict the load-deformation curve of
the MPC joint, as a function of the geometry of the plate-to-wood interface and the material
properties. One of the first and most widely referenced of such was developed by Foschi
(1977). Foschi developed a joint model based on the assumption that the tooth-wood
interaction in a MPC joint was responsible for all deformation, while the wood and plate
were each assumed to remain rigid within the contact area. A three-parameter equation was
developed to represent the nonlinear load-slip behaviour at the plate-wood interface. This
model was used and evaluated in many subsequent studies (Li, 1996; Riley, 1998; Liu,
2013).
It was found that Foschi’s (1977) model provides a reasonably accurate prediction of joint
stiffness in the linear range (Liu, 2013). However, use of this model requires experimental
contrasting Foschi’s work also involved complex joint models in addition to experimental
data for the material behaviour.
Riley (1998) developed a simpler model to predict the axial and rotational stiffness of MPC
residential wood truss joints. This study included testing of 36 tension splice joints and
heel joints to validate the analytical results. Three different joint behaviour assumptions
were applied and compared in this work. The semi-rigid joint method made use of fictitious
elements representing the stiffness parameters of the joints, which were calculated using
joint and tooth geometry and material properties. Member forces and truss deflections from
this analog were compared to those from analyses assuming pinned or fully fixed MPC
joints. As was hypothesized, the pinned and rigid assumptions provided the outer bounds
of maximum truss deflection results. The results of Riley’s semi-rigid analysis fell
in-between these sets of results.
When compared to experimental results, the semi-rigid stiffness values obtained from
Riley’s (1998) model fell within 10%, without being consistently larger or smaller. A
comparison of absolute moment and axial force in the top and bottom chords was also
carried out and showed that both the pinned and rigid joint models generally overestimate
the results of the semi-rigid model. Riley’s (1998) method was concluded to be valid for
joints made from softwood lumber and light gauge steel plates, and can be applied where
specific gravity and moisture content of wood, as well as plate geometry are known and
well-defined.
In more recent studies, it has been identified that complex joint models, when used as part
of larger models studying truss or whole roof behaviour, may be unnecessarily complicated
(Martin, 2010). Despite the potential for improved accuracy, complex joint models were
deemed inappropriate for the present study due to the time- and labor- intensive nature of
their employment. Additionally, since this study focuses on hypothetical structures, many
assumptions must be made. To employ a three-dimensional and/or nonlinear joint model,
too many parameters would be assumed, and without experimental data there is no practical
means of verifying the assumptions. As discussed in the following chapter, the modeling
of the possible truss behaviour can be estimated more certainly and can be used to identify
all possible vulnerabilities. The semi-rigid behaviour of joints will be considered, where
required, by applying linear experimental stiffness data.
In contrast to the complexity of joint models developed in some of the past research, other
available literature describing finite element models of entire roofs was found to lack the
level of detail required by the present study. In past MPC roof studies, truss modeling was
primarily concerned with validating the deflection behavior of a single model analog so
that the load sharing behavior of entire roofs could be captured (Jacklin, 2013;
Pfretzschner, 2012; Martin, 2010; Limkatanyoo, 2003). In these studies, the researchers
selected a truss analog and validated it to an acceptable level of agreement with
experimental deflection values. Few studies have addressed truss member forces (Li, 1996;
Vatovec, 1996), and experimental data on element-level behavior was found to be limited
to two studies (King & Wheat, 1987; Wolfe, et al., 1996).
Li (1996) evaluated the member axial force and moment results of a semi-rigid joint analog
of parallel-chord rectangular trusses tested by King & Wheat (1987). This analysis found
good agreement between modeled and experimental axial forces, but could not validate the
model with the member moments. Although intensive calculations were carried out to
estimate joint stiffness values for Li’s (1996) semi-rigid joint model, good overall
agreement of moment results could not be achieved. In models where member moments
compared closely to experimental data for certain members, there would be significant
differences for other members. King & Wheat (1987) reported, based on their experimental
results, that bending moments in truss members were highly sensitive to connection
stiffness. These findings suggest that great caution should be used in applying a semi-rigid
joint analog to any MPC structure unless sufficient experimental stiffness data is available
for comparable joints to those being modeled.
In addition to the pinned, rigid, and semi-rigid joint analogs previously mentioned, (Li, et
al., 1998) used a combination of semi-rigid and pinned connections; semi-rigid heel joints
and bottom chord splices with moment releases at the crown joint and web member ends.