ISSN 2286-4822 www.euacademic.org
Impact Factor: 3.1 (UIF) DRJI Value: 5.9 (B+)
Trust and Organization Performance
NAJEEBULLAH BS-(P&G Engineering), BUITEMS Quetta, Pakistan SYED NISAR AHMED Visiting Faculty Member, BUITEMS Quetta, Pakistan
Abstract:
The purpose of the study was to examine the relationship of trust and organization performance. In order to analyze the data, primary data collection technique, that is questionnaire, was used. It was disbursed to 100 subjects. The findings of the study revealed that trust and organization performance are positively associated with each other. The study also found that openness to experience moderates the relationship between trust and organization performance. As trust of employee is enhanced, the employee organization performance abilities get affected positively. The intensity of this relationship depends upon how much are employees highly open to experience things at work.
Key words: Trust, organization performance
Introduction:
Discussion issues.
This research is different from other research papers; in this research we involved different people from different organizations. To understand the actual concept of trust and organization performance we used a questionnaire and asked the people to fill it in with their own opinions.
We involved different organization people such as students, teachers, organization peoples, and policy makers.
Literature Review:
A lot of research has been done in the field of trust and organization performance, with a focus on whether trust is dependent on organization performance. Researchers like Kirsimarja, Blomqvist, Miles (2000), Adler (2001) and Blomqvist (2002 & 2005) have written extensively on trust and organization performance.
Trust:
Holder of shares of Trust in respect of shareholders is one of the fundamental aspects of moral treatment. However, in many situations, stakeholder power over the company and its stakeholders, due to the aforementioned duties, cannot be trusted to return. Shareholders in accordance with the principles of justice (Philips) trust obligations secularly, dependent on the low-power stakeholders, which may not fully be satisfactory (Van Buren). Organizational trust already exists for shareholders and this is a moral responsibility; when there is organizational trust, this is unlikely to be treated unfairly.
Organization performance:
Drew (1997, 427–441). This measure can be thought of as a variation of the balances scorecard method. The organizational performance is assessed by use of global output measures such as market share, profitability, growth rate, innovativeness, and successfulness in comparison with key competitors.
Link
Trust has an effective and significant role on organization performance (Dirks and Ferrin, 2001, Larson and Lafasto, 1989). Trust and organization performance are the two fundamentals that promote the members’ cooperation and enhance the organization ability to achieve their concerned goals successfully. Trust contemplates the relation of past and future organization performances. The greater the trust level, the higher and better will be the organization performance; trust is a one-directional product that measures the organization work. Kramer, by his research (1999) intended the growth of the literature on the relationship of trust and its role on organization performance, understanding the pivotal role of trust within organization specifically for research and practical work. The effective outcome of the organization work depends upon the value of trust within organization; lack of trust can abolish organization performance (Bennis and Nanus 1985; Fairholm 1994; Zand 1997). No one can deny the importance of trust and its correlation with organization performance.
H1: Trust is positively related to organization performance. Ho: Trust is not positively related to organization performance.
Methodology:
100 questionnaires, 80 questionnaires were received back. The response rate was 80%. The questionnaire contained a total of 10 items out of which 6 items were for Trust, 4 items were for Organization performance. Trust items were adopted and adapted from the questionnaire of organization performance used by Hoddil and Brinth (2011). The Organization performance questionnaire was adopted from Dotyi and Hsdef (2001).
Frequency %age
Gender Male 72 72
Female 8 8
Age 20-29 65 65
30-39 12 12
40-49 3 3
Education Bachelors 65 65
Masters 15 15
M.Phil. 0 0
Ph.D. 0 0
Experience 1-4 5 5
Table: 1: Demographics
Results and Discussion:
SPSS software estimated the following calculations:
Model of the Study
Trust Organization
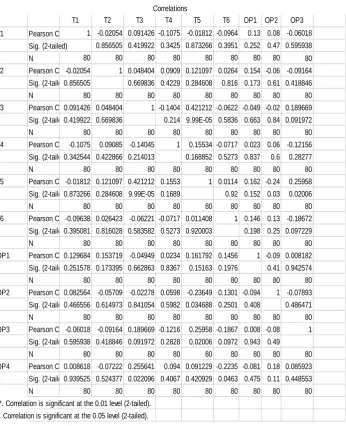
Correlations
[DataSet0]
T1 T2 T3 T4 T5 T6 OP1 OP2 OP3
T1 Pearson Correlation 1 -0.02054 0.091426 -0.1075 -0.01812 -0.0964 0.13 0.08 -0.06018 Sig. (2-tailed) 0.856505 0.419922 0.3425 0.873266 0.3951 0.252 0.47 0.595938
N 80 80 80 80 80 80 80 80 80
T2 Pearson Correlation-0.02054 1 0.048404 0.0909 0.121097 0.0264 0.154 -0.06 -0.09164 Sig. (2-tailed)0.856505 0.669836 0.4229 0.284608 0.816 0.173 0.61 0.418846
N 80 80 80 80 80 80 80 80 80
T3 Pearson Correlation0.091426 0.048404 1 -0.1404 0.421212 -0.0622 -0.049 -0.02 0.189669 Sig. (2-tailed)0.419922 0.669836 0.214 9.99E-05 0.5836 0.663 0.84 0.091972
N 80 80 80 80 80 80 80 80 80
T4 Pearson Correlation-0.1075 0.09085 -0.14045 1 0.15534 -0.0717 0.023 0.06 -0.12156 Sig. (2-tailed)0.342544 0.422866 0.214013 0.168852 0.5273 0.837 0.6 0.28277
N 80 80 80 80 80 80 80 80 80
T5 Pearson Correlation-0.01812 0.121097 0.421212 0.1553 1 0.0114 0.162 -0.24 0.25958 Sig. (2-tailed)0.873266 0.284608 9.99E-05 0.1689 0.92 0.152 0.03 0.02006
N 80 80 80 80 80 80 80 80 80
T6 Pearson Correlation-0.09638 0.026423 -0.06221 -0.0717 0.011408 1 0.146 0.13 -0.18672 Sig. (2-tailed)0.395081 0.816028 0.583582 0.5273 0.920003 0.198 0.25 0.097229
N 80 80 80 80 80 80 80 80 80
OP1 Pearson Correlation0.129684 0.153719 -0.04949 0.0234 0.161792 0.1456 1 -0.09 0.008182 Sig. (2-tailed)0.251578 0.173395 0.662863 0.8367 0.15163 0.1976 0.41 0.942574
N 80 80 80 80 80 80 80 80 80
OP2 Pearson Correlation0.082564 -0.05709 -0.02278 0.0598 -0.23649 0.1301 -0.094 1 -0.07893 Sig. (2-tailed)0.466556 0.614973 0.841054 0.5982 0.034688 0.2501 0.408 0.486471
N 80 80 80 80 80 80 80 80 80
OP3 Pearson Correlation-0.06018 -0.09164 0.189669 -0.1216 0.25958 -0.1867 0.008 -0.08 1 Sig. (2-tailed)0.595938 0.418846 0.091972 0.2828 0.02006 0.0972 0.943 0.49
N 80 80 80 80 80 80 80 80 80
OP4 Pearson Correlation0.008618 -0.07222 0.255641 0.094 0.091229 -0.2235 -0.081 0.18 0.085923 Sig. (2-tailed)0.939525 0.524377 0.022096 0.4067 0.420929 0.0463 0.475 0.11 0.448553
N 80 80 80 80 80 80 80 80 80
**. Correlation is significant at the 0.01 level (2-tailed). *. Correlation is significant at the 0.05 level (2-tailed).
Correlations
Results and discussion:
1. Correlation Analysis:
The correlation among the two variables namely trust and organization performance was checked, the results of which being reported in the correlation matrix. The two variables in the study are found to be highly correlated with each other. Throughout the analysis, trust will be denoted by T and organization performance is denoted by OP.
T OP
T 1 0.20
OP 0-20 1
** correlation is significant at 0.01 level of significance Table: 2: Correlation Matrix
2. Regression Analysis:
To test the hypothesis of the study, regression analysis was used in the third step. In order to examine the H1 of the study, regression was run keeping trust as independent and organization performance as dependent variable, the results of which are as follows:
Variables Β t-stat Significance
T 0.13* .176 0.861
R square = 0 % Adjusted R square = -12% ** correlation is significant at 0.01 level of significance Table : 3 : Regression Analysis
The coefficient of trust is found to be positive and significant (β = 0.13 at sig = 0.861). The t-stats of trust is .176 and 3.792 which shows that the result is highly significant. The overall fit of the model is 0% (adjusted R square = -12%)
Conclusion and suggestions:
has been provided. Hopefully this article would support the concept of trust and working as a team in order that the integrity of effectiveness and worthiness is maintained. Some issues require special attention and should be examined for positive outcomes such as the attitude of leaders towards subordinators and response of subordinators to their leaders which directly or indirectly influence the organization performance, rather than influencing organization performance through informal attitude regarding events, working procedure etc.
Recommendations and particular implications:
Following are the recommendations drawn from the results of this study.
Organization managers should treat the employees equally to develop the ability of trust among them.
There should be equal chances for the employees to take their time.
Organization should trust its employees so that they could develop self-responsibility.
Managers should get their employees to try new things even if something goes wrong in order to get them to think freely.
Limitations and future research: