Available online: https://edupediapublications.org/journals/index.php/IJR/ P a g e | 1 7 0 2
Developing Global Competitiveness by Assessing Organized Retail
Productivity Using Data Envelopment Analysis
Ms. Pooja Vyas Research Scholar,IMSAR, M.D.University, Rohtak(Hr.) Email id: [email protected]
Abstract:
The purpose of this paper was to find out efficiently some of the top organized India retail companies have been performing relative to each other over the years and thereby to identify factors that help increase the efficiency of a retail company. The paper is deemed to be helpful to enable Indian retail companies gain a competitive advantage in the face of increased competition being faced in the emerging organized retail sector in India. The findings brought forth Advertising and Marketing expenses as the significant performance determining factors to be paid attention to.Keywords:
Global Competitive Advantage, Organized Retail, Data Envelopment Analysis (DEA),Performance Determinants, Performance Indicators
Available online: https://edupediapublications.org/journals/index.php/IJR/ P a g e | 1 7 0 3
successful in the coming onslaught of heightened competition.
The Indian Retail Sector:
A shopping revolution is ushering in India where, a large population in the 20-34 age group in the urban regions is boosting demand. This has resulted in huge international retail investment and a more liberal FDI policy making India currently the most attractive destination for global retailers with a GRDI score of 92 and a growth rate of 25 to 30% in the year 2007. Since the time the Narsimha Rao Government kicked off reforms in 1991 and interest rate deregulation became a reality, the retail sector has been like a toddler waiting to grow big. It has taken some time but finally it seems that the evolution of organized retailing in India is picking up momentum.According to the Global Edge report on Market Potential for Emerging Markets (2008), India ranks eleventh in the list and has been able to maintain itself around this Figure for quite some years now. In fact, according to Global
Retail Development Index (2007), India is positioned as the leading destination for retail investment topping the chart above Russia and China. Indian organized retail is growing at a faster pace than was expected and could constitute 25% of the overall retail sector by 2014. According to a study on retail sector prepared by Deloitte Haskins and Sells, organized retail in India had 8% share of overall retail market (total retail pie) in 2007 in comparison to 5% in the year 2006 and is expected to grow still further in the future.
Available online: https://edupediapublications.org/journals/index.php/IJR/ P a g e | 1 7 0 4
and measuring the productivity and efficiency of retailers have been important issues in retailing research (e.g., Bucklin 1978; Ingene 1982, 1984; Richford and Brown 1985; Ratchford and Stoops 1988). Retail productivity has been considered important for society and for the individual retail firm (Bucklin, 1978; Ingene, 1984). But, despite a special issue of the Journal of Retailing in Fall, 1984 and subsequent researches, there is still no single widely accepted definition and measurement methodology for retail productivity. Most of the international studies of retail productivity in the 1950s were based heavily on concepts developed in productivity assessments in the manufacturing sector. The European Productivity Agency and the National Institute of Economic and Social Research had provided foundation studies of various industrial sectors and economists drew on these sources (Rostas, 1948). These studies effectively set the parameters for studies, not only related to manufacturing but also to retailing, for the next 30 years
(Deurinck, 1955). On these foundations, and comparable ones in USA, several studies of retail productivity were undertaken. While in essence the concepts remain relevant, much has changed over 50 years in respect of both the nature of retail productivity and the factors affecting this productivity thus requiring new and innovative methods for measuring retail productivity and efficiency.
OBJECTI VES OF THE PRESENT
STUDY:
The present study was undertaken to understand the factors affecting the performance of organized retail in India so as to better understand ways to help companies develop global competitive advantage in the retail sector. In particular, the study focused on:1. Identifying the factors that have an effect on the performance of organized retail in India.
Available online: https://edupediapublications.org/journals/index.php/IJR/ P a g e | 1 7 0 5
3. Identifying the more significant performance determining factors
RESEARCH METHODOLOGY:
Data collection method & Justification of s econdary source: The data used in this paper was collected from secondary sources. Data was obtained for 5 retail companies of India for the time period 2005 to 2012. The source of data was Prowess Database. Prowess is a database of large and medium Indian firms containing detailed information on over 20,000 firms. These comprise all companies traded on India's major stock exchanges and several others, including, the central public sector enterprises. The database covers most of the organized industrial activities such as banking, retailing, airlines and other service and manufacturing sectors of India. Prowess provides detailed information on each company including a normalized database of the financials covering 1,500 data items and ratios per company.
Besides, it provides quantitative information on production, sales, consumption of raw material and energy etc. As Prowess database has found useful applications in places where trust and reliability matter the most, Prowess became the preferred source of data in respect of the variables identified for the present study.
Available online: https://edupediapublications.org/journals/index.php/IJR/ P a g e | 1 7 0 6
Method of Analys is : Data was analyzed using two different techniques, Regression Analysis and DEA model. For Regression analysis, the nine performance determining factors were the independent variables while the three performance indicating factors were taken as the dependent variables. In the DEA Model, the performance determinants were used as the Input variables while the performance indicators were used as the Output variables.
Available online: https://edupediapublications.org/journals/index.php/IJR/ P a g e | 1 7 0 7
evaluation since it was seen that though DEA works on the same concept as the traditional techniques of measurement, it covers lots of other aspects which the traditional techniques lack. DEA also has certain drawbacks but its advantages overshadow its disadvantages. The major advantages of DEA based method of efficiency evaluation includes utilization of both output and input observations, accommodation of multiple inputs and outputs, accommodation of both controllable and uncontrollable factors, computation of a single index of productivity, development of a relative measure of performance for each retail outlet using best performers as the bases, and non-imposition of any functional form on the data. Moreover, unlike total factor productivity indexes, DEA gives each of the observations its own set of weights which make the analysis more appropriate.
RESEARCH
FI NDI NGS
AND
ANALYSIS:
Affect of the performancedetermining factors of organized retail on performance indicators using Regression Analysis
Available online: https://edupediapublications.org/journals/index.php/IJR/ P a g e | 1 7 0 8
Table 1: Regression Analysis with Sales as dependent variable
Model Unstandardiz ed Coefficien ts Standardize d Coefficient s
t Sig. B Std.
Error
Bet a
B Std. Error 1 (Constant) 23.481 20.021 1.173 .25
3 Advertising Expenses -7.243 2.844
-.203
-2.547 .01 8 Capital employed .01
8 .18 5 .00 7 .09 8 .92 3 Current Assets .22
4 .50 3 .09 0 .44 6 .66 0 Gross fixed assets -.569 .59
4
-.132
-.957 .34 9 Inventories 1.110 .16
6
.33 7
6.697 .00 0 Marketing expenses 2.572 1.730 .04
8
1.486 .15 1 Power and fuel expenses 54.275 11.873 1.06
9
4.571 .00 0 Salaries and wages -1.170 3.493
-.065
-.335 .74 1 Working capital -.520 .43
6
-.088
-1.194 .24 5 Dependent Variable: Sales
As can be seen from Table 1, only 3 of the independent variables were found to be statistically significant in the model at 5% significance level. These include - Advertising Expenses, Inventories and Power & Fuel Expenses. Looking at the Beta values for all these variables, it could be seen that Advertising Expenses was negatively related to the dependent variable i.e. Sales while the other 2 variables i.e. Inventories and Power & Fuel Expenses were both positively related to the dependent variable. Looking at the Beta values, it can be said that in absolute terms Power & Fuel Expenses with a
Beta value of 1.069 had the maximum effect on Sales while Advertising Expenses with a Beta value of -.203 had the least effect.
Available online: https://edupediapublications.org/journals/index.php/IJR/ P a g e | 1 7 0 9
predictors, it can be said that they were not related so data was free from multi co linearity. The Beta values and the
significance levels of t-tests for significance of individual independent variables are given in Table 2.
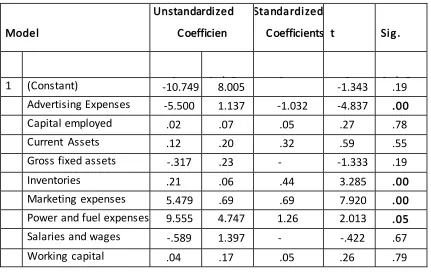
Table 2: Regres s ion Analys is with PBIT as dependent variable
Model
Unstandardized Coefficien ts
Standardized
Coefficients t Sig.
B Std. Error Bet a
B Std. Error 1 (Constant) -10.749 8.005 -1.343 .19
3 Advertising Expenses -5.500 1.137 -1.032 -4.837 .00
0 Capital employed .02
0 .07 4 .05 5 .27 3 .78 8 Current Assets .12
0 .20 1 .32 3 .59 8 .55 6 Gross fixed assets -.317 .23
8
-.491
-1.333 .19 6 Inventories .21
8
.06 6
.44 3
3.285 .00 3 Marketing expenses 5.479 .69
2
.69 0
7.920 .00 0 Power and fuel expenses 9.555 4.747 1.26
2
2.013 .05 7 Salaries and wages -.589 1.397
-.219
-.422 .67 7 Working capital .04
7 .17 4 .05 3 .26 7 .79 2 Dependent Variable: PBIT
As can be seen from Table 2, only 4 of the independent variables were found to be statistically significant in the model at 5% significance level. These include - Advertising Expenses, Inventories, Marketing Expenses and Power & Fuel Expenses. Looking at the Beta Values for all these variables, it
Available online: https://edupediapublications.org/journals/index.php/IJR/ P a g e | 1 7 1 0
effect on PBIT while Inventories with a Beta value of .443 had the least effect on PBIT.
The negative effect of Advertising Expenses on PBIT clearly shows that an increase in Advertising Expenses decreases PBIT and vice versa. Thus, every one unit decrease/increase in Advertising Expenses will lead to a 1.032 increase/decrease in PBIT, other variables remaining unchanged. The positive effect of Inventories, Marketing Expenses and Power & Fuel Expenses on PBIT indicates, that for every one unit increase in Inventories, Marketing Expenses and Power & Fuel Expenses, PBIT will increase by .443, .690 and 1.262 respectively, if the other variables remain constant.
Effect of Performance Determining
Factors on Return on Capital
Available online: https://edupediapublications.org/journals/index.php/IJR/ P a g e | 1 7 1 1
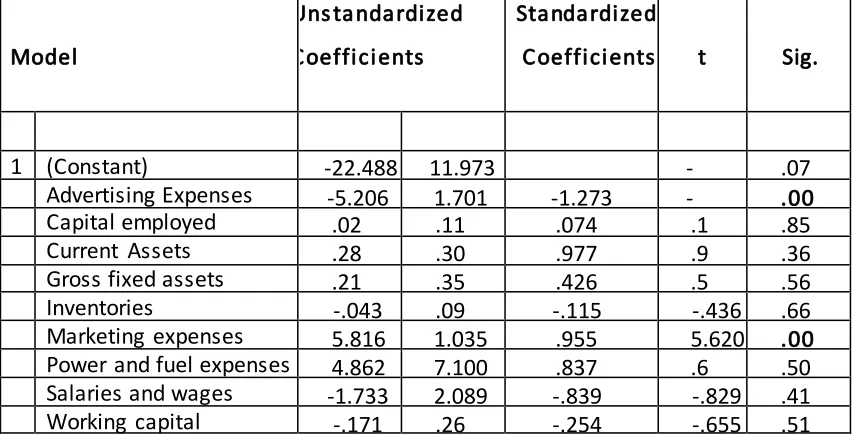
Table 3: Regression Analysis with Return on Capital Employed as dependent variable
Model
Uns tandardized Coefficients
Standardized
Coefficients t Sig.
B Std. Error Beta B Std. Error 1 (Constant) -22.488 11.973
-1.878 .07 4 Advertising Expenses -5.206 1.701 -1.273
-3.061 .00 6 Capital employed .02
1
.11 1
.074 .1 8 8
.85 3 Current Assets .28
0
.30 1
.977 .9 3 0
.36 2 Gross fixed assets .21
0
.35 5
.426 .5 9 2
.56 0 Inventories -.043 .09
9
-.115 -.436 .66 7 Marketing expenses 5.816 1.035 .955 5.620 .00
0 Power and fuel expenses 4.862 7.100 .837 .6
8 5
.50 1 Salaries and wages -1.733 2.089 -.839 -.829 .41
6 Working capital -.171 .26
1
-.254 -.655 .51 9
Dependent Variable: Return on Capital Employed
As can be seen from Table 3, only 2 of the independent variables were statistically significant in the model at 5% significance level. These include - Advertising Expenses and Marketing Expenses. Looking at the Beta Values for these 2 variables, it was seen that Advertising Expenses was negatively related to the dependent variable i.e. Return on Capital Employed while Marketing Expenses was positively related to the dependent variable. Looking at the Beta values it could be
said that in absolute terms Advertising Expenses with a Beta Value of -1.273 had a more significant effect on the dependent variable than Marketing Expenses.
Available online: https://edupediapublications.org/journals/index.php/IJR/ P a g e | 1 7 1 2
in Marketing Expenses leads to an increase/decrease in Return on Capital Employed, because of the positive effect of the former on the latter. Thus, for every one unit decrease/increase in Advertising Expenses, the Return on Capital Employed will increase/decrease by 1.273 while for every one unit increase/decrease in Marketing Expenses,
Efficient and inefficient Retail Organizations: The results obtained from
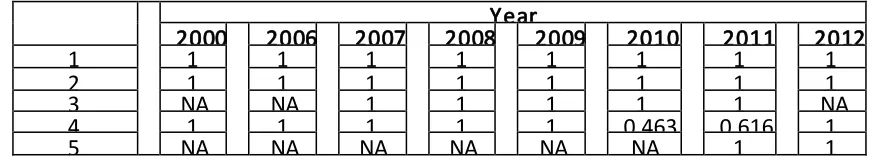
data entered in the DEA model are tabulated in Table 4. It can be seen from this table that companies 1, 2, 3, and 5 were found to be running efficiently with company 1 showing consistency in efficiency across all the years studied. Organization 4 secured efficiency score less than 1 in the years 2005 and 2006 showing that it was relatively inefficient in these years in comparison to the other companies.
Table 4: Efficiency scores for companies in different years
Companie s
Year 2000
5
2006 2007 2008 2009 2010 2011 2012
1 1 1 1 1 1 1 1 1
2 1 1 1 1 1 1 1 1
3 NA NA 1 1 1 1 1 NA
4 1 1 1 1 1 0.463 0.616 1
5 NA NA NA NA NA NA 1 1
In using DEA, the weights were estimated separately for each retail organization such that its efficiency was the maximum attainable. As can be seen in Figure 2, DEA estimated the weights 0.001, 0.043, 0.001, 0.951, 0.001, 0.001, 0.001, 0.001 and 0.001 for the input variables and 0.010, 0.000, and 0.058
Available online: https://edupediapublications.org/journals/index.php/IJR/ P a g e | 1 7 1 3
inputs (Xs) and outputs (Ys) of all other units in the analysis their ratio of weighted outputs to weighted inputs was less than or equal to 1. Similarly, DEA estimated a separate set of weights for each retail organization such that the estimated weights led to a maximum attainable efficiency for that organization. As seen from Figure 2, DEA optimized on each individual retail organization’s performance in relation to the performance of all other retail organizations. While using DEA, the estimated weights were constrained so that no one input or output variable dominated the efficiency estimation. Minimum limits were also set for the estimated weights so that all inputs and outputs were forced to play a role in efficiency computation. The efficiency computed by DEA assumed that 100% efficiency is attained for an organization only when (1) none of the outputs can be increased without either increasing one or more inputs or decreasing some of its other outputs and (2) none of the inputs can be decreased without decreasing some of its outputs or
increasing some of its other inputs. Hence, 100% efficiency is defined to have been attained by a retail organization only when comparisons with other organizations do not provide evidence of inefficiency in the use of any inputs and in creation of any outputs.
Available online: https://edupediapublications.org/journals/index.php/IJR/ P a g e | 1 7 1 4
was computed. This can help the inefficient organization identify how to allocate resources more efficiently and improve its productivity.An inefficient organization may become efficient by increasing all outputs by an amount equal to its corresponding slack (i.e.,
move towards the efficient frontier vertically in the case of a 2- dimensional plot) or by decreasing all controllable inputs by amounts equal to its corresponding slacks (i.e., move towards the efficient frontier horizontally in the case of a 2- dimensional plot).
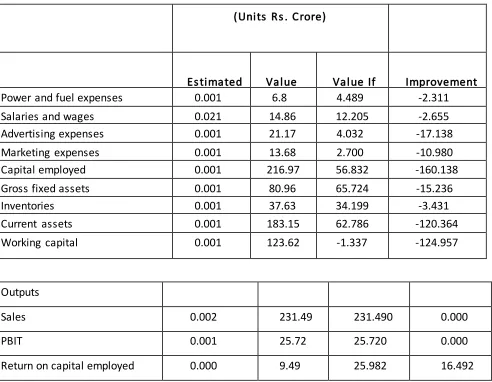
Table 5: Sensitivity analysis for retail organization 4 for the year 2010
(Units Rs . Crore)
Inputs
Es timated Weights
Value Measured
Value If Efficient
Improvement Scope/Slack Power and fuel expenses 0.001 6.8 4.489 -2.311 Salaries and wages 0.021 14.86 12.205 -2.655 Advertising expenses 0.001 21.17 4.032 -17.138 Marketing expenses 0.001 13.68 2.700 -10.980 Capital employed 0.001 216.97 56.832 -160.138 Gross fixed assets 0.001 80.96 65.724 -15.236 Inventories 0.001 37.63 34.199 -3.431 Current assets 0.001 183.15 62.786 -120.364 Working capital 0.001 123.62 -1.337 -124.957
Outputs
Sales 0.002 231.49 231.490 0.000
PBIT 0.001 25.72 25.720 0.000
Available online: https://edupediapublications.org/journals/index.php/IJR/ P a g e | 1 7 1 5
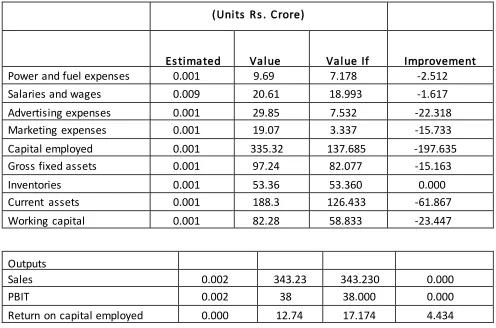
Table 6: Sens itivity analys is for retail organization 4 for the year 2010
(Units Rs . Crore)
Inputs
Es timated Weights
Value Meas ured
Value If Efficient
Improvement Scope/Slack Power and fuel expenses 0.001 9.69 7.178 -2.512 Salaries and wages 0.009 20.61 18.993 -1.617 Advertising expenses 0.001 29.85 7.532 -22.318 Marketing expenses 0.001 19.07 3.337 -15.733 Capital employed 0.001 335.32 137.685 -197.635 Gross fixed assets 0.001 97.24 82.077 -15.163 Inventories 0.001 53.36 53.360 0.000 Current assets 0.001 188.3 126.433 -61.867 Working capital 0.001 82.28 58.833 -23.447
Outputs
Sales 0.002 343.23 343.230 0.000
PBIT 0.002 38 38.000 0.000
Return on capital employed 0.000 12.74 17.174 4.434
Table 5 and 6 show the gap calculated for various inputs of the inefficient organization by comparing them with the combined weighted inputs of all the efficient organizations for year 2009 and year 2010 respectively. Table 5 shows the sensitivity analysis results for retail organization 4 for the year 2009 while
Available online: https://edupediapublications.org/journals/index.php/IJR/ P a g e | 1 7 1 6
outputs of its efficient reference organizations. These efficient reference organizations were organizations which operate under circumstances similar to that of organization 4, but have 100% efficiency. The results show that retail organization 4 could have become efficient (increased efficiency from 0.463 to 1.00 in year 2009 and from 0.616 to 1.00 in year 2010) by increasing all outputs by the corresponding slack amounts or decreasing all controllable inputs by corresponding slacks. Retail organization 4's estimated weights for the 12 variables are also shown in Table 5 and Table 6 for the year 2009 and 2010 respectively. DEA estimated these weights such that the estimated efficiency of 0.463 and 0.616 for retail organization 4 is the maximum attainable. No other combination of weights would have produced a higher efficiency estimate for retail organization and yet satisfied all of the constraints in the optimization.As can be seen from tables 5 and 6, the maximum contribution to total input savings was from marketing expenses
(2005:17% & 2006:25%) and advertising expenses (2005:17% & 2006:23%). Though working capital was seen as a major improvement area in the year 2005, it got substantially covered in the year 2006 (from 21% to 9%). Thus, retail organization 4 in order to become efficient needed to pay more attention on the marketing and advertising expenses as the most potential improvements factors. From the perspective of improving outputs, the results suggested that a need existed to improve return on capital. Keeping these factors in mind, retail organization 4 became efficient in the year 2007 as can be seen from Figure 5.
Available online: https://edupediapublications.org/journals/index.php/IJR/ P a g e | 1 7 1 7
of the same company to understand which format is performing more efficiently and hence is more suited for a developing country like India.
REFERENCES:
Achabal, Dale D., Heineke John M., and Mclntyre Shelby H. (1984). Issues and Perspectives on Retail Productivity. Journal of Retailing, 60 (Fall): pp.107-127.
Bal H., Örkcü H. H. (2005). Combining the Discriminant Analysis and the Data Envelopment Analysis in View of Multiple Criteria Decision Making: A New Model. Journal of Science, Gazi University, Vol. 3, No 18, pp. 355-364.
Banker, Rajiv D. and Morley Richard C. (1986). Efficiency Analysis for Exogenously Fixed Inputs and Outputs. Operations Research, 4 (July/August): pp.513-521.
Bloom, G. F. (1972). Productivity in the Food Industry: Problems
and Potential. Cambridge, MA: MIT Press. Bucklin, Louis P. (1978). Productivity in Marketing. Chicago: AMA.
Bush, Robert P., Bush Alan J., Ortinau David J., and Hair Joseph F. Jr. (1990). Developing A Behavior-Based Scale to Assess Retail Salesperson Performance. Journal of Retailing, 66 (Spring): pp.119-136. Deurinck, G. (Ed.) (1955). Productivity Measurement, Vol. 1 Concepts EPA, Project 235 (Paris: OEEC).
Doutt, Jefferey T. (1984). Comparative Productivity Performance in Fast-Food Retail Distribution, Journal of Retailing, 60 (Fall): pp.98-106.
Available online: https://edupediapublications.org/journals/index.php/IJR/ P a g e | 1 7 1 8
Journal of Operational Research, No 132, pp. 245-259.
Farrell, M. (1957). The Measurement of Productive Efficiency. Journal of the Royal Statistical Society, Series A, General, 120, Part 3, pp.253-281.