International Journal of Research (IJR)
e-ISSN: 2348-6848, p- ISSN: 2348-795X Volume 2, Issue 08, August 2015Available at http://internationaljournalofresearch.org
Optimization of Effective Parameters of Neem Oil
Biodiesel using Taguchi Method and Anova
Anand Prakash Mall
1& Amit Pal
21M.Tech (Thermal) Scholar, Delhi Technological University (DTU), New Delhi, India Mb No: +919415879658: E-mail:[email protected]
2Dr. Amit Pal (Associate Professor), Dept. of Mechanical Engineering, Delhi Technological University (DTU), New Delhi, India
Mb No: Mb No: +919868543545: E-mail:[email protected]
ABSTRACT
Currently, most of the biodiesel is produced from the edible/refined type oil using methanol and alkaline catalyst. However, large amount of non-edible type oils and fats are available in our country. In this study, crude neem oil is used as alternative fuel for biodiesel production. The difficulty with alkaline transesterification of these oils has contained large amounts of free fatty acids (FFA). These free fatty acids quickly react with the alkaline catalyst to produce soaps that inhibit the separation of the ester and glycerin.
A two-step transesterification process is developed to convert the high FFA oils to its mono-esters. Using 100 ml of oil, the optimum combination of parameters for pretreatment were found to be 0.45 v/v methanol-oil-ratio, 0.5% v/v H2SO4 acid catalyst, 50˚C and 45 min reaction time. After
pretreatment of neem oil, transesterification reaction was carried out with 4.5:1 methanol-to-oil molar ratio, 1% KOH as alkaline catalyst, 75 min reaction time and 50˚C reaction temperature to produce the fatty acid methyl ester. This two step process gave maximum average yield of 70±2%.
International Journal of Research (IJR)
e-ISSN: 2348-6848, p- ISSN: 2348-795X Volume 2, Issue 08, August 2015Available at http://internationaljournalofresearch.org
1. INTRODUCTION:
The use of alternative fuels instead of conventional fossil fuels is becoming increasingly significant due to decreasing petroleum reserves and increasing greenhouse gases, all of which lead to global warming, ozone depletion and political and health concerns (Fukuda et al., 2001). Plant oils have been used as alternative fuels for many years, since they are renewable and readily available. However, these oils cannot be used directly as fuel sources in diesel engines due to: (a) high viscosity which leads to poor fuel atomization during the injection process, (b) low volatility and (c) polymerization which results in deposit formation, incompletion combustion and poor emissions (Ma and Hanna, 1999; Meher et al., 2006). To overcome these disadvantages, oils can be converted into fatty acid methyl esters (FAME) which are also known as biodiesel. Biodiesel is an alternative fuel that is non-toxic, completely biodegradable and renewable and can be adapted easily without any modification to diesel engines.
Several processes have been developed for biodiesel production, such as pyrolysis, micro emulsification and transesterification. The chemical change of the products from the reactants caused by the thermal energy in the presence of air or nitrogen sparging is called a pyrolytic process. These products are similar to the petroleum-derived fuel. However, during the pyrolysis process, the removal of oxygen leads to reduce the environmental benefits (Ma and Hanna, 1999). The problem of the high viscosity of the substrates has been investigated using microemulsions with solvents (methanol, ethanol and 1-butanol) to meet the international standards of petroleum-derived fuels. However,
an increase of lubricating oil viscosity, irregular injector needle sticking, incomplete combustion and heavy carbon deposits were reported in the laboratory screening endurance test. Therefore, transesterification process plays a vital role, in order to overcome these disadvantages.
The process of displacing alcohol from an ester to form another ester is called transesterification. Transesterification is the most simple and efficient method to produce biodiesel by using acids, alkalis, or enzymes as catalysts. Triglycerides with high free fatty acid and water contents are not essential for a biodiesel conversion process using an acid catalyst. However, the reaction rates are slower than those of the alkali catalytic process (Freedman et al., 1986). The alkali-catalysis transesterification process has been widely used in the biodiesel industry, because it gives a high yield of conversion of fatty acid methyl esters from triglycerides at low temperatures and pressures in a relatively short reaction time of 4-10 hours. However, it has several drawbacks including product separation, soap formation and negative environmental impacts such as greenhouse gas, CO, hydrocarbons, NOx and particles in exhaust emissions (Nielsen et al., 2008).
International Journal of Research (IJR)
e-ISSN: 2348-6848, p- ISSN: 2348-795X Volume 2, Issue 08, August 2015Available at http://internationaljournalofresearch.org
strong odor that is said to combine the odors of peanut and garlic [M.A. Fazal et al., 2011]. Neem comprises mainly of triglycerides and large amounts of triterpenoid compounds. It contains four significant saturated fatty acids, of which two are palmitic acid and two are stearic acid. It also contains polyunsaturated fatty acids such as oleic acid and linoleic acids [Muthu et al., 2010]
2. Taguchi Method to Optimize the
Process Parameters:
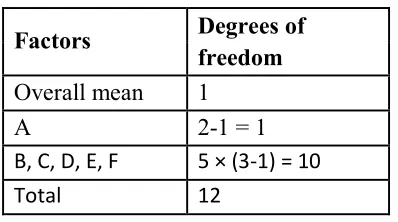
Taguchi method is based on performing evaluation or experiments to test the sensitivity of a set of response variables to a set of control parameters (or independent variables) by considering experiments in “orthogonal array” with an aim to attain the optimum setting of the control parameters. Orthogonal arrays provide a best set of well balanced (minimum) experiments. Table2 (a) Shows eighteen standard orthogonal arrays along with the number of columns at different levels for these arrays. An array name indicates the number of rows and columns it has, and also the number of levels in each of the columns. For example array L4 (23) has four rows and three “2 level” columns. Similarly the array L18 (2137) has 18 rows; one “2 level” column; and seven “3 level” columns. Thus, there are eight columns in the array L18. The number of rows of an orthogonal array represents the requisite number of experiments. The number of rows must be at least equal to the degrees of the freedom associated with the factors i.e. the control variables. In general, the number of degrees of freedom associated with a factor (control variable) is equal to the number of levels for that factor minus one. For example, a case study has one factor (A) with “2 levels” (A), and fivefactors (B, C, D, E, F) each with “3 level”. Table 2(b) depicts the degrees of freedom calculated for this case. The number of columns of an array represents the maximum number of factors that can be studied using that array.
Table 2(a) Standard orthogonal arrays
Orthog onal array
Num ber of rows
Max imu m num ber of facto rs
Maximum number of columns at these levels
2 3 4 5
L4 4 3 3 - - -
L8 8 7 7 - - -
L9 9 4 - 4 - -
L12 12 11 11 - - -
L16 16 15 15 - - -
L16’ 16 5 - - 5 -
L18 18 8 1 7 - -
L25 25 6 - - - 6
L27 27 13 - 13 -
-L32 32 31 31 - - -
L32’ 32 10 1 - 9 -
L36 36 23 11 12 - -
L36’ 36 16 3 13 - -
L50 50 12 1 - - 11
L54 54 26 1 25 - -
L64 64 63 63 - - -
L64’ 64 21 - - 21 -
International Journal of Research (IJR)
e-ISSN: 2348-6848, p- ISSN: 2348-795X Volume 2, Issue 08, August 2015Available at http://internationaljournalofresearch.org
The signal to noise ratios (S/N), which are log functions of desired output, serve as the objective functions for optimization, help in data analysis and the prediction of the optimum results. The Taguchi method treats the optimization problems in two categories: static problems and dynamic problems. For simplicity, the detailed explanation of only the static problems is given in the following text. Next, the complete procedure followed to optimize a typical process using Taguchi method is explained with an example.
Table 2(b) The degrees of freedom for one factor (A) in “2 levels” and five factors (B, C, D, E, F ) in “3 levels”
Factors Degrees of freedom
Overall mean 1
A 2-1 = 1
B, C, D, E, F 5 × (3-1) = 10
Total 12
Static problems
Generally, a process to be optimized has several control factors (process parameters) which directly decide the target or desired value of the output. The optimization then involves determining the best levels of the control factor so that the output is at the target value. Such a problem is called as a "STATIC PROBLEM". This can be best explained using a P-Diagram (Figure 2(a)) which is shown below ("P" stands for Process or Product). The noise is shown to be present in the process but should have no effect on the output. This is the primary aim of the Taguchi experiments - to minimize the variations in output even though noise is present in the process. The process is then said to have become ROBUST.
Figure 2(a) P-Diagram for static problems.
Signal to Noise (S/N) Ratio:
There are three forms of signal to noise (S/N) ratio that are of common interest for optimization of static problems.
[1] Smaller-the-better
This is expressed as
n = −10 Log10 [mean of sum of squares of
measured data]
This is usually the chosen S/N ratio for all the undesirable characteristics like “defects” for which the ideal value is zero. When an ideal value is finite and its maximum or minimum value is defined (like the maximum purity is 100% or the maximum temperature is 92 K or the minimum time for making a telephone connection is 1 sec) then the difference between the measured data and the ideal value is expected to be as small as possible. Thus, the generic form of S/N ratio becomes,
n = −10 Log10 [mean of sum of squares of
{measured – ideal}]
[2] Larger-the-better
International Journal of Research (IJR)
e-ISSN: 2348-6848, p- ISSN: 2348-795X Volume 2, Issue 08, August 2015Available at http://internationaljournalofresearch.org
n = −10 Log10 [mean of sum of squares of
reciprocal of measured data]
This is often converted to smaller-the-better by taking the reciprocal of the measured data and next, taking the S/N ratio as in the smaller-the-better case.
[3] Nominal-the-best
This is expressed as
𝑛=−10𝐿𝑜𝑔10 [
𝑠𝑞𝑢𝑎𝑟𝑒 𝑜𝑓𝑚𝑒𝑎𝑛 𝑣𝑎𝑟𝑖𝑎𝑛𝑐𝑒 ]
This case arises when a specified value is the most desired, meaning that neither a smaller nor a larger value is desired.
Application of Taguchi Method:
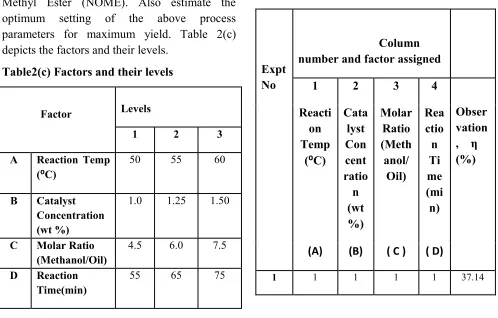
Determine the effect of four process parameters: Reaction temp (A), Catalyst Concentration (wt %) (B), Molar ratio (Methanol/Oil) (C) and Reaction time (D) on the yield of Neem Oil Methyl Ester (NOME). Also estimate the optimum setting of the above process parameters for maximum yield. Table 2(c) depicts the factors and their levels.
Table2(c) Factors and their levels
Factor
Levels
1 2 3
A Reaction Temp
(⁰C)
50 55 60
B Catalyst
Concentration (wt %)
1.0 1.25 1.50
C Molar Ratio
(Methanol/Oil)
4.5 6.0 7.5
D Reaction
Time(min)
55 65 75
2.1. Selection of the design matrix and performing the experiments
The present experiment is associated with four factors with each at three levels. Table 2(a) indicates that the best suitable orthogonal array is L9. Table 2(d) shows the design matrix for L9. Next conduct all the nine experiments and observe % yield of neem oil methyl ester (NOME). The summary statistic, ηi, for an experiment, i, is given by
𝑛𝑖 =−10𝐿𝑜𝑔10 𝐶𝑖
where Ci refers to mean squared deviation for experiment i and the mean square refers to the average of the squares of the nine observations in the experiment i. Table 2(d) also depicts the observed value of ηi for all the nine experiments. This summary statistic ηi is called the signal to noise (S/N) ratio.
Table 2(d) L9 array matrix experiment table.
Expt No
Column
number and factor assigned
1 2 3 4
Obser vation , η (%) Reacti
on Temp
(⁰C)
Cata lyst Con cent ratio
n (wt %)
Molar Ratio (Meth anol/
Oil)
Rea ctio n Ti me (mi
n)
(A) (B) ( C ) ( D)
International Journal of Research (IJR)
e-ISSN: 2348-6848, p- ISSN: 2348-795X Volume 2, Issue 08, August 2015Available at http://internationaljournalofresearch.org
2 1 2 2 2 36.85
3 1 3 3 3 36.81
4 2 1 2 3 36.68
5 2 2 3 1 36.22
6 2 3 1 2 36.42
7 3 1 3 2 35.71
8 3 2 1 3 35.83
9 3 3 2 1 35.55
Table2 (e) Yield of Neem Oil Methyl Ester and S/N ratio (η)
Exp . No
% Yield of Neem Oil
Methyl Ester(NOME) S/N ratio (η)
Samp le 1
Sam ple 2
Samp le 3
Mean
1 70.8 73.9 71.3 72.0 37.14
2 65.2 70.4 74.1 69.9 36.85
3 68.9 70.2 68.8 69.3 36.81
4 66.6 69.2 69.1 68.3 36.68
5 61.8 68.5 64.4 64.9 36.22
6 65.8 67.9 65.2 66.3 36.42
7 58.2 63.5 61.9 61.2 35.71
8 57.3 66.6 63.0 62.3 35.83
9 58.2 61.4 60.4 60.0 35.55
Mean 66.0 36.35
According to the analysis for the case of larger the better the mean squared deviations (MSD) of each experiment were evaluated using the following equation
𝑀𝑆𝐷=1
𝑛 (
1 𝑦𝑖)
2 𝑛 𝑖=1
Where n is the number of repetitions of each experiment and yi the yield of Neem Oil methyl ester.
Then the S/N ratio was evaluated using the equation
S/N ratio = -10 Log (MSD)
The effect of parameter level is defined as the deviation it causes from the overall mean. Hence as a first step , calculating the overall mean value of S/N ratio for the experimental region defined by the factor levels in Table 2(f).
2.2. Calculation of factor effects
The effect of a factor level is defined as the deviation it causes from the overall mean. Hence as a first step, calculate the overall mean value of η for the experimental region defined by the factor levels in Table 2(d) as
𝑚=1 9 𝑛𝑖
9
𝑖=1 =
1
9 𝑛1+ 𝑛2 + 𝑛3 +⋯+𝑛9 = 36.35 The effect of the temperature at level A1 (at experiments 1, 2 and 3) is calculated as the difference of the average S/N ratio for these experiments (mA1) and the overall mean. The same is given as
The effect of temperature at level
𝐴1=𝑚𝐴1− 𝑚=
1
International Journal of Research (IJR)
e-ISSN: 2348-6848, p- ISSN: 2348-795X Volume 2, Issue 08, August 2015Available at http://internationaljournalofresearch.org
Similarly,
The effect of temperature at level
𝐴2=𝑚𝐴2− 𝑚=
1
3 𝑛4+ 𝑛5 + 𝑛6 − 𝑚
The effect of temperature at level
𝐴3=𝑚𝐴3− 𝑚=
1
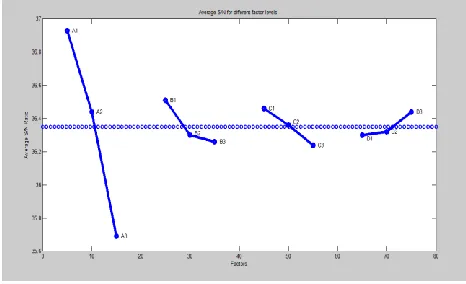
3 𝑛7+ 𝑛8 + 𝑛9 − 𝑚 Using the S/N ratio data available in Table 2(d). The average of each level of the four factors is calculated and listed in Table 2(f). These average values are shown in Figure 2(b) they are separate effect of each factor and are commonly called main effects.
Table 2(f) Average η for different factor levels
Factor
Levels
1 2 3
A Reaction Temp
(⁰C)
36.93* 36.44 35.69
B Catalyst Concentration (wt %)
36.51* 36.30 36.26
C Molar
ratio(Methanol/ Oil)
36.46* 36.36 36.24
D Reaction Time(min)
36.30 36.32 36.44*
Figure 2(b) Plots of factor effects 2.3. Selecting optimum factor levels
Our goal in this experiment is to maximize the yield of Fatty Acid Methyl Ester (FAME). Since –log depicts a monotonic decreasing function, we have to maximize η. Hence the optimum level for a factor is the level that gives the highest value of η in the experimental region. From Figure 2(b) and the Table 2(f), it is observed that the optimum settings of reaction temp, catalyst concentration (wt %), molar ratio (methanol/oil) and reaction time are A1, B1, C1 and D3. Hence we can conclude that the setting A1B1C1D3 can give the highest η for Neem Oil Methyl Ester.
2.4. Developing the additive model for factor effects
The relation between η and the process parameters A, B, C and D can be approximated adequately by the following additive model:
𝑛 𝐴𝑖+ 𝐵𝑗 + 𝐶𝑘+ 𝐷𝑙 =𝑚+ 𝑎𝑖 +𝑏𝑗 + 𝑐𝑘+ 𝑑𝑙+
𝑒
International Journal of Research (IJR)
e-ISSN: 2348-6848, p- ISSN: 2348-795X Volume 2, Issue 08, August 2015Available at http://internationaljournalofresearch.org
involving two or more factors are not allowed. The above equation is utilized in predicting the S/N ratio at optimum factor levels.
2.5. Analysis of Variance (ANOVA)
Different factors affect the yield of NOME to a different degree. The relative magnitude of the factor effects are listed in Table 2(f). A better feel for the relative effect of the different factors is obtained by the decomposition of variance, which is commonly called as analysis of variance (ANOVA). This is obtained first by computing the sum of squares.
𝑇𝑜𝑡𝑎𝑙𝑆𝑢𝑚𝑜𝑓𝑆𝑞𝑢𝑎𝑟𝑒𝑠= 9𝑖=1𝑛𝑖2 =
(37.14)2+ (36.85)2+⋯ …. . + (35.55)2 = 11898.80
𝑆𝑢𝑚𝑜𝑓𝑆𝑞𝑢𝑎𝑟𝑒𝑠𝐷𝑢𝑒𝑡𝑜𝑀𝑒𝑎𝑛
= 𝑁𝑢𝑚𝑏𝑒𝑟𝑜𝑓𝐸𝑥𝑝. 𝑋 𝑚2
= 9 𝑋 (36.35)2= 11891.90
𝑇𝑜𝑡𝑎𝑙𝑆𝑢𝑚𝑜𝑓𝑆𝑞𝑢𝑎𝑟𝑒𝑠(𝑆𝑢𝑚𝑜𝑓𝑆𝑞𝑢𝑎𝑟𝑒𝑠𝑜𝑓𝑎𝑙𝑙
9 𝐸𝑥𝑝𝑒𝑟𝑖𝑚𝑒𝑛𝑡𝑠) = 𝑛𝑖– 𝑚 2 9
𝑖=1
= 2.54
𝑆𝑢𝑚𝑜𝑓 𝑆𝑞𝑢𝑎𝑟𝑒𝑠𝑑𝑢𝑒𝑡𝑜𝑓𝑎𝑐𝑡𝑜𝑟𝐴
= 𝑁𝑢𝑚𝑏𝑒𝑟𝑜𝑓𝐸𝑥𝑝𝑒𝑟𝑖𝑚𝑒𝑛𝑡𝑠𝑎𝑡𝑙𝑒𝑣𝑒𝑙𝐴1 × 𝑚𝐴1 – 𝑚 2
+ 𝑁𝑢𝑚𝑏𝑒𝑟𝑜𝑓𝐸𝑥𝑝𝑒𝑟𝑖𝑚𝑒𝑛𝑡𝑠𝑎𝑡𝑙𝑒𝑣𝑒𝑙𝐴2 × 𝑚𝐴2 – 𝑚 2
+ 𝑁𝑢𝑚𝑏𝑒𝑟𝑜𝑓𝐸𝑥𝑝𝑒𝑟𝑖𝑚𝑒𝑛𝑡𝑠𝑎𝑡𝑙𝑒𝑣𝑒𝑙𝐴3 × 𝑚𝐴3 – 𝑚 2
= 3 × 36.93−36.35 2 + 3 × 36.44−36.35 2
+ 3 × 35.69−36.35 2 = 2.34
𝑆𝑢𝑚𝑜𝑓𝑆𝑞𝑢𝑎𝑟𝑒𝑠𝑑𝑢𝑒𝑡𝑜𝑓𝑎𝑐𝑡𝑜𝑟𝐵 =
𝑁𝑢𝑚𝑏𝑒𝑟𝑜𝑓𝐸𝑥𝑝𝑒𝑟𝑖𝑚𝑒𝑛𝑡𝑠𝑎𝑡𝑙𝑒𝑣𝑒𝑙𝐵1 × 𝑚𝐵1 –𝑚2+ 𝑁𝑢𝑚𝑏𝑒𝑟 𝑜𝑓 𝐸𝑥𝑝𝑒𝑟𝑖𝑚𝑒𝑛𝑡𝑠 𝑎𝑡 𝑙𝑒𝑣𝑒𝑙 𝐵2× 𝑚𝐵2 –𝑚2+ 𝑁𝑢𝑚𝑏𝑒𝑟 𝑜𝑓 𝐸𝑥𝑝𝑒𝑟𝑖𝑚𝑒𝑛𝑡𝑠 𝑎𝑡 𝑙𝑒𝑣𝑒𝑙 𝐵3× 𝑚𝐵3 – 𝑚2=3×36.51−36.352+ 3×36.30−36.352+
3 × 36.26−36.35 2 = 0.11
𝑆𝑢𝑚𝑜𝑓𝑆𝑞𝑢𝑎𝑟𝑒𝑠𝑑𝑢𝑒𝑡𝑜𝑓𝑎𝑐𝑡𝑜𝑟𝐶 =
𝑁𝑢𝑚𝑏𝑒𝑟𝑜𝑓𝐸𝑥𝑝𝑒𝑟𝑖𝑚𝑒𝑛𝑡𝑠𝑎𝑡𝑙𝑒𝑣𝑒𝑙𝐶1 × 𝑚𝐶1 –𝑚2+ 𝑁𝑢𝑚𝑏𝑒𝑟 𝑜𝑓 𝐸𝑥𝑝𝑒𝑟𝑖𝑚𝑒𝑛𝑡𝑠 𝑎𝑡 𝑙𝑒𝑣𝑒𝑙 𝐶2× 𝑚𝐶2 –𝑚2+ 𝑁𝑢𝑚𝑏𝑒𝑟 𝑜𝑓 𝐸𝑥𝑝𝑒𝑟𝑖𝑚𝑒𝑛𝑡𝑠 𝑎𝑡 𝑙𝑒𝑣𝑒𝑙 𝐶3× 𝑚𝐶3 – 𝑚2=3×36.46−36.352+ 3×36.36−36.352+
3 × 36.24−36.35 2 = 0.07
𝑆𝑢𝑚𝑜𝑓𝑆𝑞𝑢𝑎𝑟𝑒𝑠𝑑𝑢𝑒𝑡𝑜𝑓𝑎𝑐𝑡𝑜𝑟𝐷 =
𝑁𝑢𝑚𝑏𝑒𝑟𝑜𝑓𝐸𝑥𝑝𝑒𝑟𝑖𝑚𝑒𝑛𝑡𝑠𝑎𝑡𝑙𝑒𝑣𝑒𝑙𝐷1 × 𝑚𝐷1 –𝑚2+ 𝑁𝑢𝑚𝑏𝑒𝑟 𝑜𝑓 𝐸𝑥𝑝𝑒𝑟𝑖𝑚𝑒𝑛𝑡𝑠 𝑎𝑡 𝑙𝑒𝑣𝑒𝑙 𝐷2× 𝑚𝐷2 –𝑚2+ 𝑁𝑢𝑚𝑏𝑒𝑟 𝑜𝑓 𝐸𝑥𝑝𝑒𝑟𝑖𝑚𝑒𝑛𝑡𝑠 𝑎𝑡 𝑙𝑒𝑣𝑒𝑙 𝐷3× 𝑚𝐷3 – 𝑚2=3×36.30−36.352+ 3×36.32−36.352+
3 × 36.44−36.35 2 = 0.03
International Journal of Research (IJR)
e-ISSN: 2348-6848, p- ISSN: 2348-795X Volume 2, Issue 08, August 2015Available at http://internationaljournalofresearch.org
respectively. Now all these sum of squares are tabulated in Table 2(g) this is called as the ANOVA table.
Table 2(g) ANOVA table for η (S/N Ratio)
Fac tor De gr ee of fr ee d om S u m of sq u ar es M ean sq u ar e =S u m of squ ar es/Deg re e of f re ed om F Contr ib u tio n (%) A Re ac tion T em p ( ⁰ C)
2 2.34 1.170 46. 8 92.1 2 B Cat alyst Conce n t rat ion (w
t %)2 0.11 0.055 2.2 4.33
C M olar Rat io (M ethan ol /Oil
) 2 0.07 0.035 1.4 2.76
D Re ac tion T ime (m in
) 2 0.03 0.015 0.6 0.79
E
rr
or 0 0
T
ot
al 8 2.54
(Er
ror
) (4
) 0.10 0.025
In the present study, the degrees of freedom for the error will be zero. Hence an approximate estimate of the error sum of squares is obtained by pooling the sum of squares corresponding to the factors having the lowest mean square. The parameters C and D are used to estimate the error sum of squares. They account for four degrees of freedom and their sum of squares is 0.10. Referring to the sum of squares in table, the parameter A makes the largest contribution 92.12% to the total sum of squares. The factors B, C and D make 4.33 %, 2.76% and 0.79% each. The larger the contribution of a particular parameter to the total sum of squares, the larger the ability is of that factor to influence S/N ratio. Moreover, the larger F-value, the larger will be the factor effect in comparison to the error mean square.
Degrees of freedom
The degrees of freedom associated with the grand total sum of squares are equal to the number of rows in the design matrix.
The degree of freedom associated with the sum of squares due to mean is one.
The degrees of freedom associated with the total sum of squares will be equal to the number of rows in the design matrix minus one.
International Journal of Research (IJR)
e-ISSN: 2348-6848, p- ISSN: 2348-795X Volume 2, Issue 08, August 2015Available at http://internationaljournalofresearch.org
The degrees of freedom for the error will be equal to the degrees of freedom for the total sum of squares minus the sum of the degrees of freedom for the various factors.
In the present experiment, the degrees of freedom for the error will be zero. Hence an approximate estimate of the error sum of squares is obtained by pooling the sum of squares corresponding to the factors having the lowest mean square. As a rule of thumb, the sum of squares corresponding to the bottom half of the factors (as defined by lower mean square) are used to estimate the error sum of squares. In the present experiment, the factors C and D are used to estimate the error sum of squares. Together they account for four degrees of freedom and their sum of squares is 0.10.
2.6. Interpretation of ANOVA table
The major inferences from the ANOVA table are given in this section. Referring to the sum of squares in Table 2(g) the factor A makes the largest contribution to the total sum of squares [(2.34/2.54) x 100 = 92.12%]. The factor B makes the next largest contribution (4.33%) to the total sum of squares, whereas the factors C and D make only 2.76% and 0.79% contribution respectively. The larger the contribution of a particular factor to the total sum of squares, the larger the ability is of that factor to influence η. Moreover, the larger the F-value, the larger will be the factor effect in comparison to the error mean square or the error variance.
2.7. Prediction of η under optimum conditions
In the present experiment, the identified optimum condition or the optimum level of factors is A1B1C1D3. The value of η under the optimum condition is predicted using the additive model as
𝑛𝑜𝑝𝑡 =𝑚+ 𝑚𝐴1− 𝑚 + 𝑚𝐵1− 𝑚
+ 𝑚𝐶1− 𝑚 + 𝑚𝐷3− 𝑚 + 𝑒 = 36.35 + 36.93−36.35 + 36.51−36.35
+ 36.46−36.35
International Journal of Research (IJR)
e-ISSN: 2348-6848, p- ISSN: 2348-795X Volume 2, Issue 08, August 2015Available at http://internationaljournalofresearch.org
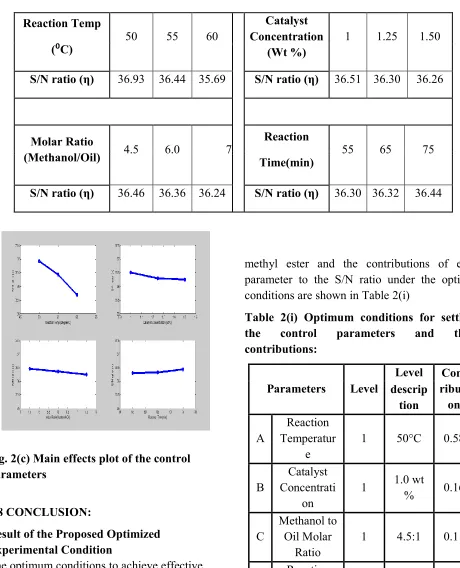
Table 2(h) Main effects plot of the control parameters
Fig. 2(c) Main effects plot of the control parameters
2.8 CONCLUSION:
Result of the Proposed Optimized
Experimental Condition
The optimum conditions to achieve effective performance for the production of neem oil
methyl ester and the contributions of each parameter to the S/N ratio under the optimal conditions are shown in Table 2(i)
Table 2(i) Optimum conditions for settling the control parameters and their contributions:
Parameters Level
Level Cont ributi
on descrip
tion
A
Reaction Temperatur
e
1 50°C 0.58
B
Catalyst Concentrati
on
1 1.0 wt
% 0.16
C
Methanol to Oil Molar
Ratio
1 4.5:1 0.11
D Reaction
Time 3 75 min 0.09
Reaction Temp
(⁰C) 50 55 60
Catalyst Concentration
(Wt %)
1 1.25 1.50
S/N ratio (η) 36.93 36.44 35.69 S/N ratio (η) 36.51 36.30 36.26
Molar Ratio
(Methanol/Oil) 4.5 6.0 7.5
Reaction
Time(min) 55 65 75
International Journal of Research (IJR)
e-ISSN: 2348-6848, p- ISSN: 2348-795X Volume 2, Issue 08, August 2015Available at http://internationaljournalofresearch.org
Total contribution from all parameters 0.94
Current grand average of performance 36.35
Expected result under optimum conditions 37.29
The calculated S/N ratio corresponding to nine set of experiments given in Table 2(d). The average S/N ratios of parameter at each level for neem oil methyl ester are shown in Table 2(f). Also the main effect plot for S/N ratio is shown in Fig 2(c). The average S/N ratio for maximum percentage yield of neem oil methyl ester is obtained at level 1 (Reaction Temperature 50⁰C), level 2 (Catalyst conc. 1.0%by wt), level 3 (Methanol to oil molar ratio 4.5:1) and level 4 (reaction time 75min). i.e., the optimum parameter setting for high percentage yield of neem oil methyl ester is A1B1C1D3. The results of ANOVA for S/N ratios are given in Table 2(g). The percentage of yield of neem oil methyl ester has been significantly improved using Taguchi Method.
The Taguchi method, which uses a set of orthogonal arrays for performing the fewest experiments, was employed to design experimental trials, with an ANOVA performed to more systematically analyze the relative importance of each experimental parameter on the production of neem oil methyl ester.
The reaction temperature, catalyst concentration and methanol to oil molar ratio were found to be significant parameters affecting the production of neem oil methyl ester. The contribution of the reaction temperature on the production process
was larger than that of any other parameter. The yield of neem oil methyl ester obtained with the optimal experimental parameters was greater than that obtained from experiment no.1, which gave the highest yield from the experimental trials, and the theoretically expected value.
The experiments conducted under the optimized conditions showed a meaningful enhanced process performance. The Taguchi method provided a systematic and efficient mathematical approach to evaluate and optimize the process for the production of neem oil methyl ester, using only a few well-defined ex-perimental sets for the optimization of the parameters.
Cost Analysis:
Sl.No. Component Cost (Rs.)
1 Sodium Hydroxide
(Catalyst) 23/kg
2 Potassium hydroxide
(Catalyst) 36/kg
3 Neem oil (Feedstock ) 150/ litre
4 Methanol (Alcohol) 35/ litre
5 Glycerin (By product of
Biodiesel) 75/ litre
Sl. No. Component Cost (Rs.)
1 Neem Oil – 100 ml 15
2
Two step
transesterification Cost - 65 ml (45 ml + 20 ml ) of Methanol
International Journal of Research (IJR)
e-ISSN: 2348-6848, p- ISSN: 2348-795X Volume 2, Issue 08, August 2015Available at http://internationaljournalofresearch.org
[4.5 Methanol/Oil Molar Ratio ]
3 Catalyst KOH 1.0 gm 0.036
4 Recovery ( Glycerin 50
ml ) 3.75
5 Total Cost ( 1 + 2 + 3 –
4 )
17.311 – 3.75 = 13.561
Biodiesel production from 1 litre Neem Oil=0.70 Litre
So Cost of Biodiesel per litre = [(13.561 /100)*1000] / 0.70 = 193.73 Rs.
The cost of the biodiesel production can be minimized as possible to recover the used methanol. Recycling of methanol again and again in mass production and commercial use, the cost must be come to the lowest amount. Also the by-product such as glycerin and soap play an important role to minimize the cost.
3. INFERENCE
From all the experimentation performed above, it can be clearly observed that Neem Oil Methyl Ester (NOME) can be obtained by two step transesterification process only as the FFA content of neem oil is large. By using single step transesterification, the yield will be very less and in some case NOME cannot be obtained.
Taking together all these results, the optimized biodiesel yield of 74.30% was produced at reaction time of 75 min, catalyst amount of 0.50 g, temperature of 50°C, and methanol/oil molar ratio of 4.5.
ANOVA analysis showed that the temperature had the highest effect on the biodiesel yield
followed by catalyst amount, methanol to oil molar ratio and reaction time
The result of this work showed that the maximum yields were obtained at lowest factor values. This will definitely have economic advantage on neem oil biodiesel production as low energy cost, low catalyst amount, low methanol/oil molar ratio, and low temperature are able to produce high biodiesel yield.
This was in agreement with the works of Awolu and Layokun, Meher et al., Jeong et al. and Marchetti and Errazu.
4. RECOMMENDATIONS.
In the optimization of parameters, KOH catalyst has been used with different concentration (1.0%, 1.25% and 1.5%) with the other parameters like methanol to oil molar ratio, reaction temperature and reaction time.
So, we can further do the optimization by using different catalyst types (NaOH, KOH and NaOCH₃), catalyst concentration, reaction temperature and methanol to oil ratio with three levels.
So Four Parameters and Three Level
No of experiment required = 3*3*3*3 =81. But by using Taguchi Method of optimization
No of experiment required = 9 only.
5. KEY REFERENCES
[1.] Abebe K. Endalew, Yohannes Kiros, Rolando Zanzi. Heterogeneous catalysis for biodiesel production from Jatropha curcas oil (JCO). Energy 2011; Vol. 36: pp.
International Journal of Research (IJR)
e-ISSN: 2348-6848, p- ISSN: 2348-795X Volume 2, Issue 08, August 2015Available at http://internationaljournalofresearch.org
[2.] Atul Dhar, Roblet Kevin, Avinash Kumar Agarwal. Production of biodiesel from high-FFA neem oil and its performance, emission and combustion characterization in a single cylinder DICI engine. Fuel Processing Technology 2012; Vol. 97: pp. 118–129.
[3.] Ayhan Demirbas. Progress and recent trends in biodiesel fuels. Energy Conversion and Management 2009; Vol. 50: pp. 14 -34.
[4.] C. Martín , A. Moure , G. Martín ,E. Carrillo , H. Domínguez , J.C. Parajó. Fractional characterization of jatropha, neem, moringa, trisperma, castor and candlenut seeds as potential feedstocks for biodiesel production in Cuba. Biomass Bioenergy 2010; Vol. 34: pp. 533-538.
[5.] Deepak Tanwar, Ajayta, Dilip Sharma, Y. P. Mathur. Production and Characterization of Neem Oil Methyl Ester. International Journal of Engineering Research & Technology (IJERT) 2013; Vol. 2. : pp. 1896-1903.
[6.] Dennis Y.C. Leung, Xuan Wu, M.K.H. Leung. A review on biodiesel production using catalyzed transesterification. Applied Energy 2010; Vol. 87: pp. 1083-1095. .
[7.] E.F. Aransiola, E Betiku, DIO Ikhuomoregbe and TV Ojumu. Production of biodiesel from crude neem oil feedstock and its emissions from internal combustion engines. African Journal of Biotechnology 2012; Vol. 11: pp. 6178-6186
[8.] Freedman B, R. Butterfield and E. Pryde. Transesterification kinetics of
soybean oil. Journal of the American oil Chemists Society 1986; Vol. 63: pp. 1375-80.
[9.] Fukuda H., A. Kondo and H. Noda. Biodiesel fuel production by transesterification of oils. Journal of Bioscience and Bioengineering 2001; Vol. 92: pp. 405-16.
[10.] GT Jeong, HS Yang, DH Park. Optimization of transesterification of animal fat ester using response surface methodology. Bioresour. Technol 2009; Vol. 100: pp. 25-30.
[11.] H.N.Pandey. Development of a New Catalyst for Bio-diesel Production. Ist International Conference on New Frontiers in Biofuels, DTU January 18-19, 2010, New Delhi.
[12.] H Ibrahim, A. S. Ahmed, I.M. Bugaje, Dabo Mohammed, C. D. Ugwumma. Synthesis of Bulk Calcium Oxide (Cao) Catalyst and its Efficacy for Biodiesel Production. Journal of Energy Technologies and Policy 2013; Vol. 3. : pp. 14-16.
[13.] Jon Von Gerpen. Biodiesel processing and production. Fuel Process Technol 2005; Vol. 86: pp. 1097–1107.
[14.] J.M. Marchetti, A.F Errazu. Esterification of free fatty acids using sulfuric acid as catalyst in the presence of triglycerides. Biomass. Bioenerg. 2008; Vol. 32: pp. 892–895.
International Journal of Research (IJR)
e-ISSN: 2348-6848, p- ISSN: 2348-795X Volume 2, Issue 08, August 2015Available at http://internationaljournalofresearch.org
Antonio A. Romero and Cristóbal Verdugo-Escamilla, Production of a Biofuel that Keeps the Glycerol as a Monoglyceride by Using Supported KF as Heterogeneous Catalyst . Energies 2014; Vol. 7: pp. 3764-3780.
[16.] L.C. Meher, D. Vidya Sagar, S.N. Naik. Technical aspects of biodiesel production by transesterification – a review. Renew. Sustain. Energy 2006; Vol. 10: pp. 248-268.
[17.] Madhu Agarwal, Kailash Singh, Ushant Upadhyaya and S P Chaurasia, Potential vegetable oils of Indian origin as biodiesel feedstock – An experimental study. Journal of Scientific & Industrial Research 2012; Vol. 71: pp. 285-289.
[18.] Maryam Hassani, Ghasem D Najafpour, Maedeh Mohammadi and Mahmood Rabiee. Preparation, Characterization and Application of Zeolite-based Catalyst for Production of Biodiesel from Waste Cooking Oil. Journal of Scientific & Industrial Research 2014; Vol. 73: pp. 129-133.
[19.] M A Hanna, Loren Isom and John Campbell, Biodiesel; Current perspectives and future. Journal of Scientific & Industrial Research 2005; Vol. 64: pp. 854-857.
[20.] Md. Hasan Alia, Mohammad Mashud, Md. Rowsonozzaman Rubel, Rakibul Hossain Ahmad, Biodiesel from Neem oil as an alternative fuel for Diesel engine. Procedia Engineering 2013; Vol. 56: pp. 625 – 630.
[21.] M.A. Fazal, A.S.M.A. Haseeb and H.H. Masjuki. Biodiesel feasibility study: An evaluation of material compatibility; performance; emission and engine durability. Renew. Sustain. Engy Reviews 2011; Vol.15: pp. 1314-1324.
[22.] Module 5, Lecture 4. Design for Reliability and Quality. IIT, Bombay.
[23.] Muthu, V. SathyaSelvabala, T. K. Varathachary, D. Kirupha Selvaraj, J. Nandagopal and S. Subramanian. Synthesis of biodiesel from neem oil using sulfated zirconia via tranesterification. Brazilian Journal of chemical Engineering 2010; Vol. 27: pp. 601-608.
[24.] N.Satya Sree, V.Madhusudhan Rao, P.Vijetha. Production of Bio-Diesel From Soap Stock of Cotton Seed Oil By Using Ferric Sulphate Catalyst Via A Two Step Heterogeneous Catalysis: Characteristics of Bio-Diesel Produced. International Journal of Scientific & Technology Research 2014; Vol. 3. : pp. 141-144.
[25.] Nielsen P. M., J. Brask and Fjerbaek. Enzymatic biodiesel production: Technical and economical considerations. European Journal of Lipid Science 2008; Vol. 110: pp. 692-700.
International Journal of Research (IJR)
e-ISSN: 2348-6848, p- ISSN: 2348-795X Volume 2, Issue 08, August 2015Available at http://internationaljournalofresearch.org
[27.] Padmarag Deshpande, Kavita Kulkarni, A.D.Kulkarni. Supercritical Fluid Technology in Biodiesel Production: A Review. Chemistry and Materials Research 2011; Vol. 1. : pp. 27-32.
[28.] Poonam Gera, S.K.Puri and M.K. Jha. Use of Basic Heterogeneous Catalysts for Biodiesel Production: A Review. Ist International Conference on New Frontiers in Biofuels, DTU January 18-19, 2010, New Delhi.
[29.] Suman Singh, P.K.Omre, Kirtiraj Gaikwad. Standardization of Process Parameters for Neem Oil & Determination of Properties for Using as a Fuel. International Journal of Engineering Research and General Science 2014; Vol. 2. : pp. 1-7.
[30.] Talebian-Kiakalaieh, N. A. S. Amin, A. Zarei, H. Jaliliannosrati. Biodiesel Production from High Free Fatty Acid Waste Cooking Oil by Solid Acid Catalyst. Proceedings of the 6th International Conference on Process Systems Engineering (PSE ASIA) 25 - 27 June 2013, Kuala Lumpur.
[31.] Vivek and A. K. Gupta. Biodiesel production from karanja oil. Journal of Scientific & Industrial Research 2004; Vol. 63: pp. 39-47.
[32.] V. Manieniyan, R.Senthilkumar and Dr. S. Sivaprakasam. Experimental Investigation on Optimized Biodiesel (Based on Various Catalysts) used in a Twin Cylinder Diesel Engine. Ist International