Modeling and Simulation of DSTATCOM for
Power Quality Enhancement in Distribution
System
N.Raveendra1, V.Madhusudhan2, A.Jaya Laxmi3
Associate Professor, MRECW, Telengana, India1
KSRM College of Engineering, Andhra Pradesh, India2
JNTUH College of Engineering, Andhra Pradesh, India 3
ABSTRACT: This paper presents the systematic procedure of the modelling and simulation of a Distribution
STATCOM (D-STATCOM) for power quality problems with unbalanced load a based on four different Pulse Width Modulation techniques. Power quality is an occurrence manifested as a nonstandard voltage, current or frequency that results in a failure of end use equipment’s. The major problems dealt here is the voltage, swell and with unbalanced loads. To solve this problem, custom power devices are used. One of those devices is the Distribution STATCOM (D-STATCOM), which is the most efficient and effective modern custom power device used in power distribution networks. D-STATCOM injects a current in to the system to correct the voltage sag, swell and unbalanced load. The control of the Voltage Source Converter (VSC) is done with the help of SPWM, SVPWM, sub-harmonic PWM and Triangular PWM. The proposed D-STATCOM is modelled and simulated using MATLAB/SIMULINK software.
KEYWORDS: Distribution STATCOM (DSTATCOM), MATLAB/ SIMULINK, Power quality problems.
I.POWER QUALITY PROBLEMS
The power disturbances occur on all electrical systems, the sensitivity of today's sophisticated electronic devices make them more susceptible to the quality of power supply. For some sensitive devices, a momentary disturbance can cause scrambled data, interrupted communications, a frozen mouse, system crashes and equipment failure etc [2]. A power voltage spike can damage valuable components. Power quality problems encompass a wide range of disturbances such as voltage sags, swells, flickers, harmonic distortion, impulse transients, and interruptions.
II.DISTRIBUTION STATIC COMPENSATOR (D-STATCOM)
A D-STATCOM (Distribution Static Compensator), which is schematically depicted in Fig.1, consists of a two-level Voltage Source Converter (VSC), a dc energy storage device, a coupling transformer connected in shunt to the distribution network through a coupling transformer. Suitable adjustment of the phase and magnitude of the D-STATCOM output voltages allows effective control of active and reactive power exchanges between the D-D-STATCOM and the ac system. Such configuration allows the device to absorb or generate controllable active and reactive power [7].
Fig.1.Schematic diagram of D-STATCOM.
The shunt injected current Ish can be written as,
ISH=IL-IS
Where Is=
Therefore
ISH=IL-IS=IL
-Or
The complex power injection of the D-STATCOM cab be expressed as
SSH=VLISH
It may be mentioned that the effectiveness of the D-STATCOM in correcting voltage sag depends on the value of ZTH or fault level of the load bus. When the shunt injected current ISH is kept in quadrature with VL, the desired voltage correction can be achieved without injecting any active power into the system. On the other hand, when the value of ISH is minimized, the same voltage correction can be achieved with minimum apparent power injection into the system.
III.METHODOLOGY
To enhance the performance of distribution system, STATCOM was connected to the distribution system. D-STATCOM was designed using MATLAB - SIMULINK version R2010b [6].
D-STATCOM Simulations and Results for THD Total harmonic distortion, or THD, is the summation of all harmonic components of the Voltage or current waveform compared against the fundamental component of the voltage or current wave:
IV.SIMULATION MODEL AND RESULTS
a. Simulation model without DSTATCOM.
Fig.2. Simulation model of without DSTATCOM.
Fig.3.Source voltage and source current and load current without DSTATCOM.
Fig.4.Total harmonic distortion for without DSTATCOM.
Vs ,Is
g a te pu l ses L PF LP F
Vabc
Ia
bc
AB C
abcvi Va bc Ia bc A B C a b c t
sc op e 6 sco p e 5 sco pe 3
sco p e 2
Dis cret e, T s = 5e -00 5 s .
p owe rg ui
dq 0 sin _cosab c ab c
s in_cosd q0 a bc_ to _d q0 T ran sf or mation
V t v + -Va bc Ia bc A B C a b c V l,Il g A +
-gABC
+
-2 e 3 Ucr Va bc Ia bc A B C a b c
A B C
a b c
A B C A B C
AB C
AB C
Te rm i n ato r1 T erm i n a tor
I abc_ c I abc* Pu lses Sco p e 9
Sc op e 8 S co p e7
Sco p e 6
Sc op e 5
Sco p e 4
Sco p e 3
Sco p e 2
S co pe 1 0 S co p e1
NOT Iso u rce
[Il o ad ] Il o a d1
-T-Ic
[Il ] Go to 8
[Ip u l se ] Go to
0Ga i n3 K
-Ga i n 2
1 Ga in 1 [Ipu l se ] From 3
[V t] From 2
[V d c1 ] Fro m 1 [Il o a d ]
Fro m
f(u) Fcn 1
f(u ) Fcn
0.0 2 0 3 4 Disp l a y
s ig nalTH D
sig na lTHD
P I
D iscrete PI Co ntro lle r1
P I
Discre te P I C o ntrolle r
Va bc (pu ) Fre q
wt S in _C os D iscre te 3- pha se PLL
d o u bl e b oo l e a n
i +
-i + -C urr en t Me asu reme nt
3 42 Co n sta n t2
0 Co n stan t1
N A B C 41 5v 5 0h z
2 nd -Ord e r Fi l te r4
Fo =5 0Hz 2 nd -Ord e r Fi lte r3
A B C
a b c
Bre ak er
[V d c1 ] 2 [Ip cc ]
1
2. COMPARISON OF DIFFERENT PWM TECHNIQUES WITH DIFFERENT DISTURBANCES
b. Carrier based PWM simulation model:
Fig.5.Simulation model of with DSTATCOM control of carrier based PWM.
Fig.6.Source voltage and source current and load current with DSTATCOM. Discrete,
Ts = 1e-005 s. pow ergui
g
A
B
C +
-Uni versal B A
B
C
Three-Phase Source
A B C
a b c
Three-Phase Breaker2
A
B
C a
b
c T hree-Phase Breaker1
V
a
b
c A aBb CcThree-Phase
V-I Measurement1 VabcA
B
C a
b
c
T hree-Phase V-I Measurement A
B
C a2 b2 c2 a3
b3 c3
T hree-Phase T ransformer (Three Windings)
A B C A B C
T hree-Phase Series RLC Branch2
A
B C A
B C
Three-Phase Series RLC Branch1
T e
dlata v inv _ref
Subsystem1
Scope1 S
P
Uref Pulses
Dis2 D
1 Constant abc
Mag
Phase
3-P1
abc Mag
Phase 3-P
Fig.7. Total harmonic distortion for with DSTATCOM for carrire baseed PWM.
Fig.5.shows the Matlab/Simulation diagram of the with DSTATCOM,Fig.6.shows the sourec Voltage and current, load current.Fig.7. shows the source current THD for With DSTATCOM for carrire based PWM.
c. Sinusoidal PWM:
Fig.8. Simulation model of with DSTATCOM control of sinusoidal PWM.
Discrete, Ts = 1e-005 s.
pow ergui
g
A
B
C +
-Universal B
A
B
C
Three-Phase Source
VabcA
B
C a
b
c
Three-Phase V-I M easurement
A
B
C a2
b2
c2
a3
b3
c3
Three-Phase Transformer (Three Windings)
A B C A B C
Three-Phase Series RLC Branch3
A B C A B C
Three-Phase Series RLC Branch1
A B C
A B C Thre
Te
dlata v inv _ref
Subsystem1
Scope1
S P
Uref Puls es
Dis2 D
1 Constant
abc Mag
Phase
3-P
Fig.8.shows the Matlab/Simulation diagram of the with DSTATCOM control of sinusoidal PWM,Fig.9. shows the source current THD for With DSTATCOM.
D.Sub-harmonics PWM:
Fig.10. Simulation model of with DSTATCOM control of Sub-harmonics based PWM.
Fig.11. Source current Total harmonic distortion with DSTATCOM for sub-harmonics based PWM.
Fig.10.shows the Matlab/Simulation diagram of the with DSTATCOM control of sub-harmonics based PWM, Fig.11. shows the source current THD for With DSTATCOM.
Vs ,Is
gate pul ses
LP F LP F V a b c Ia b c
A B C
abc
vi Vabc Iabc A B C a b c t
scope 6 scope 5
scope 3
scope 2
Di scre te, T s = 5e-0 05 s.
p owergu i
dq0 si n_co sab c a bc
s in _co s d q0 abc_to_dq0 Transformation Vt v + -Vabc Iabc A B C a b c Vl,Il g A +
-g A BC
+ -2e3 Ucr Va bc Ia bc A B C a b c
A B C
a b c
A B C A B C
A B C
A B C
Termi nator1 Termi nator I abc_c I abc* Pulses S cope9 S cope8 Scope7 Scope6 Scope5 S cope4 Scope3 S cope2 S cope12 S cope10 S cope1 NO T I source [Il oad] I load1 T -Ic [I l] Got o8 [Ipul se] G ot o
0Gai n3 K -Gain2 1 Gai n1 [ Ipulse] From3 [V t] From2 [V dc1] From1 [ Iload] From f(u) Fcn1 f(u) Fcn Di splay
si gna l T HD
si gna lT HD
PI Discrete PI C ontroller1
PI Discrete PI C ontroller
Vab c(pu) Freq wt Si n_Cos Discrete 3-phase PLL doubl e boolean i + -i + -C urrent Measurement
342 Const ant2 0 Constant1 N A B C 415v 50hz
2nd-Order Filt er4
Fo=50Hz 2nd-Order Fi lter3
A B C
a b c
e.Space Vector PWM
Fig.12. Simulation model of with DSTATCOM control of space vector based PWM.
Fig.13. Source current Total harmonic distortion with DSTATCOM for Space Vector based PWM.
Discrete, Ts = 1e-005 s.
pow ergui
g
A
B
C +
-Universal B A
B
C
Three-Phase Source
Vabc A
B
C a
b
c
Three-Phase V-I Measurement A
B
C a2
b2
c2
a3
b3
c3
Three-Phase Transformer (Three Windings)
A B C A B C Three-Phase Series RLC Branch3
A B C A B C
Three-Phase Series RLC Branch1
A B C
A B C
Thre Scope2
Scope1
S P
Pulses
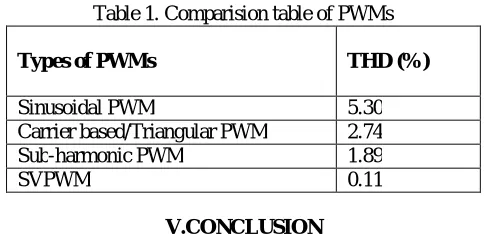
Table 1. Comparision table of PWMs
Types of PWMs THD (%)
Sinusoidal PWM 5.30
Carrier based/Triangular PWM 2.74
Sub-harmonic PWM 1.89
SVPWM 0.11
V.CONCLUSION
This paper has presented the power quality problem such as total harmonic distortion in the distribution system and simulation technique of a D-STATCOM. The simulation results with different PWMs show that, by adding LCL Passive filter to D-STATCOM, the THD reduced within the IEEE STD 519-1992. The power factors may also increase close to unity. Thus, it can be concluded that by adding D-STATCOM with LCL filter and SVPWM the power quality is improved and THD is reduced.
REFERENCES
[1] O. Anaya-Lara, E. Acha, "Modeling and analysis of custom power systems by PSCAD/EMTDC," IEEE Trans. Power Delivery, vol. 17, no. I, pp. 266-272, January 2002.
[2] S.V. Ravi Kumar, S. Sivanagaraju, "Simualgion of D-Statcom and DVR in power system," ARPN jornal of engineering and applied science, vol. 2, no. 3, pp. 7-13, June 2007.
[3] Noramin Ismail, Wan Norainin Wan Abdullah, "Enhancement of Power Quality in Distribution System Using D-STATCOM, " The 4th International Power Engineering and Optimization Conference (PEOCO2010), Shah Alam, Selangor, MALAYSIA. 23-24 June 2010.
4] G. Venkataramana, and BJohnson, "A pulse width modulated power line conditioner for sensitive load centers," IEEE Trans. Power Delivery,vol. 12, pp. 844-849, Apr. 1997.
[5] Rosliomar, Nasrudinabdrahim and Mazizansulaiman "Modeling and simulation for voltage sags/swells mitigation using dynamic voltage restorer (DVR), " journal of theoretical and applied information technology, pp 464-470.
[6] Bhattacharya Sourabh, "Applications of DSTATCOM Using MATLAB/Simulation in Power System," Research Journal of Recent Sciences, Vol. 1(ISC-2011), pp 430-433 (2012).
[7] RoddaShobha Rani, B. Jyothi, "VSC Based DSTATCOM & Pulse-width modulation for Power Quality Improvement," International Journal of Engineering Trends and Technology- Vol. 2, pp 38-41, 2011.