Scholarship@Western
Scholarship@Western
Electronic Thesis and Dissertation Repository
10-9-2018 10:30 AM
DNA Sequence Classification: It’s Easier Than You Think: An
DNA Sequence Classification: It’s Easier Than You Think: An
open-source k-mer based machine learning tool for fast and accurate
source k-mer based machine learning tool for fast and accurate
classification of a variety of genomic datasets
classification of a variety of genomic datasets
Stephen Solis-Reyes
The University of Western Ontario
Supervisor Kari, Lila
The University of Western Ontario
Graduate Program in Computer Science
A thesis submitted in partial fulfillment of the requirements for the degree in Master of Science © Stephen Solis-Reyes 2018
Follow this and additional works at: https://ir.lib.uwo.ca/etd Part of the Bioinformatics Commons
Recommended Citation Recommended Citation
Solis-Reyes, Stephen, "DNA Sequence Classification: It’s Easier Than You Think: An open-source k-mer based machine learning tool for fast and accurate classification of a variety of genomic datasets" (2018). Electronic Thesis and Dissertation Repository. 5792.
https://ir.lib.uwo.ca/etd/5792
This Dissertation/Thesis is brought to you for free and open access by Scholarship@Western. It has been accepted for inclusion in Electronic Thesis and Dissertation Repository by an authorized administrator of
Supervised classification of genomic sequences is a challenging, well-studied
problem with a variety of important applications. We propose an open-source,
supervised, alignment-free, highly general method for sequence classification
that operates on k-mer proportions of DNA sequences. This method was
implemented in a fully standalone general-purpose software package called
Kameris, publicly available under a permissive open-source license.
Com-pared to competing software, ours provides key advantages in terms of data
security and privacy, transparency, and reproducibility. We perform a
de-tailed study of its accuracy and performance on a wide variety of classification
tasks, including virus subtyping, taxonomic classification, and human
hap-logroup assignment. We demonstrate the success of our method on whole
mitochondrial, nuclear, plastid, plasmid, and viral genomes, as well as
ran-domly sampled eukaryote genomes and transcriptomes. Further, we perform
head-to-head evaluations on the tasks of HIV-1 virus subtyping and bacterial
taxonomic classification with a number of competing state-of-the-art software
solutions, and show that we match or exceed all other tested software in terms
of accuracy and speed.
Keywords: sequence classification; machine learning; alignment-free; k-mers;
virus subtyping; comparative genomics; open-source
Chapter3of this thesis contains a version of the article “An open-sourcek-mer based machine learning tool for fast and accurate subtyping of HIV-1 genomes”
by Stephen Solis-Reyes, Mariano Avino, Art Poon, and Lila Kari. It has been
accepted for publication in the journal PLoS One. The author order follows
the conventions of the field: it has two senior authors (LK, AP) and the author
order reflects the contributions of the authors. The individual contributions
are as follows. SSR: data collection; data analysis; methodology and result
interpretation; manuscript draft; manuscript editing; software development.
MA: data analysis; methodology and result interpretation; manuscript editing.
AP: data analysis; methodology and result interpretation; manuscript draft;
manuscript editing. LK: data analysis; methodology and result interpretation;
manuscript draft; manuscript editing.
First, I thank my supervisor, Dr. Lila Kari for her support and guidance –
without her, this thesis would not exist.
Also, I thank my lab-mates Dr. Rallis Karamichalis, Gurjit Randhawa,
and Zhihao Wang for a wide variety of helpful discussions and insights, and
I thank Dr. Art Poon, Dr. Mariano Avino, and Dr. David Smith for their
wealth of biological expertise.
Finally, I thank my parents for their constant encouragement and
sup-port.
Certificate of Examination ii
Abstract iii
Co-Authorship Statement iv
Acknowledgments v
List of Figures viii
List of Tables x
1 Introduction 1
2 Literature review 4
2.1 Biological background . . . 4
2.2 Alignment-based methods . . . 6
2.3 Alignment-free methods . . . 7
2.4 k-mer-based methods . . . 8
2.5 Our approach . . . 10
3 Subtyping of HIV-1 genomes 12 3.1 Introduction . . . 12
3.1.1 Alignment-free subtyping. . . 14
3.1.2 k-mer-based classifiers . . . 15
3.2.1 Supervised classification . . . 17
3.2.2 Unsupervised visualization . . . 20
3.2.3 Implementation . . . 20
3.2.4 Datasets . . . 21
3.3 Results . . . 27
3.4 Discussion . . . 34
4 Taxonomic classification: the general case 41 4.1 Taxonomic classification . . . 41
4.2 Transcriptome data . . . 50
4.3 Intra-species classification . . . 54
4.4 Conclusions . . . 57
5 Conclusions and Future Work 58
Bibliography 63
A How to reproduce Chapter 3 experiments 88
B Lists of subtypes of viral species 91
Curriculum Vitae 97
3.1 Highest accuracy score and average running time across all fif-teen classifiers, at different values of k, for the full set of 6625 whole HIV-1 genomes from the LANL database . . . 28
3.2 MoDMap of 4373 full-length HIV-1 genomes of 9 different pure subtypes or groups, at k = 6 . . . 32
3.3 MoDMap of 4124 full-length HIV-1 genomes of subtypes A, B, and C, at k= 6 . . . 33
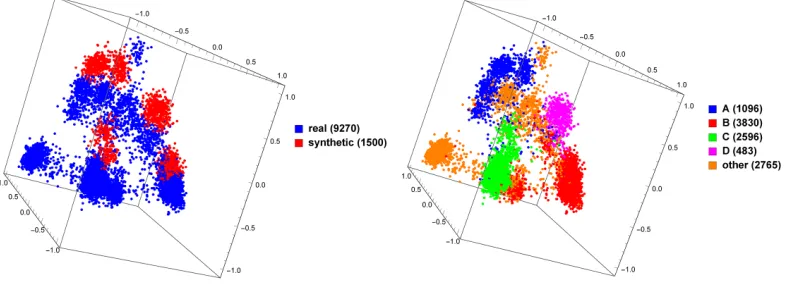
3.4 MoDMap of 9270 natural HIV-1polgenes vs. 1500 synthetically generated HIV-1 pol genes of various subtypes . . . 34
3.5 MoDMap of 5164 whole hepatitis B genomes of 6 different pure subtypes . . . 38
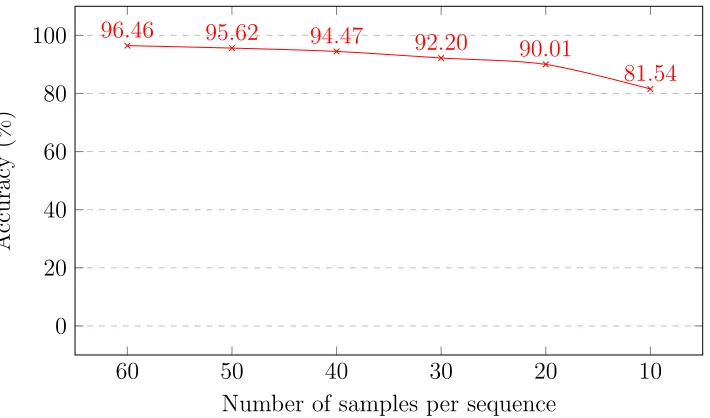
3.6 Classification accuracy scores for the HIV-1 simulated NGS read experiment, with different numbers of samples per sequence (each sample of length 150 bp). . . 39
4.1 MoDMap of whole primate mitochondrial genomes, split into suborders, at k= 6 . . . 48
4.2 MoDMap of whole viral genomes, split into groups, at k= 6 . 48
5.1 Diagram of k-mers in a Chaos Game Representation plot . . . 60
5.2 Plot of RFE-determinedk-mer importance values, formtdna/vertebrates
using the linear SVM classifier atk = 5 . . . 61
posed of different proportions of the human andA.thaliana mi-tochondrial genomes, using a classifier trained on plants, ani-mals, fungi, and protists . . . 62
3.1 Statistics for the manually curated testing datasets . . . 25
3.2 Accuracy scores and running times for each of the fifteen clas-sifiers at k = 6, for the full set of 6625 whole HIV-1 genomes from the LANL database . . . 29
3.3 Classification accuracies for all tested HIV-1 subtyping tools, for each testing dataset from Table 3.1; average accuracy both with and without weighting datasets by the number of sequences they contain . . . 31
3.4 Approximate running times for all tested subtyping tools, for the dataset of van Zyl et al. and all datasets listed in Table 3.3 31
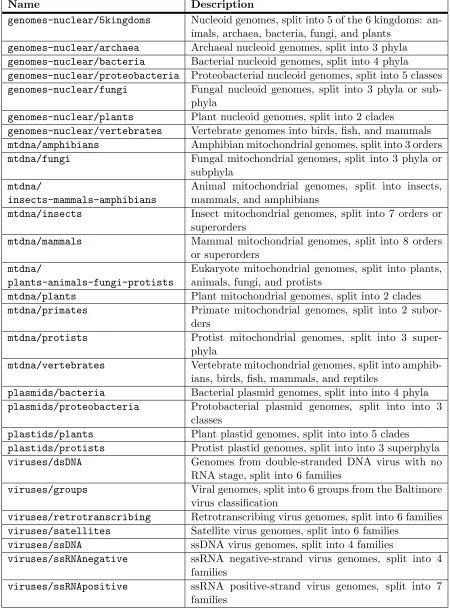
4.1 Descriptions of datasets used for taxonomic classification exper-iments on whole genomes . . . 44
4.2 Statistics for datasets used for taxonomic classification experi-ments on whole genomes . . . 45
4.3 Classification accuracy results for taxonomic classification ex-periments . . . 46
4.4 Classification accuracy and dataset statistics of Kameris vs.
LAF on datasets of whole bacterial genomes . . . 49
4.5 Classification accuracy results for classification of the MMETSP transcriptomes, with different lengths of random samples . . . 51
1,000 Plants Project transcriptomes, with different lengths of random samples . . . 52
4.7 Classification accuracy results for taxonomic classification of MMETSP transcriptomes, with samples of length 50 kbp and different numbers of samples per transcriptome . . . 53
4.8 Classification accuracy results for subtyping of segments of in-fluenza genomes, for full subtypes (H?N?), HA subtype (H?), and NA subtype (N?) . . . 57
Introduction
The sequence classification problem may be stated as follows: given a
set of genomic sequences (in this work, DNA or RNA sequences) partitioned
into some known groups, and a sequence not in the known set, predict which
group the new sequence belongs to. This is an important problem in the field
of bioinformatics because several well-studied, more specific problems are
in-stances of this one: for example, the virus subtyping problem, where we wish
to assign a viral sequence to its subtype, or thetaxonomic classification
prob-lem, where we wish to determine the phylogenetic group of an organism given
some of its genomic sequence data, or the haplogroup identification problem,
where we assign a human mitochondrial sequence to its haplogroup, allowing
the identification of its maternal lineage.
A tremendous variety of methods have been applied to this problem,
including both alignment-based and alignment-free methods. Our goal is to
develop an even better, more efficient, more accurate method than the
state-of-the-art, which we achieve by proposing, in this work, a remarkably simple
but extremely general method. It works by first taking a DNA sequence and
computing a vector of the proportions of every possible k-mer (that is, every
length-ksubstring). These vectors are used as feature vectors, and well-known
supervised classification algorithms are trained on the vectors.
We develop an open-source, easy-to-use, standalone software
imple-mentation of our method, which we call Kameris, available at https:// github.com/stephensolis/kameris, including easy-to-follow setup and use
instructions. As a standalone application, we avoid the need for researchers
to transmit sequence data to a remote server, eliminating privacy and security
concerns. Further, as an open-source application, researchers have full
visibil-ity into the implementation of the algorithm, and can reproduce results at any
time with a copy of a previous version of the software, which is not possible
with an opaque server-based solution.
One goal of this work was straightforward reproducibility of results, and
to that end, every experiment presented here can be easily reproduced by
fol-lowing the step-by-step instructions at https://github.com/stephensolis/
kameris-experiments. On the same page, every sequence and its metadata
from every dataset referenced here is available as well, to aid in future work
building on our results.
We curate and use a large variety of datasets to validate the
perfor-mance of our method, and we compute its accuracy on a variety of tasks. In
Chapter (which is a version of our paper “An open-sourcek-mer based machine
learning tool for fast and accurate subtyping of HIV-1 genomes”, accepted for
publication in PLoS One), we focus on the virus subtyping problem,
demon-strating our performance on the classification of HIV-1, dengue, influenza A,
hepatitis B, and hepatitis C virus genomes; in addition to working with whole
genomes, we demonstrate we maintain high accuracy even when working with
just the HIV-1pol gene and also with randomly sampled HIV-1 genomes.
state-of-the-art HIV-1 subtyping tools, namely CASTOR, COMET, SCUEAL, and REGA,
and show that we match or exceed all in terms of accuracy and speed. In
Chap-ter 4, we go on to consider the taxonomic classification of whole mitochondrial,
nuclear, plastid, plasmid, and viral genomes, and randomly sampled marine
eukaryote and plant transcriptomes, into taxonomic groupings at every level
from kingdom down to genus; and the determination of human haplogroups
from whole mitochondrial genomes. We again perform a head-to-head
compar-ison with a competing tool called LAF on the taxonomic classification of whole
bacterial genomes, and demonstrate a higher classification accuracy. In total,
across all datasets and experiments, we use about 470,000 unique sequences
comprising a total length of over 276 Gbp of sequence data.
We conclude by discussing possible extensions to the current work,
in-cluding a method for identifying particularly important k-mers from the
per-spective of classification, an application to the detection of ‘mixed’ or chimeric
sequences, and even more challenging tasks such as the classification of
unfil-tered next-generation sequencing (NGS) read data and the diagnosis of genetic
Literature review
2.1
Biological background
Earth has a great diversity of living organisms. For thousands of years,
people have sought to categorize these organisms and explore the relationships
between them. In modern use, from most broad to most specific, organisms
are principally organized into the ranks of kingdom, phylum or division, class,
order, family, genus, and species. Species can be further subdivided – for
instance, humans are divided by common ancestry into haplogroups.
In the days before genomics and molecular biology, scientists took a
morphological approach, performing categorization by comparing the form
and structural features of organisms. Nowadays, however, scientists use
in-formation from the DNA of organisms to do this, and many methods have
been proposed for doing so, ranging from DNA barcoding [64], to sequence
alignment, to a wide variety of alignment-free methods.
DNA (deoxyribonucleic acid) is a long stranded molecule which can
be viewed as a string on a four letter alphabet: A, C, G, T, where each letter
represents one of the four basic constituent molecules collectively known as
nucleotides: cytosine (C), guanine (G), adenine (A), and thymine (T). DNA
may exist in either a single-stranded or stranded form – when
double-stranded, each type of nucleotide binds with its complementary pair on the
opposite strand: A pairs with T and C with G. As well, the two strands of
DNA run in opposite directions to each other, so the sequences of each strand
are reverse complements of each other. DNA may be present in several parts of
a cell. For cells with a nucleus or nucleoid, the majority of its genome is located
there. Most eukaryotes have further genetic material in their mitochondria,
as do plants, algae, and some other eukaryotes in their plastids, and bacteria
in plasmid molecules. In Section 4.1, we explore sequence classification using genetic information from each of these regions.
Within an organism, DNA encodes information on how to assemble
proteins. Proteins, large molecules consisting of long chains of amino acids,
are an essential part of every organism and are responsible for a wide range of
functions within a cell. The central dogma of molecular biology, first described
by Crick [29], describes how this encoding works: first, DNA is processed and
spliced into mRNA (messenger RNA) molecules in a process called
transcrip-tion; then, mRNA is translated into proteins by the ribosome. Sequences of
DNA or RNA which code for a specific protein are known as genes, and the
specific portion of the gene directly processed by the ribosome is called the
coding region or CDS (coding sequence) of the gene. The set of all DNA in
an organism is called its genome, the set of all RNA produced during
tran-scription is called the transcriptome, and the set of all coding regions from all
genes is called the exome. In Section 4.1, we explore sequence classification using transcriptome and exome data, and how its performance compares with
In order to use DNA for sequence classification, it is first necessary
to read or sequence it, that is, to determine the order of nucleotides on the
DNA strand. Generally, it is not known how to read more than a few tens
of thousands of nucleotides at a time, so in order to sequence a long DNA
molecule (such as a chromosome), it is necessary to first break the DNA up
into small pieces, read each piece independently, and then use software to
stitch the pieces together based on overlapping fragments in a process known
as sequence assembly. Depending on the sequencing technology being used, it
may be possible to read longer or shorter fragments; so-called next-generation
or high-throughput sequencing methods are able to lower sequencing costs
and increase sequencing speed by reading shorter fragments, usually of a few
hundred nucleotides, and parallelizing the sequencing process, producing
thou-sands or millions of sequences concurrently. However, shorter, more numerous
sequence fragments make sequence assembly more computationally expensive
due to the larger amount of data to be processed. For this reason, it is useful
to have sequence classification methods which do not depend on alignment,
and we explore this use-case in Sections 3.4 and 4.3.
2.2
Alignment-based methods
Alignment-based methods, broadly, are any methods based on
search-ing for base-to-base correspondences in two or more sequences [182]. These
methods measure sequence similarity by computing a score based on the
num-ber of matches and mismatches between sequences – in this way, they may
compute the class of a given query sequence by locating the most similar
se-quence in the known set. There have been many alignment-based tools
and multiple-sequence aligners such as ClustalW [159] and MUSCLE [42].
Since alignment-based tools can report the exact regions of high
simi-larity between a pair of sequences, their output is highly relevant to researchers
and can be used to study functional, structural, or evolutionary relationships
between sequences [110]. On the other hand, alignment-free methods, broadly
defined as any which do not compute base-to-base correspondences, are
of-ten capable of only producing a single similarity score between sequences as
output. But their tradeoffs are very attractive for many applications: they
are much more efficient than alignment in terms of running time and memory
requirements – this is especially relevant when dealing with large datasets,
like those generated by next-generation sequencing (NGS) applications; and
alignment assumes the sequences being compared contain stretches of
well-conserved and common regions, which is an assumption often violated in
re-ality, for example when studying viral genomes with a high rate of mutation
or comparing sequences from entirely different parts of the tree of life.
2.3
Alignment-free methods
In recent years, a great breadth of alignment-free sequence comparison
methods have been proposed. Among these are the conditional Lempel-Ziv
complexity as studied in [4, 9, 10, 73, 100, 103, 119, 166], the closely
re-lated and more general conditional Kolmogorov complexity [45, 93], the
‘mea-sure representation’ as proposed in [178, 179], comparisons between Markov
models [25, 127], average lengths of maximum common substrings [97, 162],
estimates of substitutions or mismatches per site as pioneered by Haubold
et al. [39, 61, 62, 63], the ‘base-base correlation’ [104, 105], and distances
discrimina-tion substrings [44], the Burrows-Wheeler similarity [174], normalized central
moments [36], nearest-neighbor interactions [181], subword composition [28],
prefix codes [38], information correlation [51], the context-object model [176],
spaced word frequencies [70, 98], and many more.
Some of these and others have been applied to sequence classification
specifically, including methods based on nucleotide correlations [106] or
se-quence composition (e.g. COMET [151] and [177]); on restriction enzyme site
distributions, applied to the subtyping of human papillomavirus (HPV),
hep-atitis B virus (HBV) and HIV-1 (CASTOR [137]); based on the ‘natural
vec-tor which contains information on the number and distribution of nucleotides
in the sequence, applied to the classification of single-segmented [177] and
multi-segmented [72] whole viral genomes, as well as viral proteomes [101];
based on neural networks using digital signal processing techniques to yield
‘genomic cepstral coefficient’ features, applied to distinguishing four different
pathogenic viruses [3]; based on different genomic materials (namely DNA
se-quences, protein sese-quences, and functional domains) with information based
on protein clustering and functional domains, applied to the classification of
some viral species at the order, family, and genus levels [165].
2.4
k
-mer-based methods
One particular class of methods for alignment-free sequence
compar-ison well-represented in the literature are those based on the frequencies of
substrings of length k (known as k-mers or k-words).
Blaisdell was the first to use such methods, reporting success in
con-structing accurate phylogenetic trees for mammal alpha and beta-globin genes [15]
au-thors [11, 12, 22, 37, 52, 84, 85, 88, 89] have studied k-mer bias patterns
and found that the excess and scarcity of specific k-mers, across a variety of
different DNA sequence types (including viral DNA in [22]), can be explained
by factors such as physical DNA/RNA structure, mutational events, and some
prokaryotic and eukaryotic repair and correction systems. In addition, Karlin
et al. found that k-mer proportions can play the role of a genomic signature
– that is, a specific quantitative characteristic of a sequence that is pervasive
along the genome of the same organism, while being dissimilar for sequences
originating from different organisms. These two findings give intuition and
jus-tification as to why the information in k-mer occurrence patterns is suitable
as a classifiable feature.
Typically, k-mer frequency or proportion vectors are paired together
with a distance function in order to give a method capable of measuring the
quantitative similarity of any pair of sequences. Common choices of distance
include the Manhattan distance originally proposed by Burge et al. [22], as
seen e.g. in [16, 17, 23, 53, 77, 83, 87, 88, 121, 132, 153]; the weighted or
standardized Euclidean distance, as seen e.g. in [26,33, 65, 92, 123, 145, 171,
172, 175]; and the Jensen-Shannon distance proposed by Sims et al. [148],
as seen e.g. in [147, 148, 164, 170]. These distances and others have been
compared and benchmarked in [31,32,57,60,68,69,75,81,173], and detailed
reviews of the literature can be found in [18,86, 116, 144, 149, 163, 182].
k-mer frequency or proportion vectors have been used to perform
super-vised classification, albeit often with relatively small datasets. For instance,
these vectors have been used to subtype influenza and classify polyoma and
rhinovirus fragments [46], to predict HPV genotypes [154, 155], to classify
whole bacterial genomes to their corresponding taxonomic groups at different
115], to classify 27 microbial nuclear DNA sequences [132], to automatically
learn a distance function for classifying a set of 1076 microbial genomes [123],
to classify hundreds of thousands of short (less than 10,000 base pairs long)
prokaryote sequences into different phylogenetic groups [1, 2, 108], to
distin-guish very short samples of theE.coli and yeast genomes [124], to classify short
bacterial genome fragments from 28 species [142], to classify longer bacterial
genome fragments from 118 species [158], to classify some archaeal and
bacte-rial classes [41], and to classify short splicing-related sequence fragments [117,
128].
2.5
Our approach
Kamerisis a supervised classification method based on k-mer
propor-tion vectors. In this study and as opposed to other studies described, we do
not use just one or a small number of datasets but dozens of datasets covering
a large breadth and depth of genomic sequence data. This allows us to give
more evidence and be more confident of our performance and accuracy on
a wide range of highly biologically-relevant classification tasks, which is not
often done with other algorithms and methods.
Kamerisis fully open-source with all code available on GitHub at the
following URL: https://github.com/stephensolis/kameris, is standalone
and easy to run on any local computer, and is available to all users under
a permissive open-source license. This is as opposed to other tools, some
of which are closed-source and available only as a web interface or are sold
under a commercial license for non-academic users. The fact that Kameris
is standalone makes it possible for researchers to save and reproduce results
data to a remote web server. Further, our open-source implementation makes
it easy for researchers to see all technical details of our method, making our tool
highly transparent. Those benefits do not come at the expense of classification
accuracy, however, since we perform head-to-head evaluations on the tasks of
HIV-1 virus subtyping and bacterial taxonomic classification with a number
of competing state-of-the-art software solutions, and show that we match or
exceed all other tested software in terms of accuracy and speed.
Kameris is very flexible and every experiment presented in this work
can be reproduced by following the step-by-step instructions at https://
github.com/stephensolis/kameris-experiments. Kameris permits the
user to specify their choice of classification algorithm, value ofk, cross-validation
and dimentionality reduction parameters as described in Chapter3when train-ing a model.
Finally, as will be seen in the following chapter, our method is
remark-ably simple, relying only on the counting ofk-mers and well-known supervised
classification algorithms. This is as opposed to other much more complex
methods, some of which use complex distance functions or correlation metrics
and often deep domain-specific biological knowledge – our method is simpler
An open-source
k
-mer based
machine learning tool for fast
and accurate subtyping of
HIV-1 genomes
1
3.1
Introduction
Subtype classification is an important and challenging problem in the
field of virology. Subtypes (also termed clades or genotypes) are a fundamental
unit of virus nomenclature (taxonomy) within a defined species, where each
subtype corresponds to a cluster of genetic similarity among isolates from the
global population. Defined subtype references for hepatitis C virus, for
exam-ple, can diverge by as much as 30% of the nucleotide genome sequence [146],
but there is no consistent threshold among virus species. Many virus subtypes
1A version of this chapter was accepted for publication in PLoS One (S. Solis-Reyes, M.
Avino, A. Poon, and L. Kari)
are clinically significant because of their associations with variation in
patho-genesis, rates of disease progression, and susceptibility to drug treatments and
vaccines [156]. For example, the HIV-1 subtypes originated early in the history
of the global pandemic [169] and have diverged by about 15% of the nucleotide
genome sequence [78]. Rates of disease progression vary significantly among
HIV-1 subtypes and classifying newly diagnosed infections by their genetic
similarity to curated reference subtypes [139] is a recommended component
for the clinical management of HIV-1 infection [27, 67]. Consequently, a
num-ber of algorithms have been developed for the automated determination of
HIV-1 subtypes from genetic sequence data [129, 130, 151].
Today, there are important practical considerations that HIV-1
subtyp-ing algorithms should meet. These include:
1. High Accuracy and Performance: The cost of sequencing is rapidly
decreasing and the amount of sequence data increasing due to
next-generation sequencing (NGS) technologies. Thus, in addition to being
accurate, software must be computationally fast and scalable in order to
handle rapidly growing datasets.
2. Data Security and Privacy: Policy, legal, and regulatory issues can
prohibit patient sequence data from being transmitted to an external
server on the Internet. In addition, concerns around privacy policies
and the possibility of data breaches can cause issues for researchers and
clinicians. For these reasons, software should be made available in an
offline, standalone version.
3. Transparency: With closed-source or proprietary software, it can be
impossible to determine precisely how classification determinations are
of the classification process.
4. Reproducibility: Relying on an externally-hosted service can make it
impossible to determine which version of the software has been used to
generate subtype classifications. This makes it difficult to guarantee that
classification results can be reproduced, and reproducibility is generally
recognized as a necessary component of clinical practice.
In our effort to develop a general sequence classification method satisfying the
above considerations, we propose a simple, intuitive, general-purpose,
highly-efficient technique based onk-mer proportion vectors for supervised nucleotide
sequence classification, and we release an open-source software implementation
of this method (designated Kameris) under a permissive open-source license.
3.1.1
Alignment-free subtyping
Most subtype classification methods for HIV-1 require the alignment of
the input sequence against a set of predefined subtype reference sequences [95],
which enables the algorithm to compare homologous sequence features [40,50,
143]. For example, the NCBI genotyping tool [140] computes BLAST
simi-larity scores against the reference set for sliding windows along the query
sequence. Other methods such as REGA [129] and SCUEAL [130] reconstruct
maximum likelihood phylogenies from the aligned sequences: REGA
(ver-sion 3.0) reconstructs trees from sliding windows of 400 bp from the sequence
alignment and quantifies the confidence in placement of the query sequence
within subtypes by bootstrap sampling (bootscanning) [141].
Alignment-based methods are relatively computationally expensive, especially for long
sequences; the heuristic methods require a number of ad hoc settings, such
well on highly-divergent regions of the genome. To address these limitations,
various alignment-free classification methods have been proposed. Some of
them make use of nucleotide correlations [106], or sequence composition (e.g.
COMET [151] and [177]). Other methods include those based on
restric-tion enzyme site distriburestric-tions, applied to the subtyping of human
papillo-mavirus (HPV), hepatitis B virus (HBV) and HIV-1 (CASTOR [137]); based
on the “natural vector” which contains information on the number and
dis-tribution of nucleotides in the sequence, applied to the classification of
single-segmented [177] and multi-single-segmented [72] whole viral genomes, as well as viral
proteomes [101]; based on neural networks using digital signal processing
tech-niques to yield “genomic cepstral coefficient” features, applied to
distinguish-ing four different pathogenic viruses [3]; and based on different genomic
ma-terials (namely DNA sequences, protein sequences, and functional domains),
applied to the classification of some viral species at the order, family, and
genus levels [165].
3.1.2
k
-mer-based classifiers
The use of k-mer (substrings of length k) frequencies for phylogenetic
applications started with Blaisdell, who reported success in constructing
accu-rate phylogenetic trees from several coding and non-coding nuclear genomes
sequences [14] and some mammalian alpha and beta-globin genes [15]. Other
authors [22,52,84,88,89] have observed that the excess and scarcity of specific
k-mers, across a variety of different DNA sequence types (including viral DNA
in [22]), can be explained by factors such as physical DNA/RNA structure,
mutational events, and some prokaryotic and eukaryotic repair and correction
systems. Typically,k-mer frequency or proportion vectors are paired together
be-tween any pair of sequences. Studies measuring quantitative similarity bebe-tween
DNA sequences from different sources have been performed, for instance using
the Manhattan distance [23,87], the weighted or standardized Euclidean
dis-tance [145, 172], and the Jensen-Shannon distance [147, 148]. Applications of
these distances and others have been compared and benchmarked in [32, 60,
81, 173], and detailed reviews of the literature can be found in [18, 116, 163,
182].
In the context of viral phylogenetics, k-mer frequency or proportion
vectors paired with a distance metric have been used to construct pairwise
dis-tance matrices and derive phylogenetic trees,e.g., dsDNA eukaryotic viruses [170],
or fragments from Flaviviridae genomes [92]. Other studies have investigated
the multifractal properties of k-mer patterns in HIV-1 genomes [120], and
the changes in dinucleotide frequencies in the HIV genome across different
years [121]. We used k-mer proportion vectors to train supervised
classifi-cation algorithms. Similar approaches have previously been explored (with
different classifiers than those used here), for example to subtype Influenza
and classify Polyoma and Rhinovirus fragments [46], to predict HPV
geno-types [154, 155], to classify whole bacterial genomes to their corresponding
taxonomic groups at different levels [167], and to classify whole eukaryotic
mitochondrial genomes [112,113, 114, 115].
To evaluate our method, we curated manually-validated testing sets of
‘real-world’ HIV-1 data sets. We assessed fifteen classification algorithms and
conclude that for these data the SVM-based classifiers, multilayer perceptron,
and logistic regression achieved the highest accuracy, with the SVM-based
classifiers also achieving the lowest running time out of those. We measured
and found that k = 6 provides the optimal balance of accuracy and speed.
Overall, our open-source method obtains a classification accuracy average of
97%, with individual accuracies equal to or exceeding other subtyping methods
for most datasets, and processes over 1,500 sequences per second. Our method
is also applicable to other virus datasets without modification: we demonstrate
classification accuracies of over 90% in all cases for full-length genome data
sets of dengue, hepatitis B, hepatitis C, and influenza A viruses.
3.2
Methods
3.2.1
Supervised classification
First, we needed to determine which supervised classification method
would be the most effective for classifying virus sequences, using their
re-spectivek-mer proportions as feature vectors (numerical representations). We
trained each of 15 classifiers (Table 3.2) on a set S = {s1, s2, . . . sn} of
nu-cleotide sequences partitioned into groups g1, g2, . . . , gp. Given as input any
new, previously unseen, sequence (i.e., not in the dataset S), the method
outputs a prediction of the group gi that the sequence belongs to, having
‘learned’ from the training set S the correspondence between the k-mer
pro-portions of training sequences and their groups. The feature vector Fk(s) for
an input sequences was constructed from the number of occurrences of all 4k
possible k-mers (given the nucleotide alphabet {A, C, G, T}), divided by the
total length of s. Any ambiguous nucleotide codes (e.g., ‘N’ for completely
ambiguous nucleotides) were removed from s before computing Fk(s). As a
concrete example, suppose s = ACT CAGGCA and k = 2. Then, if we use
T C, T G, T T] for 2-mers, thek-mer frequency vector forsis [0,1,1,0,2,0,0,1,0,
1,1,0,0,1,0,0] and thus Fk(s) = [0,0.125,0.125,0,0.25,0,0,0.125,0,0.125,
0.125,0,0,0.125,0,0].
Next, we processed the feature vectors Fk(s) for more efficient use by
classifiers. We rescaled the vectors to have a variance of 1, which satisfies
some statistical assumptions invoked by several classification methods. In
ad-dition, we performed dimensionality reduction using truncated singular value
decomposition [54] to reduce the vectors to 10% of the average number of
non-zero entries of the feature vectors. This greatly reduces running time for most
classifiers while having a negligible effect on classification accuracy.
Finally, we trained a supervised classifier on the vectors Fk(s).
Su-pervised classifiers, in general, can be intuitively thought of as
construct-ing a mappconstruct-ing from the input feature space to another space which in some
sense effectively separates each training class. As a concrete example, the
support vector machine (SVM) classifier maps the input space to another
space of equal or higher dimensionality using a kernel function, and then
se-lects hyperplanes that represent the largest separation between every pair of
classes. Those hyperplanes induce a partition on the transformed space which
is then used for the classification of new items. We tested fifteen different
specific classifier algorithms: 10-nearest-neighbors [5] with Euclidean metric
(10-nearest-neighbors); nearest centroid, to class mean (nearest-centroid-mean) and to class median (nearest-centroid-median) [160]; logistic regression
with L2 regularization and one-vs-rest as the multiclass generalization
decision trees with Gini impurity metric as sub-estimators (random-forest) [20]; AdaBoost with decision trees as the weak learners and the SAMME.R real
boosting algorithm (adaboost) [48, 59]; Gaussian na¨ıve Bayes
(gaussian-naive-bayes) [24]; linear (lda) and quadratic (qda) discriminant analysis [49]; and multi-layer perceptron with a 100-neuron hidden layer,
recti-fied linear unit (ReLU) activation function, and the Adam stochastic
gradient-based weight optimizer (multilayer-perceptron) [66, 91]. We used the im-plementations of these classifiers in the Python library scikit-learn [125] with the default settings.
For some of the results that follow, we required a method for
measur-ing classification accuracy without the need for a separate testmeasur-ing dataset. To
do so, we used 10-fold cross-validation, a technique widely used for
assess-ing the performance of supervised classifiers [136]. N-fold cross-validation is
performed by taking the given dataset and randomly partitioning it into N
groups of equal size. Taking each group in turn, we trained a classifier on the
sequences outside of the selected group, and then computed its accuracy from
predicting the classes of the sequences in the selected group. The outcome
of the cross-validation are N accuracy values for the N distinct, independent
training and testing runs. We report the arithmetic mean of those accuracies
3.2.2
Unsupervised visualization
Supervised classification requires, by definition, a training set
consist-ing of examples of classes determined a priori. However, one may wish to
explore a dataset where the groups are not necessarily all known. For the
problem of virus subtyping for example, one may suspect the existence of a
novel subtype or recombinant. To this end, unsupervised data exploration
techniques are useful, and herein we also explore the use of Molecular
Dis-tance Maps (MoDMaps), previously described in [80,81,82], for this purpose.
After computing the vectorsFk(s), this method proceeds by first constructing
a pairwise distance matrix. In this paper, we use the well-known Manhattan
distance [94], defined between two vectors A = (a1, . . . an) and B = (b1, . . . bn)
as being:
dM(A, B) = n
X
i=1
|ai−bi|.
Next, the distance matrix is visualized by classical MultiDimensional Scaling
(MDS) [19]. MDS takes as input a pairwise distance matrix and produces as
output a 2D or 3D plot, called a MoDMap [79], wherein each point represents a
different sequence, and the distances between points approximate the distances
from the input distance matrix. As MoDMaps are constrained to two or three
dimensions, it is in general not possible for the distances in the 2D or 3D plot
to match exactly the distances in the distance matrix, but MDS attempts to
make the difference as small as possible.
3.2.3
Implementation
We have developed a software package called Kameris which
kameris, and may be used on Windows, macOS, and Linux. Kamerisis im-plemented in Python, with the feature vector computation parts imim-plemented
in C++ for performance. It is packaged so as to have no external dependencies,
and thus is easy to run. The package has three different modes: first, it can
train one or more classifiers on a dataset and evaluate cross-validation
perfor-mance; second, it can summarize training jobs, computing summary statistics
and generating MDS plots; and third, it can classify new sequences on
already-trained models. More information, including usage and setup instructions,
can be found at https://github.com/stephensolis/kameris. All running
time benchmarks of our software were performed on an Amazon Web Services
(AWS) r4.8xlarge instance with 16 physical cores (32 threads) of a 2.3GHz Intel
Xeon E5-2686 v4 processor. We also note that many of the implementations of
the classifier algorithms we use are single-threaded and that performance can
almost certainly be substantially improved by using parallelized
implementa-tions.
3.2.4
Datasets
In this paper, a variety of different datasets were used to validate the
performance of the method. Straightforward reproducibility of results was a
priority in the design of this study, and to that end, every sequence and its
metadata from every dataset referenced here can be retrieved from our GitHub
repository athttps://github.com/stephensolis/kameris-experiments.
Further, instructions for using Kameris to replicate the experiment results
are available in AppendixA.
In some cases, these datasets had few examples for some classes.
classifier does not have enough information to learn, so we wish to omit such
classes from our analysis. However, the minimum number of examples per
class to achieve proper training of a classifier is difficult to estimate; this
num-ber is known to be dependent on both the complexity of the feature vectors
and characteristics of the classifier algorithm being used [74, 135]. Since we
vary bothk and the classifier algorithms in this study, this makes it especially
challenging to empirically determine an adequate minimum class size. Here,
we arbitrarily selected 18 as our minimum, so we omitted from analysis any
subtype with fewer than 18 sequences. It may be that specific values ofk and
some classifier algorithms work well in scenarios with very small datasets, and
we leave this as an open question.
Primary dataset
The primary dataset used was the full set of HIV-1 genomes
avail-able from the Los Alamos (LANL) sequence database, accessible at https:
//www.hiv.lanl.gov/components/sequence/HIV/search/search.html. In
this database, the option exists of using full or partial sequences – in our
anal-ysis, we consider both full genomes and just the coding sequences of the pol
gene. For the set of whole genomes, the query parameters “virus: HIV-1,
ge-nomic region: complete genome, excluding problematic” were used; this gave
a total of 6625 sequences with an average length of 8970 bp. For the set of
pol genes, the query parameters “virus: HIV-1, genomic region: Pol CDS,
excluding problematic” were used; this gave a total of 9270 sequences with an
average length of 3006 bp. In both cases, the query was performed on May
18, 2017, and at the time, the LANL database reported a last update on May
6, 2017. After removing small classes (see preceding section), this dataset
of whole genomes, and 26 for the set of pol genes. The list of subtypes for
this dataset and all other datasets described here are available in Appendix
B. This dataset was used to determine the best value of k, the best classifier algorithm, to compare the performance of whole genomes with pol gene
se-quences only, and to produce the MoDMaps of HIV-1. In those experiments,
cross-validation was used to randomly draw training and testing sets from the
dataset.
Evaluation datasets
To evaluate classifiers trained on HIV-1 sequences and subtype
anno-tations curated by the LANL database, we needed testing sets but wanted
to avoid selecting them from the same database. We manually searched the
GenBank database for large datasets comprising HIV-1pol sequences collected
from a region with known history of a predominant subtype, and evaluated
the associated publications to verify the characteristics of the study
popula-tion (Table 3.1). After selection of the datasets, we wished to obtain labels without relying on another subtyping method. To do so, first we made use of
the known geographic distribution of HIV-1 subtypes, where specific regions
are predominantly affected by one or two particular subtypes or circulating
recombinant forms due to historical ‘founding’ events [157]. Next, we screened
each dataset using a manual phylogenetic subtyping process to verify
sub-type assignments against the standard reference sequences. This was done,
essentially, by reconstructing phylogenetic trees to identify possible subtype
clusters. A cluster was identified as a certain subtype if it included a specific
subtype reference sequence we had initially provided in our datasets. Thus,
the first step was to download the most recent set of subtypes reference
//www.hiv.lanl.gov/content/sequence/NEWALIGN/align.html[99].
We loaded the resulting FASTA file in the eleven datasets from Table
3.1. We then aligned the datasets with MUSCLE v3.8.425 [42], implemented in AliView 1.19-beta-3 [96], where we also visually inspected the alignments.
To avoid overfitting, we searched for the nucleotide model of substitution
that was best supported by each dataset using the Akaike Information
Cri-terion (AIC) in jModeltest v2.1.10 [34]. For the dataset US.Wolf2017, the
large number of sequences precluded this model selection process, so we chose
a General Time Reversible model incorporating an invariant sites category
and a gamma distribution to model rate variation among the remaining sites
(GTR+I+G); this parameter-rich model is often supported by large HIV-1
data sets, and was similar to the model selected by the authors in the original
study [168]. Phylogenetic trees were reconstructed by maximum likelihood
using PHYML v20160207 [56] with a related bootstrap support analysis. The
resulting trees were visualized and their relative sequences were manually
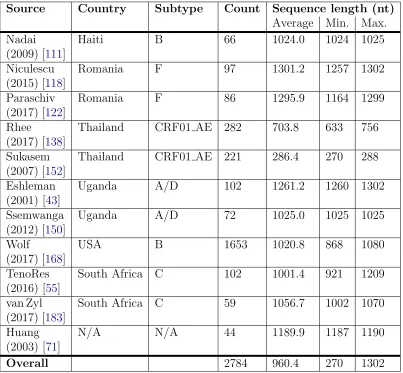
Table 3.1: Statistics for the manually curated testing datasets. The first author, year, and reference number for the publication associated with each data set is listed under the ‘Source’ column heading. The historically most prevalent HIV-1 subtype(s) is indicated under the ‘Subtype’ column heading.
Source Country Subtype Count Sequence length (nt)
Average Min. Max. Nadai
(2009) [111]
Haiti B 66 1024.0 1024 1025
Niculescu (2015) [118]
Romania F 97 1301.2 1257 1302
Paraschiv (2017) [122]
Romania F 86 1295.9 1164 1299
Rhee
(2017) [138]
Thailand CRF01 AE 282 703.8 633 756
Sukasem (2007) [152]
Thailand CRF01 AE 221 286.4 270 288
Eshleman (2001) [43]
Uganda A/D 102 1261.2 1260 1302
Ssemwanga (2012) [150]
Uganda A/D 72 1025.0 1025 1025
Wolf
(2017) [168]
USA B 1653 1020.8 868 1080
TenoRes (2016) [55]
South Africa C 102 1001.4 921 1209
van Zyl (2017) [183]
South Africa C 59 1056.7 1002 1070
Huang (2003) [71]
N/A N/A 44 1189.9 1187 1190
Overall 2784 960.4 270 1302
In order to benchmark performance on this manually curated testing
dataset, we required a separate training dataset. Since the subtype
annota-tions from the full set of HIV-1 genomes in the LANL database are typically
given by individual authors using unknown methods, they may be incorrect at
times, potentially negatively impacting classification performance. Thus, we
trained our classifier on the subset of HIV-1pol sequences from the 2010 Web
alignment from the LANL database, accessible at https://www.hiv.lanl.
is a more curated set ofpol sequences, and is more likely to be correctly
anno-tated. Specifically, we selected ‘Web’ as the alignment type, ‘HIV1/SIVcpz’ as
organism, ‘POL’ as ‘Pre-defined region of the genome’ under ‘Region’, ‘All’ as
subtype, ‘DNA’, and ‘2010’ as the year. Any Simian Immunodeficiency Virus
(SIV) sequences were manually removed from the query results. This gave a
total of 1979 sequences, containing 15 subtypes or CRFs after removal of small
classes.
Other datasets
For another experiment, we generated a set of synthetic HIV-1
se-quences by simulating the molecular evolution of sese-quences derived from the
curated HIV-1 subtype references. To do so, we used a modified version of
the program INDELible [47], assigning one of the subtype reference sequences
to the root of a ‘star’ phylogeny with unit branch lengths and 100 tips. The
codon substitution model parameters, including the transition-transversion
bias parameter and the two-parameter gamma distribution for rate variation
among sites, were calibrated by fitting the same type of model to actual
HIV-1 sequence data [HIV-13HIV-1]. We adjusted the ‘treelength’ simulation parameter to
control the average divergence between sequences at the tips.
Finally, we performed experiments with dengue, influenza A,
hepati-tis B, and hepatihepati-tis C virus sequences. The dengue and influenza sequences
were retrieved from the National Center for Biotechnology Information (NCBI)
Virus Variation sequence database on August 10, 2017. The dengue virus
se-quences were accessed fromhttps://www.ncbi.nlm.nih.gov/genomes/VirusVariation/
Database/nph-select.cgi?taxid=12637with the query options “Nucleotide”,
“Full-length sequences only”, and “Collapse identical sequences” for a
se-quences were accessed from https://www.ncbi.nlm.nih.gov/genomes/FLU/
Database/nph-select.cgi?go=genomeset with the query options “Genome
sets: Complete only”, and “Type: A” for a total of 38215 sequences with an
average length of 13455 bp. Hepatitis B sequences were retrieved from the
Hep-atitis B Virus Database operated by the Institut de Biologie et Chimie des
Pro-teines (IBCP), accessible at https://hbvdb.ibcp.fr/HBVdb/HBVdbDataset?
seqtype=0, on August 10, 2017 for a total of 5841 sequences with an average
length of 3201 bp. Finally, hepatitis C sequences were retrieved from the Los
Alamos (LANL) sequence database, accessible at https://hcv.lanl.gov/
components/sequence/HCV/search/searchi.html, on August 10, 2017,
us-ing the query options “Excludus-ing recombinants”, “Excludus-ing ‘no genotype”’,
“Genomic region: complete genome”, and “Excluding problematic” for a
to-tal of 1923 sequences with an average length of 9140 bp. After removal of
small classes, our data comprised 4 subtypes of dengue virus, 12 subtypes of
hepatitis B, 6 subtypes of hepatitis C, and 56 subtypes of influenza type A.
3.3
Results
Our subtype classification method has two main parameters that may
be varied: namely, the specific classifier to be used, and the value k of the
length of thek-mers to count when producing feature vectors. We begin with
the full set of full-length HIV-1 genomes from the LANL database, and we
perform a separate 10-fold cross-validation experiment for each of the fifteen
classifiers listed in the Methods section, and all values of k from 1 to 10,
that is, 160 independent experiments in total. For each value of k, we plot
the highest accuracy obtained by any classifier as well as the average running
good balance between classifier performance and accuracy, so at k = 6, we
list the accuracy obtained by each classifier and its corresponding running
time, see Table 3.2. As can be seen, the SVM-based classifiers, multilayer perceptron, and logistic regression achieve the highest accuracy, with the
SVM-based classifiers achieving also the lowest running time out of those.
Figure 3.1: Highest accuracy score and average running time across all fifteen classifiers, at different values of k, for the full set of 6625 whole HIV-1 genomes from the LANL database.
1 2 3 4 5 6 7 8 9 10
0 20 40 60 80 100
43.62 51.40
84.83
92.43 95.24 96.66 96.74 96.39 95.92 95.34
k
Accuracy
(%)
0 2,000 4,000 6,000 8,000 10,000 12,000 14,000
4.10 4.60 8.10 9.91 21.51 45.18167.77662.62
2,669.82 11,054.56
Running
time
(s)
Accuracy Running time
Since it is typical to have only partial genome sequences available, we
repeat the same 10-fold cross-validation at k= 6, with the linear SVM
classi-fier, this time with the set of all pol genes from the LANL database. We find
that the accuracy changes from 96.49% (full-length genomes) to 95.68% (pol
gene sequences), indicating that the use of partial genomes does not
substan-tially reduce classification performance. Further, we expect that the inclusion
of recombinant forms should lower accuracy, since it requires the classifier to
accurately distinguish them from their constituent ‘pure’ subtypes. To test
Table 3.2: Accuracy scores and running times for each of the fifteen classifiers at k = 6, for the full set of 6625 whole HIV-1 genomes from the LANL database.
Classifier Accuracy Running time
cubic-svm 96.66% 44.44s
quadratic-svm 96.59% 44.52s
linear-svm 96.49% 44.23s
multilayer-perceptron 95.49% 53.92s
logistic-regression 95.32% 88.18s
10-nearest-neighbors 93.97% 31.92s
nearest-centroid-median 93.95% 22.21s
nearest-centroid-mean 93.84% 21.90s
decision-tree 93.53% 49.99s
random-forest 93.07% 31.35s
sgd 91.10% 24.24s
gaussian-naive-bayes 87.75% 22.39s
lda 77.76% 24.46s
qda 75.13% 26.57s
adaboost 64.85% 147.24s
SVM classifier, with the set of all full-length genomes from the LANL database,
this time omitting the 17 classes of recombinant forms and leaving only the
9 classes of pure subtypes. We find that the accuracy increases from 96.49%
(including recombinants) to 99.64% (omitting recombiants), and in fact only
3 sequences are misclassified in the latter case.
The sequences present in the LANL database are curated to be
repre-sentative of global HIV-1 diversity, and therefore high classification accuracies
on that dataset are, to some extent, to be expected. In order to perform
a more challenging benchmark on our algorithm, we compute its accuracy
on the eleven selected testing datasets of pol gene fragments from Table 3.1, after training with the set of whole pol genes from the LANL 2010 web
align-ment. Based on the previous performance measurements, we use the linear
SVM classifier and k = 6. We also perform the same accuracy measurement
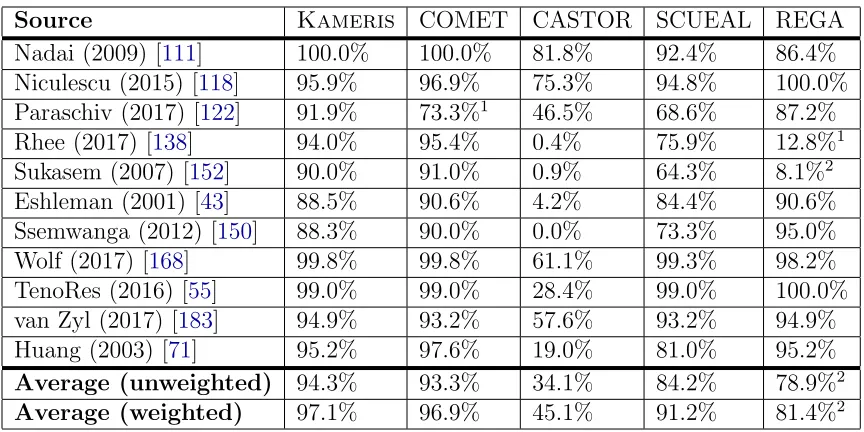
SCUEAL, and REGA, and show the results in Table3.3. In sum, our method (Kameris) comes within a few percent of the best tools in all cases, and has the highest average accuracy (both unweighted, and weighted by the number
of sequences in each set).
Running time is another important performance indicator, so we also
compare the performance of these five tools for the dataset of van Zyl et
al. [183], and the four fastest tools for all datasets together (see Table3.4). We observe that our tool matches or outperforms the competing state-of-the-art.
Note that, for these comparison experiments, CASTOR, COMET, SCUEAL,
and REGA were run from their web-based interfaces, and therefore the exact
specifications of the machines running each program could not be determined.
For this reason, the running times presented here should be taken as rough
order-of-magnitude estimates only.
Overall, these experiments demonstrate our method is nearly identical
in both accuracy and running time to the top third-party tool, COMET. Our
tool differs from COMET in that it is open-source and freely available for
commercial use, and is available in a standalone application which can be run
on any computer, while COMET is closed-source and freely available for
non-commercial research use only, and is publicly available only in a web-based
Table 3.3: Classification accuracies for all tested HIV-1 subtyping tools, for each testing dataset from Table 3.1; average accuracy both with and without weighting datasets by the number of sequences they contain.
Source Kameris COMET CASTOR SCUEAL REGA
Nadai (2009) [111] 100.0% 100.0% 81.8% 92.4% 86.4% Niculescu (2015) [118] 95.9% 96.9% 75.3% 94.8% 100.0% Paraschiv (2017) [122] 91.9% 73.3%1 46.5% 68.6% 87.2% Rhee (2017) [138] 94.0% 95.4% 0.4% 75.9% 12.8%1 Sukasem (2007) [152] 90.0% 91.0% 0.9% 64.3% 8.1%2 Eshleman (2001) [43] 88.5% 90.6% 4.2% 84.4% 90.6% Ssemwanga (2012) [150] 88.3% 90.0% 0.0% 73.3% 95.0% Wolf (2017) [168] 99.8% 99.8% 61.1% 99.3% 98.2% TenoRes (2016) [55] 99.0% 99.0% 28.4% 99.0% 100.0% van Zyl (2017) [183] 94.9% 93.2% 57.6% 93.2% 94.9% Huang (2003) [71] 95.2% 97.6% 19.0% 81.0% 95.2%
Average (unweighted) 94.3% 93.3% 34.1% 84.2% 78.9%2
Average (weighted) 97.1% 96.9% 45.1% 91.2% 81.4%2
1 In this case, a substantial number of sequences that were classified as subtype A by REGA
and our method were labeled unclassified subtypes (U) by COMET. In an HIV-1 phylogeny, subtype U sequences tend to be assigned a basal position (near the root) within the subtype A clade, suggesting that these sequences may be unrecognized variants or complex recombinants of subtype A.
2 These low accuracies are primarily caused by REGA misclassifying many CRF01 sequences as
subtype A, and subtype A is mostly equivalent to CRF01 in the pol region. If CRF01 and A were treated as equivalent, these accuracies would be 97.9% and 86.4% for the Rhee and Sukasem datasets, respectively, and unweighted and weighted averages of 93.8% and 96.2%, respectively.
Table 3.4: Approximate running times for all tested subtyping tools, for the dataset of van Zyl et al. [183] and all datasets listed in Table3.3. The van Zyl dataset was chosen at random for this purpose.
Tool Running time for the
van Zyl dataset
Running time for
datasets from Table
3.3
Kameris less than 2 seconds 16 seconds
COMET less than 2 seconds 14 seconds
CASTOR 3 seconds 46 seconds
SCUEAL1 18 minutes 8 hours
REGA1 31 minutes 19 hours
1 The REGA and SCUEAL web servers have limits of 1000 and 500 sequences per
So far, we have only discussed supervised classification, and we have
presented promising results for our approach. However, supervised
classifica-tion requires data with known labels, which can be problematic considering
that the rapid rates of mutation and recombination of viruses (particularly
HIV-1) can lead to novel strains and recombinant forms emerging quickly.
Un-supervised data exploration tools can help address this problem. To
demon-strate, we take the set of all whole genomes from the LANL database and
produce a MoDMap, visualizing their interrelationships, based on the
Man-hattan distance matrix obtained by computing all pairs of k-mer proportion
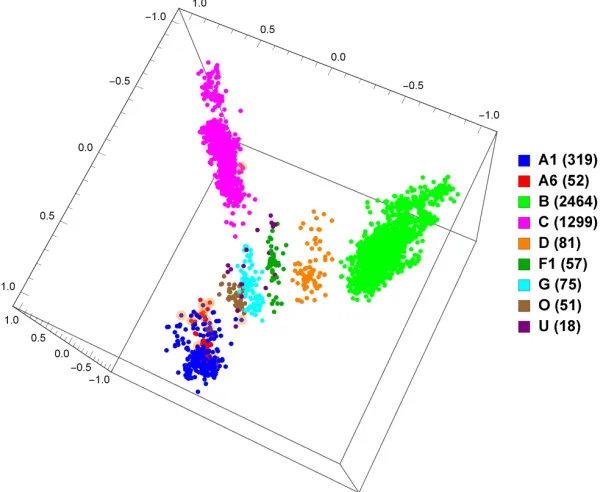
vectors (see Methods section), for 9 different pure subtypes or groups (Figure
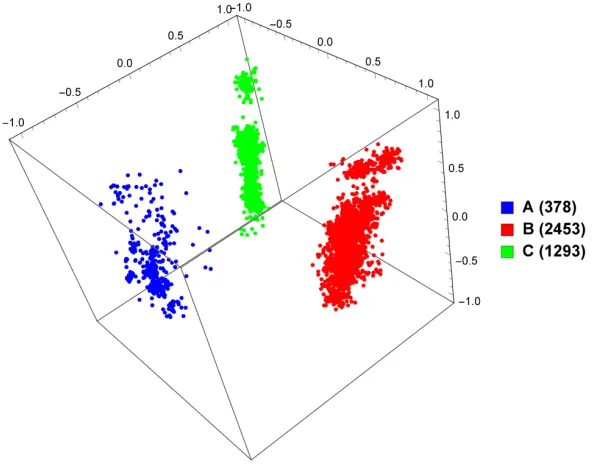
3.2), and just subtypes A, B, and C (Figure 3.3). As can be seen, based on these distances, the points in the plots are grouped according to known
sub-types, and indeed it can be seen that subtypes A1 and A6 group together, and
as well B and D group together, as could be expected.
Figure 3.3: MoDMap of 4124 full-length HIV-1 genomes of subtypes A, B, and C, at k = 6.
Synthetic data has been useful in the study of viral species such as
HIV-1, because a ground-truth classification is known for synthetic sequences
with-out ambiguity. However, one may wonder how well such synthetic sequences
model natural ones. We attempt to measure this by training a classifier on
natural and synthetic HIV-1 sequence data – if natural and synthetic sequences
cannot be distinguished, one may conclude that the simulation is realistic. For
the ‘natural’ class we use the set of allpol genes from the LANL database, and
for the ‘synthetic’ class we use 1500 synthetic pol genes produced as detailed
previously, and we perform a 10-fold cross-validation at k = 6 and with the
linear SVM classifier. We obtain an accuracy of 100%, meaning that the
clas-sifier can distinguish natural from synthetic sequences with perfect accuracy.
This suggests that synthetic sequence data should be used with caution, since
this result indicates it may not be perfectly representative of natural sequence
syn-thetic sequences which differs from the natural sequences, which our method is
able to recognize and use. We explore this further by generating a MoDMap,
as seen in Figure 3.4. Interestingly, even though our supervised classifiers succeeded to discriminate between real and synthetic sequences with an
accu-racy of 100%, the approach using distances between k-mer proportion vectors
results in the natural and synthetic sequences of specific subtypes grouping
to-gether, indicating that the synthetic sequences have some features that relate
them to the corresponding natural sequences of the same subtype.
Figure 3.4: MoDMap of 9270 natural HIV-1 pol genes vs. 1500 syn-thetically generated HIV-1 pol genes of various subtypes. The same plot is colored on the left by type (natural and synthetic) and on the right by HIV-1 subtype.
3.4
Discussion
The k-mer based supervised classification method we propose in this
paper has several advantages compared to other popular software packages for
the classification of virus subtypes. First, we have shown on several
manually-curated data sets that k-mer classification can be highly successful for rapid
and accurate HIV-1 subtyping relative to the current state-of-the-art.
significant advantages with respect to data privacy, transparency and
repro-ducibility. Other subtyping algorithms such as REGA [35] and COMET [151]
are usually accessed through a web application, where HIV-1 sequence data
is transmitted over the Internet to be processed on a remote server. This
arrangement is convenient for end-users because there is no requirement for
installing software other than a web browser. However, the act of transmitting
HIV-1 sequence data over a network may present a risk to data privacy and
patient confidentiality – concerns include web applications neglecting to use
encryption protocols such as TLS, or servers becoming compromised by
mali-cious actors. As a concrete example, the webserver hosting the first two major
releases of the REGA subtyping algorithm [35] was recently compromised by
an unauthorized user (last access attempt on November 27, 2017). In
con-trast, our implementation is available as a standalone program, without any
need to transmit sequence data to an external server, eliminating those issues.
In addition, our implementation is released under a permissive open-source
license (MIT). In contrast, REGA [129] and COMET [151] are proprietary
‘closed-source’ software, making it impossible to determine exactly how
sub-type predictions are being generated from the input sequences.
Relying on a remote web server to process HIV-1 sequence data makes
it difficult to determine which version of the software has been used to generate
subtype classifications, and by extension difficult to guarantee that
classifica-tion results can be reproduced. There is growing recogniclassifica-tion that tracking the
provenance (origin) of bioinformatic analytical outputs is a necessary
compo-nent of clinical practice. For example, the College of American Pathologists
recently amended laboratory guidelines on next-generation sequence (NGS)
data processing to require that: “the specific version(s) of the bioinformatics
report” [8]. In contrast to other tools, our standalone package makes it easy
to use exactly the desired version of the software and thus enables precise
reproducibility.
We now discuss some limitations of our approach. Like many machine
learning approaches, our method does not provide an accessible explanation
as to why a DNA sequence is classified a certain way, compared to a more
traditional alignment-based method. In some sense, the classifiers act more
as a black box, without providing a rationale for their results. Another issue
is our requirement for a sizable, clean set of training data. As opposed to
an alignment-based method that could function with even a single curated
reference genome per class, machine learning requires several examples per
training class, as discussed previously, to properly train. Finally, one issue
common to any HIV-1 subtyping tool is the fact that recombination and rapid
sequence divergence can make subtyping difficult, especially in cases where
the recombinant form was not known at the time of training. Other tools are
capable of giving a result of ‘no match’ to handle ambiguous cases, but our
method always reports results from the classes used for training.
To more clearly demonstrate this last issue, we generate a random
sequence of length 10,000 with equal occurrence probabilities for A, C, G,
and T, and we ask the five subtyping tools evaluated in our study to predict
its HIV-1 subtype. As expected, REGA gives a result of ‘unassigned’ and
SCUEAL reports a failure to align with the reference. Our tool reports subtype
‘U’ with 100% confidence, CASTOR predicts HIV-1 group ‘O’ with 100%
confidence, and COMET reports SIVCPZ(simian immunodeficiency virus from
chimpanzee) with 100% confidence. These outcomes are consistent with the
disproportionately large genetic distances that separate HIV-1 group O and
space is more likely to intersect the branch relating either of these distant
taxa to group M. Similarly, branches leading to subtype U sequences tend to
be longer and to intersect the HIV-1 group M tree at a basal location2. This
artificial example implies that real HIV-1 sequences that do not readily fit
into any of the defined subtypes or circulating recombinant forms may result
in incorrect predictions with misleadingly high confidence scores.
In spite of these limitations, our method not only matches or improves
upon current HIV-1 subtyping algorithms, but it should also be broadly
ap-plicable to any DNA sequence classification problem, including other virus
subtyping problems. To demonstrate this, we use the same method (with k
set to 6 and a linear SVM classifier) and 10-fold cross-validation to measure the
accuracies for classifying dengue, hepatitis B, hepatitis C, and influenza type
A virus full-length genomes (described in the Datasets section) to their
re-spective reference subtypes. Overall, we obtain accuracies of 100% for dengue
virus, 95.81% for hepatitis B virus, 100% for hepatitis C virus, and 96.68% for
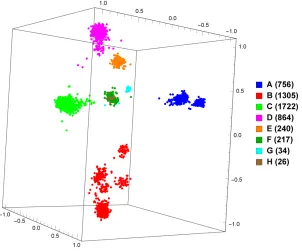
influenza A virus. We also provide a MoDMap visualization of the subtypes of
hepatitis B, as seen in Figure3.5. This plot displays not only clear separation between subtypes but also structure within subtypes A and B, which would
be an interesting target for future study.
2HIV-1 subtype U does not comprise a distinct clade. Rather, the LANL database
Figure 3.5: MoDMap of 5164 whole hepatitis B genomes of 6 different pure subtypes.
In all the experiments presented above, we use whole assembled genomes
or gene sequences. However, next-generation sequencing (NGS)
technolo-gies produce as output short reads, often of length 150 to 300 base pairs,
and computationally-intensive assembly is required to produce contiguous
se-quences. Usefully, our method works equally well on short reads, without any
requirement for assembly. To validate this, we begin with the full set of whole
HIV-1 genomes from the LANL database, and we assume a read length of
150 bp. Recall that the average genome length for this dataset is 8970 bp, so
each sequence contains about 60 reads’ worth of data, on average. For each
sequence, we select 60 random positions, take the subsequence of length 150
bp starting at each position, and concatenate these 60 subsequences to form
a new sequence – in this way, we simulate the process of a DNA sequencer.