ISSN (Print) : 2320 – 3765 ISSN (Online): 2278 – 8875
I
nternational
J
ournal of
A
dvanced
R
esearch in
E
lectrical,
E
lectronics and
I
nstrumentation
E
ngineering
(An ISO 3297: 2007 Certified Organization)
Vol. 4, Issue 4, April 2015
Optimal Placement of Multi DG in 33 Bus
System Using PSO
Rohit Fanish1, Jitendra Singh Bhadoriya2
PG Scholar, Department of EEE, NRI Institute of Info.Science and Tech, Bhopal, (MP), India 1
Assistant Professor, Department of EEE, NRI Institute of Info.Science and Tech, Bhopal, (MP), India 2
ABSTRACT: This paper presents an effective method based onParticle Swarm Optimization (PSO) to recognize the switching operation plan for feeder reconfiguration and optimum value of DG size simultaneously. The main purpose is to reduce the real and reactive power losses and improve the bus voltage profile in the system while satisfying all the distribution constraints. A method based on PSO algorithm to find out the minimum configuration is presented and their impact on the network real power losses and voltage profiles are investigated. To express the validity of the proposed algorithm, backward forward method are carried out on 33 bus systems and the results are presented using multi DG.
KEYWORDS: Reconfiguration, Particle Swarm Optimization, Loss Reduction and Distributed Generation.
I. INTRODUCTION
The growing demand in the power system has posed a challenging task to power system engineers in maintaining a reliable and safe system cheaply. In the heavily loaded network, the load current drawn from the source would raise. This may lead to an increase in voltage drop and system losses. The performance of distribution system becomes inefficient due to the reduction in voltage magnitude and increase in distribution losses. Therefore, the operating cost will also increase. With this regard, changing environment of power systems design and operation have necessitated the need to consider active distribution network by incorporating Distributed Generation units (DGs) sources [1]. The integration of DGs in distribution system would lead to improving the voltage profile, reliability improvement such as service restoration and uninterruptible power supply and increase energy efficiency.The distribution feeder reconfiguration (DFR) is one of the mainly significant control schemes in the distribution networks which can be affected by the interconnection of DGs.Generally, the DFR is defined as varying the topological structure of distribution feeders by changing the open/closed status of sectionalization and tie switches so that the power losses is minimized, and the constraints are met. The analysis from [2] has suggested of employing a method based on heuristic algorithm to determine the configuration of radial distribution networks, which finally led to loss minimization. Shirmohammadi et al. [3] also described heuristic optimization technique for the reconfiguration of distribution networks to decrease their resistive line losses. In another approach, V.Parada et. al. [4] proposed a solution procedure by employing simulated annealing (SA) to search an satisfactory non-inferior solution. In [5], Sawa has proposed the new method in network reconfiguration that involves the discrete decimal mutant PSO and the fixed loop method. Jin et al [6] introduced a binary particle swam optimization based reconfiguration methodology for the distribution system. The purpose of the reconfiguration was load balancing. The reconfiguration methodology proposed in that work can only be applied in the power system with radial configuration. Zhou, et al [7] put forward a heuristic reconfiguration methodology for the distribution system to decrease the operating cost in a real time operation environment. In that work, the operation cost in the power system is the power loss in the distribution system. The operation cost reduction in that work is based on the long term operation of the power system. Another heuristic search based reconfiguration algorithm was proposed by Wu et al [8]. In that work, the reconfiguration methodology was apply to the radial power system for service restoration, load balancing, and repairs of the power system.
ISSN (Print) : 2320 – 3765 ISSN (Online): 2278 – 8875
I
nternational
J
ournal of
A
dvanced
R
esearch in
E
lectrical,
E
lectronics and
I
nstrumentation
E
ngineering
(An ISO 3297: 2007 Certified Organization)
Vol. 4, Issue 4, April 2015
of DG and decrease power loss. The proposed PSO also improves convergence characteristics and less computation time as compared with GA technique. The effectiveness of the methodology is demonstrated by a practical sized distribution system consisting of 33-bus system. The fine points of these algorithms are discussed in section II. Meanwhile, Section III shows the performance of this algorithm using standard test function. The results in term of power loss and voltage profile are discussed in Section IV and finally the last section presents the conclusion of the study.
II. PROBLEM FORMULATION
The purpose of distribution network reconfiguration is to find a radial operating structure that minimize the system power losses while fulfilling operating constraints. Thus the problem can be formulated as follows [6].
MinP
losses=∑in 1| Ii|2 ki Ri i N (1)
Where is Ii = current in branch i, Ri = resistance of branch i, N is the total number of branches and ki is the variable that represents the topology status of the branches (1=close, 0= open).
Subject to:
a) Radial network constraint: Distribution network should be composed of radial structure considering operational point view.
b) Node voltage constraint: Voltage magnitude Vi at each node must lie within their permissible ranges to maintain power quality
V
min ≤Vbus≤Vmax (2)
The standard minimum voltage used is 0.95 and maximum voltage is 1.05 (±5%). The process of works begins with the initial population.
c) Generator operation constraints: All DG units are only permitted to operate within the acceptable limit where pimin and pimax are the lower and upper bound of DG output.
pimin≤ pg≤ pimax (3) d) Feeder capability limits:
|I k | ≤ I kmax k ∈ {1,2,3,...l} (4) where Ikmax = maximum current capability of branch k.
- Radial configuration format. - No load-point interruption
III. FUNDAMENTAL PARTICLE SWARM OPTIMIZATION ALGORITHM (PSO)
The basic idea of the PSO is based on the social behavior (foraging) of organisms such as fish (schooling) and bird (flocking) [20-21]. The birds or fish will move to the food in certain speed or position. Their movement will depend on their own experience and experience from other ‘friends’ in the group ( Pbest and Gbest ).
The new velocity, Vjk1 and the new position, Xkj1 for the fish or birds are obtained using Eq.(5) and (6).
ISSN (Print) : 2320 – 3765 ISSN (Online): 2278 – 8875
I
nternational
J
ournal of
A
dvanced
R
esearch in
E
lectrical,
E
lectronics and
I
nstrumentation
E
ngineering
(An ISO 3297: 2007 Certified Organization)
Vol. 4, Issue 4, April 2015
the target region. The inertia weight ω is typically set according to the following equation: .
( + 1) = − × (7)
In Eq.(7), tmax is the maximum number of iterations and t is the current iteration number. ωmax and ωmin are maximum
and minimum of the inertia weights, respectively. The process of implementation of PSO algorithm is as f ollows: In this work, we only deter mined the optimal size of DG while the location of DG is fixed [22]. DG location in the network is fixed as a controlled measure in order to observe the responding changes of DG sizing. Furthermore, the DG location in practical is also depends on the suitability of the area.
Step 1: The input data including network configuration, line impedance and status of DGs and switches are to be read. Step 2: Setup the set of parameters of PSO such as, number of particles N, weighting factors and C1, C2. The initial population is determined by selecting the tie switches and DG size randomly from the set of the original population. The variable for tie switches represented by S and as for DG size is represented by pg. The proposed particles can be written as:
where β is the number of tie line and α is th e number of DG.
Step 3: Calculate the power loss using distribution load flow based on the Newton - Raphson method.
Step 4: Randomly generates an initial population (array) of particles with random positions and velocities on dimension in the solution space.Set iteration counter k=0.
Step 5: For each particle if the bus voltage is within the limits, calculate the total loss using distribution load flow. Otherwise, that particle is infeasible.
Step 6: Record and update the best values. The two best values are recorded in the searching process. Each particle keeps track of its coordinate in the solution space that is associated with the best solution it has reached so far. This value is recorded as as Pbest . Another best value to be recorded is Gbest,which is the overall best value obtained so far byany particle. Pbest and Gbest are the generations of switches, Dg sizes and power loss. This step also updates Pbest and Gbest. At first, we compare the fitness of each particle with its Pbest. If the current solution is better than its Pbest , then replace Pbest by the current solution then, the fitness of all particles is compared with Gbest. If the fitness of any particle is better Than Gbest , then replace Gbest .
Step 7: Update the velocity and positio n of the particles. Eq.(5) is applied to update th e velocity of the particles.The velocity of a par ticle represents a movement of the switches. Me anwhile, Eq.(6) is applied to update the position of the particles.
Step 8: End conditions.
Check the end condition, if it is reached the algorithm stops, otherwise, repeat steps 3-7 until the end conditions are satisfied.In this work,we only determine the optimal size of DG while the location of DG is fixed [22].DG location in the network is fixed as a controlled measure in order to observe the responding changes of DG sizing.Furtuermore,the DG location in practical is also depends on the suitability of the area.
IV. CASE STUDIES
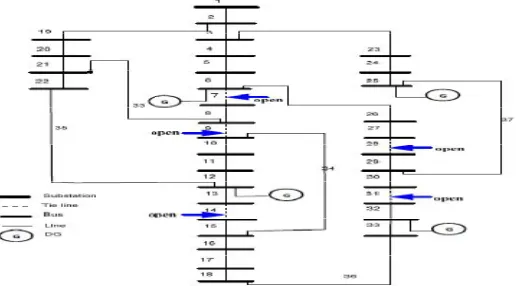
The test system for the case study consisting of the standard IEEE 33 bus radial distribution system is shown in fig(1).The system consists of one feeder, 32 normally closed tie line and five normally open tie lines (dotted line) and located on branch No. 33, 34, 35, 36 and 37. The system load is assumed to be constant and Sbase = 10 0MVA and
Vbase = 12.66KV. The line and load data details can be referred in [10]. The total load on the system is 3715kW and 2300kVAr. The maximum active output of DG in this study is set to 5MW. While, the size of the population for test systems is 50.The convergence value is take n as 0.0001. The minimum and maximum voltages are set at 0.95 and .05p.u.respectively.All calculations for this method are carried out in the per-unit system. Four cases are considered: Case 1: The system is without distributed generation and feeder reconfiguration (initial)
Case 2: The same as case 1 except that the feeders can be reconfigured by the available sectionalizing switched and the tie switches.
ISSN (Print) : 2320 – 3765 ISSN (Online): 2278 – 8875
I
nternational
J
ournal of
A
dvanced
R
esearch in
E
lectrical,
E
lectronics and
I
nstrumentation
E
ngineering
(An ISO 3297: 2007 Certified Organization)
Vol. 4, Issue 4, April 2015
Respectively.
Case 4: The same as case 3 but with feeder configuration.
Fig.1:Initial Configuration of the 33 bus radial distribution sytem
V. RESULTS AND DISCUSSION
Table-1: The Size, Locations and Power Loss Reduction of 33-Bus System
Parameters Plos
s
-No DG (kw) Ploss-One DG (kw)
Ploss -Two DG (kw)
Ploss -Three DG (kw)
Ploss -Four
DG (kw)
Total System Active Power Loss
202.
71 103.98 93.47 85.58 82.98
Active Power Loss Reduction (%)
---- 48.71 53.88 57.78 59.06
Total System Reactive Power Loss (kvar)
135.
16 74.79 66.22 60.43 57.84
Reactive Power Loss Reduction (%)
---- 44.66 51.00 55.29 57.20
Optimal
Locations ---- 6 6, 16
6, 16,
25 6, 16, 25, 32
DG-size
(kw) ----
2576.44 -(6)
2576.44 -(6) 403.19 -(16)
2576.44 -(6) 403.19 -(16) 649.82 -(25)
ISSN (Print) : 2320 – 3765 ISSN (Online): 2278 – 8875
I
nternational
J
ournal of
A
dvanced
R
esearch in
E
lectrical,
E
lectronics and
I
nstrumentation
E
ngineering
(An ISO 3297: 2007 Certified Organization)
Vol. 4, Issue 4, April 2015
V.1 Impact on Power Losses
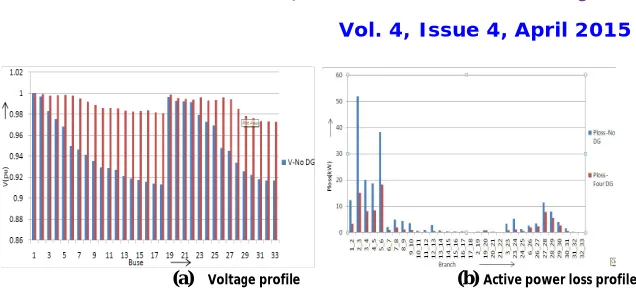
After this simulation is executed many times by using MATLAB software, only the minimum power loss with optimal DG size is selected.The results obtained consists of the five opened switches, total power loss and four optimal DG sizing. The numerical results for the four cases are summarized in Table I. The results show the performance of PSO when tested using 33-bus distribution system. It is noticed a considerable decrease in the power loss values when the DG is placed in the distribution system. It is confirmed from case 3 that the DG helps to reduce the power loss after reconfiguration from 202.70 kW to 85.58kW, or 57.78% of the reconfigurations without DG.Fig 3 shows the comparative result of DG installation.
(a)Voltage profile (b) Active power loss profile (c) Reactive power loss profile.
Fig. 3: The Comparative Results for DG installation,
In case 4, by applying reconfiguration with DG installation in the PSO method, the amount of power loss is improved from 103.98 kW to 82.98kW which is about 21kW. But the same application done on the GA method has given lower improvement of 22.9kW (135.3kW to 112.4kW). Thus, the proposed PSO method in this paper has improved greater power loss as compared to GA method. In addition, the reading of power loss from PSO method after reconfiguration with DG in case 4 is only 82.98kW as compared to the GA method which gives 112.4kW, a different of 20.1kW. From the perspective of power losses, PSO impacted positively in the analyzed distribution network, achieving 51.4% improvement. If we compare the CPU time, the computing time of the PSO method is only 13.4 seconds compared to the GA method which requires 30 seconds. Hence, PSO method is 16.6 seconds faster than GA method.
Figure 4. Network Reconfiguration with 4 DGs of 33-bus system
V.2 Impact on Voltage
ISSN (Print) : 2320 – 3765 ISSN (Online): 2278 – 8875
I
nternational
J
ournal of
A
dvanced
R
esearch in
E
lectrical,
E
lectronics and
I
nstrumentation
E
ngineering
(An ISO 3297: 2007 Certified Organization)
Vol. 4, Issue 4, April 2015
(a) Voltage profile
(b) Active power loss profile (c)Reactive power loss profile
Fig. 5: The Results for Four-DG installation.
Meanwhile, Fig.5 depicted the results with reconfiguration and DG on voltage profile improvement achieved by the proposed algorithm. In this case, there are slightly improvements on the voltage value at bus 13 till bus 16. While, the voltage improvement obviously between bus 25 till bus 29 .However, the minimum voltage is equal 0.9131p.u before reconfiguration and then being raised to 0.972882 p.u after reconfiguration. The rest of the bus has almost the same value.The PSO shows a great difference after reconfiguration with DG. Since the PSO gives the fastest solution compared to others and its performance is better than traditional methods, it can be concluded that PSO is a superior method in reconfiguration with DG process.
VI. CONCLUSION
PSO technique has been developed in this paper with presence of distributed generators for reconfiguration of the distribution system. The main objective of this method is to reduce the real power losses by turning on/off the tie line and determine the optimum value of DG size simultaneously on the distribution network reconfiguration. A 33-bus distribution system with four distributed generation is used to demonstrate the effectiveness of the proposed technique. In this paper, four cases are considered as explained in section IV. The results of the propose d algorithm are compared with GA method.From the analysis and simulation of the results, the overall perspectives between the tw o methods show that the PSO result surpasses GA in this application. PSO has shown tremendous improvement in t erm of processing time, number of iterations to reach the optimal value of power losses and the optimum value of DG sizing. From the simulation results indicated that the optimal on/off patterns of the tie line can be identified which give the minimum power loss while keeping bus voltage magnitudes within the acceptable limits. Based on these reasons, it is strongly expected that PSO is capable of solving large-scale problems arose in network reconfiguration as compared to the existing methods.
REFERENCES
[1] K. Nara, A. Shiose, M. Kitagawoa, and T. Ishihara, “Implementation of Genetic Algorithm for Distribution Systems Loss Minimum Reconfiguration”, IEEE Transactions on Power Systems, vol. 7, no. 3, Aug. 1992, p. 1044-1051.
[2] S. Civanlar, J.J. Grainger, H. Yin, S.S.H. Lee, “Distribution feeder reconfiguration for loss reduction”, IEEE Trans. Power Del. 3 (3) (1988) 1217–1223.
[3] D. Shirmohammadi, H.W. Hong, “Reconfiguration of electric distribution networks for resistive line loss reduction”, IEEE Trans.Power Syst. 4 (1) (1989) 1492–1498.
[4] E. Lopez, h. Opaso., “Online reconfiguration considering the variability deman”, applications to real networks, IEEE Trans. Power Syst.19 (1) (2004) 549–553.
[5] T.Sawa, "Radial Network Reconfiguration Method in Distribution System using Mutation Particle Swarm Optimization” IEEE Burcharest Power Tech Conference, June 28th, Romania..
[6] X. Jin, J. Zhao, Y. Sun, K. Li, B. Zhang, “Distribution Network Reconfiguration for Load Balancing using Binary Particle Swarm Optimization”, International Conference on Power System Technology, vol. 1, no. 1, Nov. 2004, pp. 507-510
[7] Zhou, Q.; Shirmohammadi, D. and Liu, W.-H. E., “Distribution Feeder Reconfiguration for Operation Cost Reduction”, IEEE Transactions on Power Systems, Vol. 12, No. 2, May 1997, pp. 730-735
[8] Wu, J.S.; Tomsovic, K.L. and Chen, C.S., “A Heuristic Search Approach to Feeder Switching Operations for Overload, Faults, Unbalanced Flow and Maintenance”, IEEE Transactions on Power Delivery, Vol. 6, No. 4, Oct. 1991, pp. 1579-1586
ISSN (Print) : 2320 – 3765 ISSN (Online): 2278 – 8875
I
nternational
J
ournal of
A
dvanced
R
esearch in
E
lectrical,
E
lectronics and
I
nstrumentation
E
ngineering
(An ISO 3297: 2007 Certified Organization)
Vol. 4, Issue 4, April 2015
[10] Y.C.Huang, “Enhanced genetic algorithm-based fuzzy multi objective approach to distribution network reconfiguration”, Proc. Inst .Elect. Eng. 149 (5) (2002) 615–620.
[11] Ching-Tzong Su, Chung-Fu Chang and Ji-Pyng Chiou, “Distribution Network Reconfiguration for Loss Reduction by Ant Colony Search Algorithm Electric Power Systems Research, Vol. 75, No. 2-3, pp. 190– 199,August 2005
[12] S.Ching-Tzong, C. Lee, “Network reconfiguration of distribution systems using improved mixed-integer hybrid differential evolution”, IEEE Trans. Power Del. 18 (3) (2003) 1022–1027.
[13] N. Rugthai Charoencheep and S. Sirisumrannukul “Feeder Reconfiguration for Loss Reduction in Distribution System with Distributed Generators by Tabu Search”, GMSARN International Journal 3 (2009) 47 – 54.
[14] Yuan-Kang Wu, Chin-Yin Lee, Le-Chang Liu, and Shao-Hong Tsai. “Study of Reconfiguration for the Distribution System With Distributed Generators”, IEEE transactions on Power Delivery, Vol. 25, No.3,July 2010.
[15] Z.M.Yasin, T.K.A. Rahman, “Network Reconfiguration in a Power Distribution System under Fault Condition with the Presence of Distributed Generation”, International Conference on Energy and Environment 2006 (ICEE 2006).
[16] M.Oliveria, L. Ochoa, “Network Reconfiguration and loss allocation for distribution systems with distributed generation”, IEEE/PES Trans. Distribution. Conference .Expos. (2004) 206–211.
[17] Sivanagaraju, S., Srikanth, Y., and Jagadish Babu, E. 2006, “An efficient genetic algorithm for loss minimum distribution system reconfiguration”, Electric Power Components and Systems, 34: 249– 258, 2006.
[18] H. Kim, Y. Ko, “Artificial neural network based feeder reconfiguration for loss reduction in distribution systems”, IEEE Trans. Power Del. 8 (3) (1993) 1356–1367
[19] A. M. El-Zonkoly, Optimal placement of multi-distributed generation units including different load models using particle swarm optimization, IET Generation Transmission & Distribution, vol. 5, no. 7, July 2011, pp. 760-771.
M. H. Moradi and M. Abedini,A combination of genetic algorithm and particle swarm optimization for optimal DG location and sizing in distribution systems,International Journal of Electrical Power & Energy Systems, vol. 34, no. 1, Jan. 2012, pp. 66-74.
[20] Lalitha M. Padma, Reddy V. C. Veera,Usha V., Reddy N. Sivarami, Optimal DG Placement for Minimum Real Power Loss in Radial Distribution System using PSO, ARPN Journal of Engineering and Applied Sciences 2010, Vol. 5, No. 4, pp. 30-37.
[21] A. Merlin, H. Back, “Search for a minimal-loss operating spanning tree configuration in an urban power distribution system”, Proceedings of the Fifth Power System Computation Conference, Cambridge, UK, 1975, pp. 1–18.
BIOGRAPHY
Mr.ROHIT FANISH from Bhopal M.P.,India,Born on 1987. Currently pursuing M.Tech (Power Electronics) from N.R.I. Institute of Information science & Technology, Bhopal M.P., India and Obtained his B.E in Electrical and Electronics Engineering from N.R.I. Institute of Information science & Technology, Bhopal. right now he is M.Tech research scholar at department of Electrical & Electronics of N.R.I. Institute of Information science & Technology, Bhopal M.P.,India.