Western University Western University
Scholarship@Western
Scholarship@Western
Electronic Thesis and Dissertation Repository
9-24-2012 12:00 AM
Spatial and Temporal Activity of Migratory Bats at Landscape
Spatial and Temporal Activity of Migratory Bats at Landscape
Features
Features
Rachel M. Hamilton
The University of Western Ontario
Supervisor Dr. Brock Fenton
The University of Western Ontario
Graduate Program in Biology
A thesis submitted in partial fulfillment of the requirements for the degree in Master of Science © Rachel M. Hamilton 2012
Follow this and additional works at: https://ir.lib.uwo.ca/etd
Part of the Terrestrial and Aquatic Ecology Commons
Recommended Citation Recommended Citation
Hamilton, Rachel M., "Spatial and Temporal Activity of Migratory Bats at Landscape Features" (2012). Electronic Thesis and Dissertation Repository. 886.
https://ir.lib.uwo.ca/etd/886
This Dissertation/Thesis is brought to you for free and open access by Scholarship@Western. It has been accepted for inclusion in Electronic Thesis and Dissertation Repository by an authorized administrator of
SPATIAL AND TEMPORAL ACTIVITY OF MIGRATORY BATS AT
LANDSCAPEFEATURES
(Spine title: Spatiotemporal Migratory Bat Activity at Landscape Features)
(Thesis format: Monograph)
by
Rachel M. Hamilton
Graduate Program in Biology
A thesis submitted in partial fulfillment
of the requirements for the degree of
Master of Science
School of Graduate and Postdoctoral Studies The University of Western Ontario
ii
CERTIFICATE OF EXAMINATION
Supervisor
______________________________ Dr. Brock Fenton
Supervisory Committee
____________________________ Dr. Nusha Keyghobadi
______________________________ Dr. James Staples
Examiners
______________________________ Dr. Christopher Guglielmo
______________________________ Dr. Hugh Henry
______________________________ Dr. Beth MacDougall-Shackleton
The thesis by
Rachel Maris Hamilton
entitled:
Spatial and temporal activity of migratory bats at landscape features
is accepted in partial fulfillment of the requirements for the degree of
Master of Science
iii Abstract
Geographical landmarks may be important features for navigation of migrating
bats although spatial and temporal activity may depend on species-specific migration
strategies. I predicted that latitudinal migrating bats would have higher activity along
north-south oriented linear landscape features, especially during late-seasonal migration
periods, compared to bat species that migrate within a regional area. I acoustically
sampled four species of bats classified as latitudinal and regional migrants. I monitored
twelve sites located in southwestern Ontario at four landscape features between May and
October 2011. I found that specific landscape features may have greater importance to
specific species rather than their migration strategy. Also, latitudinal migratory bat
activity increased during the late-seasonal time period however all species activity
increased in the mid-seasonal time period. Information, gained with acoustic monitoring,
about seasonal relationships of species at landscape features may help identify critical
areas used by migrating bats.
Keywords: migratory bats, landscape feature, acoustic monitoring, seasonal, ridge,
iv Acknowledgements:
I thank the staff at Bruce Peninsula National Park, Point Pelee National Park,
Craigleith Provincial Park, MacGregor Point Provincial Park, Point Farms Provincial
Park, The Pinery Provincial Park, Rock Point Provincial Park, Balls Falls Conservation
Area, Durham Conservation Area, Conestoga Lake Conservation Area, Pinehurst Lake
Conservation Area, Rattlesnake Point Conservation Area, Terra Cotta Conservation Area,
Wildwood Conservation Area, and Long Point Bird Observatory for the use of their
property and help with data collection. Without their dedicated time and energy I would
not have been able to complete my project.
I thank the Ministry of Natural Resources for funding my research. I am
extremely grateful to Lesley Hale for all her time and guidance starting my project and
introducing me to back road driving in Southwestern Ontario. I am inspired by your
dedicated efforts to make a difference in bat research and conservation through your hard
work and collaboration throughout Ontario.
I thank the faculty members on my proposal and defense examination committee,
Dr. Jack Miller, Dr. Hugh Henry, Dr. Beth MacDougall-Shackleton, and Dr. Chris
Guglielmo for their insight and evaluation of my project. I would like to thank Dr. Nusha
Keyghobadi and Dr. James Staples for their patience and guidance in serving on my
advisory committee and proposal defense.
I thank all my colleagues and friends in the bat lab. I am extremely grateful for
the brilliant ideas and support from Liam McGuire, and his help with my statistical
questions. I am inspired by all his accomplishments. I am grateful to Erin Fraser for her
v
Amanda Adams for her thoughtful advice and support especially in the final days of
thesis writing. I thank Colin Hayward and Matthew Emerich for their ability to make me
smile and support me throughout this process. I am grateful for friend, roommate, and lab
mate Meredith Jantzen who supported me throughout all the ups and downs of my time
spent here. I would like to thank the entire bat lab for all the fun times spent in London
and abroad.
I am grateful to Nick Lapointe for all his support, advice, and encouragement
completing my thesis. I am thankful for all my friends and family, especially Mom and
Dad, for their encouraging words and thoughts throughout this entire process.
Lastly, I thank Dr. Brock Fenton, for providing me with this great opportunity to
learn and work with bats and to travel to places I never thought possible. His enthusiasm
for bats, and life, is infectious and I am continually inspired by his devotion and
accomplishments. Thank you.
vi Table of Contents
Title Page ... i
Certificate of examination ... ii
Abstract and Keywords ... iii
Acknowledgments... iv
Table of Contents ... vi
List of Tables ... viii
List of Figures ... ix
List of Appendices ... xi
Chapter 1: Introduction ... 1
1.1 Bat migration and landscape feature ... 2
1.2 Migration strategies and seasonal activity ... 5
1.3 Statement of purpose ... 9
Chapter 2: Methods ... 10
2.1 Study sites ... 10
2.2 Data collection ... 12
2.3 Call analysis ... 14
2.4 Statistical analysis ... 18
Chapter 3: Results... 27
3.1 Mean activity for feature and season by species ... 27
3.2 Activity patterns across landscape features ... 27
3.3 Temperature and wind speed ... 30
3.4 Temporal and spatial patterns of peak activity ... 35
3.5 Categorizing peak activity in late-seasonal period ... 38
vii
Chapter 4: Discussion ... 43
4.1 Species acitivty at landscape feature ... 43
4.2 Seasonal activity of migratory species ... 48
4.3 Interpretation of analysis... 49
4.4 Acoustic detection ... 51
4.5 Management and implications ... 52
Chapter 5: Conclusions ... 54
References ... 55
Appendix I ... 64
Appendix II ... 65
Appendix III ... 66
Appendix IV ... 68
Appendix V ... 70
Appendix VI ... 73
viii List of Tables
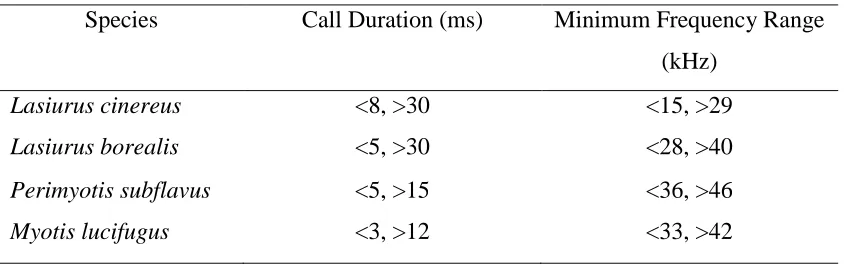
Table 1: Species-specific post filter parameters for call classification in DFA .…………17
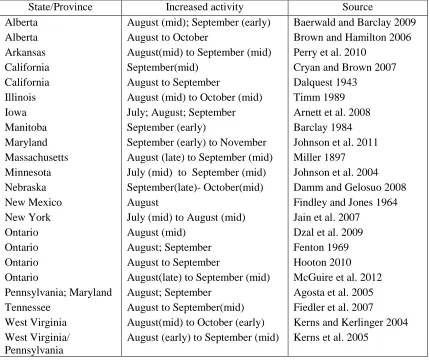
Table 2: Literature review identifying seasonal time periods of migratory movement of bats………20
Table 3: Sum of numerical scores based on possible migratory status by site and species at each feature………25
Table 4: The distribution of the possible sum of site numerical scores based on possible migratory status by site at each feature ...26
Table 5: The total number of calls and percent of recordings of each species recorded at each site and feature ...28
Table 6: Activity labels of possible late-seasonal migratory activity levels of species at each feature ...41
Table 7: Summary of results of species and activity by method of analysis ...42
Table 8: Comparison of the strengths and weaknesses of four different methods of
analysis………...50
ix List of Figures
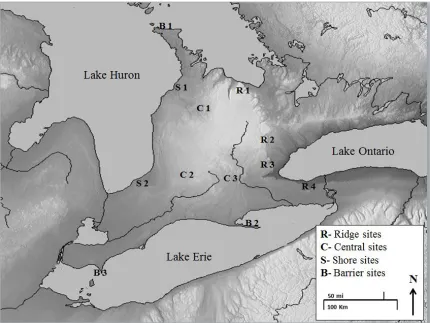
Figure 1: Location of thesis field sites in southwestern Ontario, Canada ...11
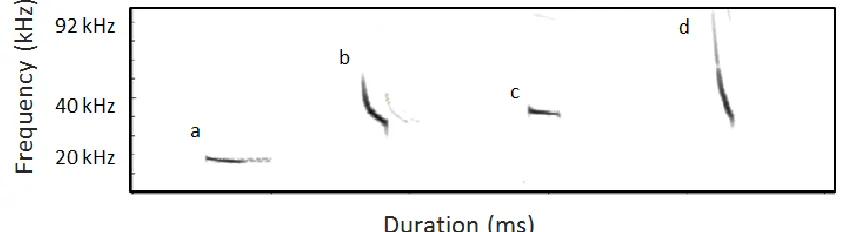
Figure 2: Typical image of echolocation calls produced by species ...16
Figure 3: Example of raw data with migratory status classifications for sites based on criteria ...22
Figure 4: Mean activity levels at each feature and season by species ...29
Figure 5: Activity patterns of categorized latitudinal migrant species at each feature across entire sampling period...31
Figure 6: Activity patterns of categorized regional migrant species at each feature across entire sampling period...32
Figure 7: Influence of temperature on activity levels for each species ...33
Figure 8: Influence of log wind speed on activity levels for each species ...34
Figure 9: Latitudinal location of sites and peak activity by species and feature across sampling period ...37
Figure 10: Status of probable late-seasonal migratory activity of species at each site ...40
Figure A1: Mean amount of forest, built-up, and water percent area within a 5 km radius at each feature ...67
Figure A2: Comparison of average temperatures based on two types of measurement methods ...69
Figure A3a: Activity levels of Lasiurus cinereus pre and post sampling period at
MacGregor Point Provincial Park ...71
Figure A3b: Activity levels of Lasiurus borealis pre and post sampling period at
MacGregor Point Provinical Park ...72
Figure A4: Activity of Lasiurus cinereus at twelve field sites collected from 13 May to 13 October ...73
x
Figure A6: Activity of Myotis lucifugus at twelve field sites collected from 13 May to 13 October ...75
xi List of Appendices
Appendix I: Approval letter from the Animal Use Subcommittee of the University of
Western Ontario ...64
Appendix II: Names, coordinates, and measured habitat variables ...65
Appendix III: Habitat variables ...66
Appendix IV: Temperature comparison………...68
Appendix V: Timing of early-seasonal migration ...70
1 1. Introduction
Migration is a biological phenomenon that spans across multiple animal taxa and
across different environmental strata (air, water, and land). The definition of migration
involves an undistracted, seasonally-timed movement spanning greater distances than
typically covered in daily activity, between areas of seasonal residency and breeding
grounds (Dingle and Drake 2007). Why animals migrate is often linked to spatiotemporal
fluctuations in food resources, shelter, and climate conditions, but when and where
migrants travel remains a constant area of research (e.g. Berthold 1993; Newton 2008).
Flying animals, especially, can cover great distances in relatively short amounts of time.
The migrations of birds are highly researched due to their conspicuous nature and
impressive movements across multiple terrains and landscape barriers (Berthold 1993;
Cox 1985; Newton 2008). Compared to bird migration, relatively little is known about
the migrations of bats, although both groups of flying animals face similar challenges
(i.e., weather, topography, resources) that influence temporal and spatial patterns of
migratory movements (Fleming and Ebay 2003; Popa-Lisseanu and Voigt 2009).
The much smaller proportion of migrant bat species, compared to migrant birds,
along with small body size, nocturnal nature, and rapid mobility make migratory bats
difficult to capture and track. Knowledge of the routes and timing of migrating birds is
largely attributed to extensive annual monitoring at banding stations located throughout
the world (Dingle 1996), which are currently non-existent for bats. Early understanding
of bat migration came from observational and collection studies where certain species
were found to be absent in the winter (Dalquest 1943; Merriam 1887; Miller 1897). Since
2
2005), radio tracking (McGuire et al. 2012), wind turbine mortality counts (Fiedler et al.
2007; Johnson et al. 2004; Kunz et al. 2007), and stable isotope analysis (Cryan 2003;
Fraser et al. 2012) have contributed to the understanding of temperate bat migratory
movements by providing insight into specific locations migrant bats are found during the
season.
Using acoustic monitoring to sample bat activity has increased in part because of
the ability to easily record echolocation calls without actively capturing bats and the
affordability of the equipment. Acoustic detectors record high-frequency sounds of
echolocation calls, and calls are usually species-specific (Fenton and Bell 1981).
Acoustic monitoring is useful for identifying critical areas of activity, but most studies
focus on specific site locations and use a limited number of detectors (Baerwald and
Barclay 2009; Barclay 1984; Serra-Cobo et al. 2000). However, sampling a large region
using stationary acoustic monitors may allow us to determine important areas for
migrating bat activity (Johnson et al. 2011).
1.1 Bat migration and landscape features
Bats may use many sensory cues to navigate during migration. Like birds, bats
can recognize post sunset glows (Buchler and Childs 1982), the earth’s magnetic field
(Holland et al. 2006) and geographical landmarks (Baerwald and Barclay 2009). The
combination of multiple sensory signals may contribute to a ‘map and compass’ strategy
where perception of magnetic fields and celestial cues may provide a compass, and
landscape features may provide a map (Holland 2007; Tsoar et al. 2011). The ability to
use known, fixed reference points to navigate, typically by visual observation, is known
3
ranges (Suthers 1970), thus it is likely that they navigate using visual cues (Suthers 1970;
Timm 1989), in conjunction with echolocation. Prominent topographical features serve as
fixed reference points, and may aid navigation by bats during migration.
Geographic landmarks with high concentrations of migratory bat activity indicate
important areas for seasonal movements. For example, areas of land adjacent to barriers
(such as expanses of water) are known as stopover sites where concentrations of
migratory animals (e.g. birds) stop and, depending on the type of animal, refuel before
continuing their journey. Sites adjacent to geographical barriers (e.g., The Great Lakes),
like Long Point, ON, often serve as stopping sites for migratory bats and often have
higher capture and activity rates during spring and late summer and fall than during other
times of the year (Barclay 1984; Barclay et al. 1988; Dzal et al. 2009; McGuire et al.
2012; Hooton 2010). However, other geographical features, in relation to land and water,
may focus migrating bats during moments to eventual final destinations (Baerwald and
Barclay 2009; Furmankiewicz and Kucharska 2009).
Linear landscape features may be important to the migration of bats. Linear
landscape features such as mountains (Baerwald and Barclay 2009) and rivers
(Furmankiewicz and Kucharska 2009; Serra-Cobo et al. 2000) host heightened numbers
of bats during migratory periods and may be used for seasonal or territorial directional
flight. Shorelines (Ahlén et al. 2009; Barclay 1984; Serra-Cobo et. al. 1998) and forested
ridges (Fiedler et al. 2007) are other possible concentrated areas for migration of bats.
Migrating bats appear to follow the coast of oceans (Ahlén et al. 2009; Cryan
2003, Jarzembowski 2003; Serra-Cobo et al. 2000) and large lakes (Barclay 1984; Timm
4
sometimes landing on oil rigs and ships (Ahlénet al. 2009; Czene et al. 2011; Griffin
1970) and on coastal islands (Cryan and Brown 2007; Johnson et al. 2011). Some
nocturnally migrating birds follow coastlines to avoid crossing ecological barriers and
navigate by landmarks (Alerstam 1990), and migratory bats may also use this strategy.
For example, Timm (1989) suggested migrating bats “funnel” down the north-south
oriented shore line of Lake Michigan, rather than cross open water. Likewise, Barclay
(1984) observed bats flying along the shore of Lake Winnipeg, another north-south
oriented shoreline, during migration rather than traversing the lake. These examples
support Alerstam’s (1990) barrier avoidance theory, however, migratory bats also cross
large bodies of water (Ahlén et al. 2007; Amengual et al. 2007; McGuire et al. 2012). For
example, McGuire et al. (2012) documented migratory bats crossing Lake Erie, an
east-west oriented shoreline, during southward migration. The decision to cross water barriers
or follow coastlines could depend on the land mass direction and the potential cost of
energy to cross or to detour around a water barrier. Migrant bat species possibly use
linear-like shorelines as a navigable tool if the coast is oriented in the direction of
migratory flight.
Ridges are prominent linear-like landscape features that can span across long
areas. Wind energy facilities located along ridgelines experience some of the highest bat
mortalities in North America compared to other areas, suggesting that bats concentrate
along ridges during migration (Fiedler et al. 2007; Johnson et al. 2004; Kunz et al. 2007).
However, most research conducted on ridges is within areas where wind turbines are
located (Arnett et al. 2008). There is little known about how migratory bats interact with
5
Migratory birds may migrate along topographical features during migration, but
species can exhibit different movement patterns labeled as broad-front and narrow-front
migration (Ralph 1981). Broad-front migration refers to migratory behavior moving in a
constant direction regardless of topography while narrow front refers to concentrations of
migration at topographical features (Berthold 1993; Ralph 1981) such as mountains, river
valleys and shores. Migrating bats may also use particular geographic areas during
migration; however migrant bat species have different migratory strategies often based on
their life history. The importance of landscape features and movement patterns to migrant
bats may be determined by their type of migration strategy.
1.2 Migration strategies and seasonal activity
In North America, bats display both latitudinal and regional migration strategies.
Latitudinal migrants annually move across a north-south gradient and can travel greater
than 1000 km between summer and winter grounds (Bisson et al. 2009; Fleming and Eby
2003). Latitudinal migrants, Lasiurus borealis,Lasiurus cinererus and Lasionycteris
noctivagans, are considered “tree-dwelling” bats (Cryan and Veilleux 2007), with
Lasiuris spp often roosting solitarily or in small family groups in tree foliage (Cryan and
Veilleux 2007) and L. noctivagans in groups in cavities or solitarily under bark (Barclay
and Kurta 2007; Campbell et al. 1996). However, roosting in trees in the winter increases
body exposure to weather fluctuations and may cause Lasiurus and Lasionycteris spp to
migrate long distances to southern latitudes that are less susceptible to freezing conditions
(Cryan and Veilleux 2007). The summer ranges of Lasiurus and Lasionycteris spp ranges
6
the south-eastern United States, Mexico, and into South America (Cryan 2003; Shump
and Shump 1982 a,b).
Regional migrants move in a multi-directional radiation from hibernacula to
surrounding areas, approximately within a 600 km radius, in the spring and make return
movements in fall (Fleming and Eby 2003). Presumed regional migrants, Myotis
lucifugus and Perimyotis subflavus, hibernate in caves, abandoned mines, or rock
crevices in the winter (Fenton 1969; Trombulak et al. 2001), but in the spring females
form maternity colonies to rear young, while males remain solitary. Since temperatures in
caves remain constant, regional migrants can hibernate throughout the winter in the same
region that they breed, thus they do not make large migratory movements compared to
those of latitudinal migrant species.
Latitudinal and regional migrants in North America have similar time frames for
seasonal movement. Overall activity levels increase in the spring as latitudinal species
move from southern to northern latitudes and regional species emerge from hibernation
and move into surrounding areas. Sex-biased variations exist in the temporal patterns
where female latitudinal and regional migrants arrive at summer grounds earlier than
males and often make longer distance movements (Cryan 2003; Davis and Hitchcock
1965: Fleming and Eby 2003; Findley and Jones 1964; Humphrey and Cope 1976;
Valdez and Cryan 2009). These sex differences may be driven by the energy demands
and roost requirements of pregnancy and pup-rearing as theorized by Fleming and Eby
(2003). During the summer months, increased activity occurs during periods of lactation,
(June-July) and when young-of-year are volant and able to forage independently
7
migrate south for the winter. Relatively little is known about migration rates for North
American latitudinal migrants however activity at stopover sites adjacent to barriers
indicate noticeable influxes of activity, sometimes in multiple waves, where individuals
may only stay one to two days in the area (Barclay et al. 1988; Hooton 2010; McGuire et
al. 2012). Within a similar time period, regional migrants make migratory movements to
mating areas called swarming sites, which are typically also hibernation locations (Fenton
1969; Glover and Altringham 2008).
Although regional and latitudinal migrants have similar temporal activity, there is
limited information about the spatial distribution of latitudinal and regional migrants
during migration periods. Latitudinal migrants can be difficult to locate, capture, and
track because they do not form large roost aggregations (Kunz and Lumsden 2003), and
often fly above the forest canopy (Kalcounis et al. 1999; Menzel et al. 2005). Knowledge
about latitudinal migration has increased in recent years with contributions from
recording seasonal mortality at wind energy facilities (Arnett et al. 2008; Baerwald and
Barclay 2009) and use of stable hydrogen isotope analysis to further understand seasonal
distribution at a continental level (Cryan 2003, Fraser et al. 2012). Since latitudinal
migrants partake in migrations outside of a regional summer area, it is possible that they
adopt a narrow-front migration strategy and migrate according to landscape features to
aid in navigation.
Most evidence of regional migration of bats in North America comes from
banding projects where recoveries of bands and banded animals provide minimum
straight-line distance between two locations of capture (Ellison 2008; Fenton 1969; Kurta
8
capture and relocation because they often congregate in large numbers (Fenton 1969).
Although M. lucifugus and P. subflavus species are generally considered regional
migrants (Bisson et al. 2009), recent research indicates that P. subflavus may make
substantial migratory movements more similar to latitudinal migrants (Fraser et al. 2012).
Thus, much remains unknown about migration of categorized regional migratory species
and where they move across the landscape. However, landscape features may be less
important to regional migrants, compared to latitudinal migrants, as a possible
navigational tool during migration depending on hibernacula location in relation to
summer roosting areas, and regional migrants may therefore have broad-front movement
9 1.3 Statement of Purpose
The objective of my research was to determine the seasonal relationships between
the occurrence and activity of four species of bats and prominent landscape features. I
hypothesize that during different seasonal periods species categorized as latitudinal
migrants, L. cinereus and L. borealis, would use landscape features similar to a narrow-
front migration strategy, while species categorized as regional migrants, M. lucifugus and
P. subflavus, would exhibit a broad-front migration strategy.
1) I predicted that L. cinereus and L. borealis activity would be greater at north-south
oriented shoreline and ridge features than in flat regions since features may be used as
navigational tools in north-south oriented migration to winter or summer roosting
grounds.
2) I predicted that M. lucifugus and P. subflavus activity would be similar throughout the
region, regardless of feature since hibernation sites can be located in any cardinal
direction on the landscape.
3) I predicted that activity levels would increase in the mid-seasonal time period for all
species because of foraging activity and increased populations due to volant juveniles.
However, I predicted that L. cinereus and L. borealis will have higher activity in the
late-seasonal time period compared to M. lucifugus and P. subflavus corresponding to
10 2. Methods
2.1 Study Sites
I established study sites in the Southwestern region of Ontario, Canada along
three main transects defined as: ridge, shore, and central features, and a fourth grouping
at barrier adjacent features (Figure 1; Appendix II; Table A1). Ridge sites (n=4) were
located on the Niagara Escarpment which is a largely forested ridge extending 725 km in
a north-south oriented direction in Southwestern Ontario and reaching an elevation of 510
m at its highest point. Shore sites (n=2) were located along the Lake Huron shoreline
which extends 328 km from the tip of the Bruce peninsula to Sarnia, Ontario on the west
side of Southwestern Ontario and parallels the Niagara Escarpment. Central sites (n=3)
were located between ridge and shore features in Southwestern Ontario where the
landscape is mainly composed of flat, agricultural land. Barrier sites (n=3) were in areas
located adjacent to a water barrier within my study area which is the first available land
for migratory animals to encounter. All twelve field stations were situated at provincial
and national parks and conservation areas due to the natural surroundings of the area,
staff availability, equipment protection, and the presence of elevated platforms (i.e.
11
Figure 1: Location of twelve field sites at landscape features (ridge n=4, central n=3,
12 2.2 Data Collection
To assess bat activity at each of my sites, I recorded echolocation calls as a proxy
for overall activity (Fenton 1970; Kuntz and Brock 1975; O’Farrell and Gannon 1999). I
recorded echolocation calls using Song Meter SM2BAT (Wildlife Acoustics Inc.,
Concord, MA, USA) single microphone detectors, which are passive recording devices.
The recording devices are programmable frequency-triggered ultrasonic detectors that
record data on a secure digital high capacity (SDHC) memory card. Calls were recorded
at a sampling frequency of 192 kHz with 16 bit sample resolution. Recordings were made
in the presence of triggering noises that were within the range of set parameters that
included upper and lower frequency cut-off, sound amplitude, post-trigger filter, and
gain. Based on my parameters, a trigger event would occur if the noise was between 16
and 92 kHz also known as the upper and lower frequency cutoff. The sound amplitude of
the noise was at least 18 dB in audible strength to trigger recording. The post-trigger
began after 0.5 seconds of another detected call. The gain was set to 48, the second
highest most sensitive setting available, to increase the detection of bats and to reduce
recording poor-quality calls however this also may increase noise detection and power
consumption. A file was a triggered event that was 1 minute in length.
I installed one SM2BAT at each site. The weatherproof, ultrasonic microphone
was attached to an extendable 10 m cable connected to the recording box-shaped (20.3 x
20.3 x 5.1 cm) SM2BAT unit, which was placed within a security box. Findings suggest
that some migratory bats may fly at higher altitudes than other bats (Baerwald and
Barclay 2009; Reynolds 2006), so I placed microphones 5 m above ground to increase
13
habitat, and staff accessibility requirements. I oriented each microphone parallel to the
ground, facing south, in an open area with the microphone pointed away from buildings
or obstacles that might obscure a bat’s flight path. Every week voluntary staff members
changed batteries and downloaded data onto an external hard drive.
I recorded nightly activity every night from 13 May 2011 to 13 October 2011. I
set the SM2BATs to begin recording at sunset and to stop recording at sunrise. Migratory
activity may occur before or after these dates (Figure A3a; Figure A3b), but due to
equipment and location availability I was unable to extend the sampling period. I used
weather sensors located within the SM2BAT units to record temperature since lower
temperature negatively affects bat activity (Erickson and West 2002). Each night, I
collected average wind speed and temperature recorded by the closest Environment
Canada weather station available (www.weatheroffice.gc.ca) from each site, as this was
the only data available across all locations.
At each site I used land classifications based on the Ontario Ministry of Natural
Resource’s Southern Ontario Land Resource Information System (Version 1.2. OMNR
2008) in ArcGIS 10.0 (ERSI, Inc., 1999-2010) to measure the distance from the
microphone to the closest forest (m), distance to the closest water source (m), and
distance to the nearest building (m) (Appendix II; Table A1). To assess habitat type, I
classified a 5 km radius surrounding the detector location into percentage of land type:
forest (coniferous, deciduous, mixed), built-up (pervious e.g. playgrounds and impervious
14 2.3 Call Analysis
The number and measured characteristics of bat calls were identified through an
automated detection algorithm in a MATLAB based analysis program (callViewer, v18;
Skowronski and Fenton 2008). The program identifies and measures recorded sounds
based on detection parameters that include minimum and maximum frequency, frequency
with most energy, and duration, which were written into an Excel file. The callViewer
links-algorithm function detection parameters for identifying calls was set to a minimum
link length of 10, a minimum energy of 14 dB, with an echo filter threshold at 10 dB, and
the lower cutoff frequency at 15 kHz (Skowronski 2008; Skowronski and Fenton 2008). I
manually analyzed 5% of my randomly selected files per site to ensure callViewer
parameters were identifying bats calls correctly. A noise filter script was applied to the
files in R (version 2.14.1; R development core team 2011), discarding any value less that
.99 ms or greater than 30 ms, any frequency lower than 15 kHz or greater than 60 kHz,
and harmonics greater than 1 to remove ambient noise. A quadratic discriminant function
analysis (DFA) script (written by Amanda Adams, Ph.D Candidate at UWO) in R was
used to automatically classify bat calls into four species, L. cinereus, L. borealis, M.
lucifugus, and P. subflavus based on unique characteristic parameters of each Ontario bat
species (Figure 2). Although putative latitudinal migrant L. noctivagans’s echolocation
calls are recordable by acoustic detectors, it is difficult to distinguish these calls from
those of the sympatric Eptesicus fuscus. Therefore, I did not include the calls of these
species in my final analysis. Classification accuracy by the DFA using a jack-knife leave
one out validation was: M. lucifugus 90.0 %, L. cinereus 90.4 %, L. borealis 87.9 %,
15
misclassified calls detected in callVeiwer and classified by the DFA (Table 1). I checked
20 files each for each of the 12 sites (240 files) to assess accuracy of classification to
species. Each file that I checked was typically comprised of a series of calls from a single
bat. In cases where the DFA mistakenly identified multiple species within a file, the most
common species identification was applied and only counted the calls identified for that
16
Figure 2. A typical image of an echolocation call produced by species: a) Lasiurus
cinereus b) Lasiurus borealis c) Perimyotis subflavus and d) Myotis lucifugus. The
17
Table 1: Species-specific post filter parameters for call classification in Discriminant
Function Analysis.
Species Call Duration (ms) Minimum Frequency Range
(kHz)
Lasiurus cinereus <8, >30 <15, >29
Lasiurus borealis <5, >30 <28, >40
Perimyotis subflavus <5, >15 <36, >46
18 2.4 Statistical Analyses
To test my hypothesis that latitudinal migratory bats use linear landscape features
during migration, I analyzed bat activity (number of bat calls per night for each species)
at each feature (shoreline, ridge, central, barrier) in relation to date. I conducted all
statistical analysis in R. After initial data exploration, I chose not to remove any outliers
due to the nature of my investigation where outliers may be indicative of migratory
activity. I used a factorial ANOVA to determine if overall activity levels per species
differed among landscape features and a Tukey’s post hoc test to determine the
relationship between features and season.
My final data set included number of calls per species, temperature, wind speed,
feature, site, distance to water, distance to building, and distance to forest. Before data
modeling, the distribution of calls was right skewed, so I applied a data transformation.
Lasiurus cinereus data was transformed by ln(x + 1) and all other species were
transformed as ln(x + 0.5). Wind speed, distance to buildings, and distance to water were
also transformed due to right-skewed non-normality. I applied an ln(x+1) transformation
to wind speed, a ln(x+0.5) transformation to distance to buildings, and a square root
transformation to distance from water.
Generalized Additive Mixed Modeling
My data followed a non-linear pattern thus I applied statistical models that were
not based on linear assumptions. A generalized additive mixed model allows for
non-linearity and the ability to use smoothing curves by plotting moving averages. It also
allows for hierarchical data and includes fixed and random variables (Zuur et al. 2009). I
19
considered nested within feature. Within my statistical model, I tested and controlled for
explanatory variables of feature (ridge, shore, central), habitat (distance from water,
distance from building, distance from forest), latitude, and weather (temperature, wind
speed). Date was treated as repeated measure. I used ANOVAs to identify significance of
multiple variables. I used backward stepwise selection, to remove the least significant
variable one at a time until only significant variables (p < 0.05) remained. After plotting
the results, I used a Plot Digitizer (free Software, Inc., Boston, MA) to identify high
activity on the plotted output graphs.
Latitude and peak activity
I identified activity peaks as data points that were three standard deviations higher
than the mean of the number of calls at each site. I defined late-seasonal period from 1
August to 1 October based on literature review (Table 2). I used a Pearson’s correlation
to examine the relationship of peak activity at latitude and date for each feature for each
species. I used an exact poisson test to compare the frequency of peaks per species and
per feature in two month periods which I defined as mid-seasonal period (1 June to 30
July) and late-seasonal period (1 August to 1 October). The early-seasonal time period
20
Table 2: A literature review documenting the month(s) with the highest latitudinal and
regional bat species activity within the study sampling period by location, indicative of
migratory activity.
State/Province Increased activity Source
Alberta August (mid); September (early) Baerwald and Barclay 2009
Alberta August to October Brown and Hamilton 2006
Arkansas August(mid) to September (mid) Perry et al. 2010
California September(mid) Cryan and Brown 2007
California August to September Dalquest 1943
Illinois August (mid) to October (mid) Timm 1989
Iowa July; August; September Arnett et al. 2008
Manitoba September (early) Barclay 1984
Maryland September (early) to November Johnson et al. 2011 Massachusetts August (late) to September (mid) Miller 1897 Minnesota July (mid) to September (mid) Johnson et al. 2004 Nebraska September(late)- October(mid) Damm and Gelosuo 2008
New Mexico August Findley and Jones 1964
New York July (mid) to August (mid) Jain et al. 2007
Ontario August (mid) Dzal et al. 2009
Ontario August; September Fenton 1969
Ontario August to September Hooton 2010
Ontario August(late) to September (mid) McGuire et al. 2012 Pennsylvania; Maryland August; September Agosta et al. 2005 Tennessee August to September(mid) Fiedler et al. 2007
West Virginia August(mid) to October (early) Kerns and Kerlinger 2004 West Virginia/
Pennsylvania
21
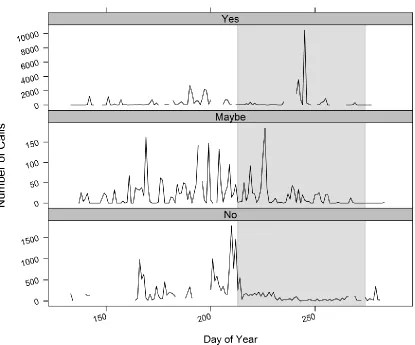
Categorizing late-seasonal peak activity at each site and feature
Activity for each species was variable among sites and it was sometimes difficult
to discern potential migration activity (Appendix; Figure A4:A7). To summarize
late-seasonal period (1 August to 1 October) migratory activity levels, I used a set of criteria
to score if the peaks of activity in the late-seasonal period more closely resembled
migration activity (yes), were questionable (maybe), or likely not (no). An example of
raw data and corresponding label according to criteria is shown in Figure 3. After testing
and discarding other thresholds, I only considered peaks that were three standard
deviations above the mean within site which was able to capture all outlier peaks. First, I
assessed and marked each site by species with eight different categories to determine if
the peak was: the same peak, within the late-seasonal period, within 1st week of the
late-seasonal period, lone, high, near foraging activity, and near summer activity.
The same peak: Some sites had multiple peaks and if they were within two days of each
other I considered it one peak. Each peak was taken into account and assessed in relation
to all other peaks.
Within the late-seasonal period: I assessed if peaks were located within the determined
late-seasonal migration period of 1 August to 1 October.
Within 1st week of the late-seasonal period: I determined if the peak was within seven
days of 1 August. Since bats possibly migrate outside of my defined late-seasonal
guidelines, I considered peaks in the first week of August to possibly be continued
22
Figure 3: Examples of raw call data across day of year at three sites for Lasiurus borealis
with labels (Yes, Maybe, No) of possible migration activity based on categorization
criteria. The gray box indicates potential late-seasonal migration time period defined as 1
23
Lone: I determined if peaks were lone, which I defined as either constituting the only
peak at the site or being ten days or more from other identified peaks and not considered
part of other foraging or mid-seasonal activity.
High: I identified peaks that were four standard deviations above the mean to determine if
there was a large difference of activity comparable to the other identified peaks.
Near foraging activity: If the site had high constant levels of activity spanning most of the
mid-seasonal period, I classified it as foraging-like activity. Typically, this category
corresponded with peaks within the first week of August.
Mid-seasonal activity: I determined if the peak was attached to increased activity within
the last week of July, usually in relation to peaks located within the first week of August.
After taking into account specific categories and the relation to the overall
seasonal activity I then gave each site for each species a yes, maybe, or no for
late-seasonal migration (Figure 3). For example, a definite yes would be a peak that was later
than the first week in August, was lone and high, and there was no connection to
mid-seasonal or foraging activity. A no typically was within the first week of August, had
connection to foraging and/or mid-seasonal activity, and was not lone or high. A maybe
was a peak that had some aspects of a combination of the criteria such as where multiple
peaks were classified as one peak, was at the end of the first week in August but within
the late-seasonal period, was high and lone, not near foraging, but may represent
migration or a late mid-seasonal period activity peak.
I then used a scoring system to determine a numerical classification of overall
24
would assign a numerical 3, maybe I would assign a numerical 2, and no I would assign a
numerical 1. I added together the site scores of the yes, no, and maybe status labels to get
an overall score for feature (Table 3). I created an index to classify the activity level
during the late-seasonal time period at each feature based on the possible numerical
scores. I created 5 activity level categories labeled as very low, low, medium, high and
very high (Table 4). I first determined what the overall lowest and highest numerical
score could be for each feature based on the sample size (Table 3) and assigned labels of
very low or very high to those scores. For example, if the lowest possible score for the
shore was 2 then the corresponding label was very low (Table 4). Only the shore feature
had 5 possible scores that paired evenly with the 5 activity labels. The other features had
more potential numerical scores than the 5 activity labels so I only assigned one possible
score to very low, high, and very high labels to have a conservative ranking for those
categorizes and then evenly distributed number scores in the low and medium labels as
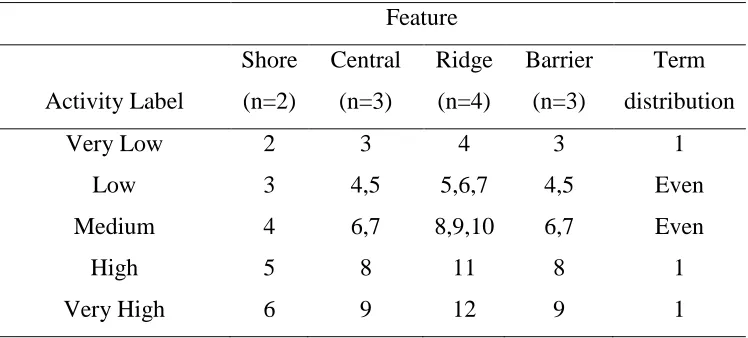
defined as term distribution (Table 4). Based on the overall score (Table 3), I assigned an
activity label (Table 4). For example, P. subflavus received an overall score of 4 (Yes=3
+ No=1) at the shore (Table 3), so its’ activity label at the shore was Medium (Table 4)
25
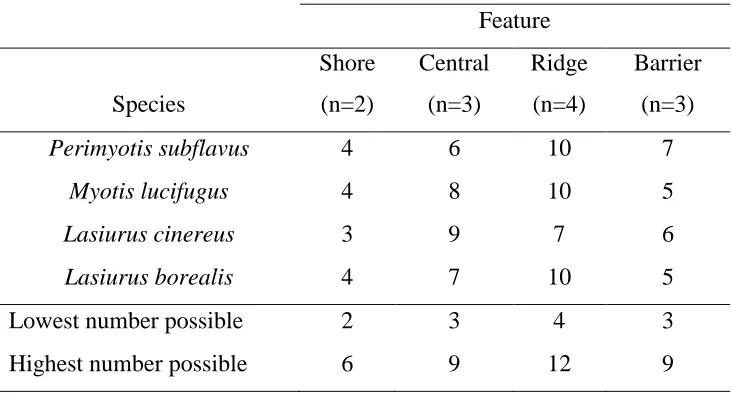
Table 3: The sum of numerical scores by species and feature that corresponded to an
assigned status (Yes=3, Maybe=2, No=1) applied to each species at individual sites based
on a set of peak assessing criteria that determined the level of possible migratory activity
within the late-seasonal period (1 August to 1 October). The lowest number possible was
the lowest score that could be assigned to a species at a site multiplied by the sample size
at each feature while the highest number possible was the highest score that could be
assigned to a species at a site multiplied by the sample size at each feature.
Feature
Species
Shore
(n=2)
Central
(n=3)
Ridge
(n=4)
Barrier
(n=3)
Perimyotis subflavus 4 6 10 7
Myotis lucifugus 4 8 10 5
Lasiurus cinereus 3 9 7 6
Lasiurus borealis 4 7 10 5
Lowest number possible 2 3 4 3
26
Table 4: The distribution of the possible sum of site scores a species could have received
based on a numerical score that corresponded to a status (Yes, No, Maybe) that was given
to each species at each site based on a set of peak assessing criteria that determined the
level of possible migratory activity within the late-seasonal period (1 August to 1
October) and a corresponding activity label that indicates the level of overall possible
migratory activity during the late-seasonal period (1 August to 1 October) at a feature that
could be assigned to each species. The term distribution indicates how many numbers or
groups of numbers that are allowed in the activity label row. The numbers that are
possible sum of scores are determined by the sample size of each site.
Feature
Activity Label
Shore
(n=2)
Central
(n=3)
Ridge
(n=4)
Barrier
(n=3)
Term
distribution
Very Low 2 3 4 3 1
Low 3 4,5 5,6,7 4,5 Even
Medium 4 6,7 8,9,10 6,7 Even
High 5 8 11 8 1
Very High 6 9 12 9 1
27 3. Results
3.1 Mean activity for feature and season by species
I recorded data on 153 nights, for a total of 1173 microphone nights across sites
and detected all four species. Lasiurus cinereus calls made up half of the total recordings
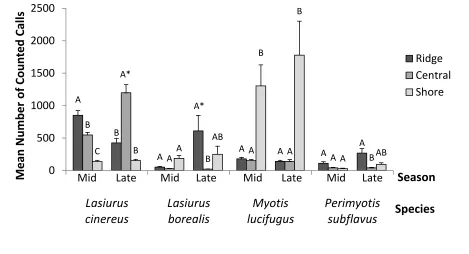
(Table 5). Comparing within species, L. cinereus had the greatest activity at the ridge
during the mid-seasonal time period but had greater activity at the central feature during
the late-seasonal time period ( = 33.72, p < 0.0001; Figure 4) which increased
significantly from the mid-seasonal time period ( =29.72, p < 0.0001). Lasiurus
borealis had the highest activity at the ridge and shore features during the late-seasonal
time period with a significant increase of activity at the ridge feature from the
mid-seasonal time period ( =3.07, p < 0.047). Myotis lucifugus had the greatest activity
at the shore for both seasons ( =39.26, p < 0.001). Within the late-seasonal time
period, P. subflavus had the greatest activity at the ridge and shore features ( =2.23,
p < 0.0002).
3.2 Activity patterns across landscape features
Lasiurus cinereus activity at the ridge transect increased at 19 June (Day of Year
= 160) and remained consistently high until gradually decreasing beginning at
approximately 7 August (219; =10.177, p < 0.001; Figure 5). At the central transect,
peak activity levels correspond to 1 June (152), 18 August (230) and 27 September (270;
= 10.820, p < 0.001), the last two dates occurring within the putative late-seasonal
migration time period from 1 August (213) to 1 October (274). There was no
28
Table 5: The total number of calls and percent of total recordings of each species at each site and feature.
Species
Lasiurus cinereus
Lasiurus borealis
Myotis lucifugus
Perimyotis subflavus
Feature Site label N % N % N % N % Site Total
Ridge R1 9991 36 2775 10 14266 51.5 692 2.5 27724
R2 119103 89.6 1793 1.3 8577 6.5 3435 2.6 132908
R3 21030 71.6 568 1.9 6382 21.7 1382 4.7 29362
R4 131826 35.1 131012 34.9 38579 10.3 73773 19.7 375190
Total Ridge 281950 49.9 136148 24.1 67804 12 79282 14 565184
Central C1 41452 68.2 1753 2.9 16790 27.6 773 1.3 60768
C2 157098 96.4 2138 1.3 2541 1.6 1260 0.8 163037
C3 95776 66.7 4526 3.2 31049 21.6 12282 8.6 143633
Total Central 294326 80.1 8417 2.3 50380 13.7 14315 3.9 367438
Shore S1 26119 6.8 42831 11.1 307059 79.4 10614 2.7 386623
S2 3633 52.4 1672 24.1 848 12.2 777 11.2 6930
Total Shore 29752 7.6 44503 11.3 307907 78.2 11391 2.9 393553
Barrier B1 16133 22.1 2417 3.3 54182 74.3 224 0.3 72956
B2 157605 57.7 19528 7.2 19518 7.2 76267 27.9 272918
B3 158197 81 14602 7.5 14258 7.3 8193 4.2 195250
29
Figure 4: Mean activity levels for each species at ridge (n=4), central (n=3), and shore (n=2) features within Mid (1 June to 31 July)
and Late (1 August to 31 September) seasonal time periods (N=926 recording nights). Error bars represent S.E. from the mean.
Differences of activity were compared within species; not among species. Upper case letters (e.g. A,B,C) compare activity at feature
(ridge, central, shore) within the same time period while asterisks (*) indicate significant differences of the same feature between
seasons (Mid, Late).
A
A A A
B
A A A
C A
B
A B
A*
A A
A*
B A B
B AB B AB 0 500 1000 1500 2000 2500 Lasiurus cinereus Lasiurus borealis Myotis lucifugus Perimyotis subflavus M e an Number of Coun te d Ca lls Season Ridge Central Shore Species
30
Lasiurus borealis activity gradually increased in the mid-seasonal period and
decreased in the late-seasonal period at ridge ( ,= 20.637; p < 0.001) and central
( ,=14.140; p < 0.001) features (Figure 5). At the shore feature, L. borealis activity
peaked on 24 July (205) and slightly peaked at 7 September (250; =10.505, p <
0.001).
Myotis lucifugus activity increased overall near 27 July (208) at ridge ( =
50.662, p < 0.001), central ( = 30.859, p < 0.001), and shore ( = 16.967, p < 0.001)
sites with no strong peaks in early or late-seasonal periods at any of the features (Figure
5a).
Perimyotis subflavus had a noticeable increase of activity between 2 August
(214) and 13 August (225), at all three landscape features (Figure 6) but no other
dominant peaks.
No habitat variables had significant influences on activity for any of the species
(GAMM p >0.05).
3.3 Temperature and wind speed
Activity for all species significantly increased with rising temperature to an upper
limit of approximately 25 degrees Celsius (Figure 7, GAMM p < 0.001; or approximately
20 degrees Celsius adjusted Appendix III; Figure A2) then activity decreased. The mean
temperature across the sampling period was 22.8 °C ± 4. Bat activity increased at low to
31
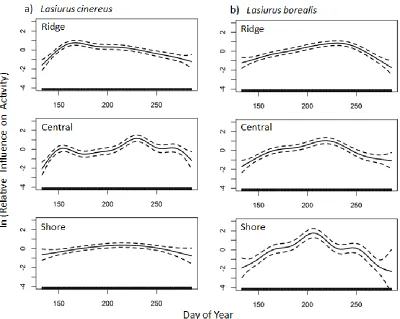
Figure 5: The relative activity levels for categorized latitudinal migrants a) Lasiurus
cinereus and b) Lasiurus borealis over recording nights (n=1703) from 13 May (day of
year 133) to 13 October (day of year 286) across three landscape features, ridge (n=4),
central (n=3), and shore (n=2). The graphs show a fitted line for activity trends across
sites (solid line) ± SD 1 (dotted line) based on generalized additive mixed models. The
y-axis shows relative activity, after controlling for other variables, where activity changes
32
Figure 6: The relative activity levels for categorized regional migrants a) Myotis lucifugus
and b) Perimyotis subflavus of recording nights (n=1703) from 13 May (day of year 133)
to 13 October (day of year 286) across three landscape features, ridge (n=4), central
(n=3), and shore (n=2). The graphs show a fitted line for activity trends across sites (solid
line) ± SD 1 (dotted line) based on generalized additive mixed models. The y-axis shows
relative activity, after controlling for other variables, where activity changes positively or
negatively by date.
33
Figure 7: Activity levels in relation to temperature for each species. The graphs show a
fitted line (solid line) ± SD 1 (dotted line) based on generalized additive mixed models.
The y-axis shows relative activity, after controlling for other variables, where activity
changes positively or negatively by temperature.
ln (R
el
ativ
e I
nf
lu
en
ce
on
A
ctiv
ity)
34
Figure 8: Influence of log wind speed on activity levels by species. The graphs show a
fitted line (solid line) ± SD 1 (dotted line) based on generalized additive mixed models.
The y-axis shows relative activity, after controlling for other variables, where activity
changes positively or negatively by wind speed. ln (Wind Speed)
ln (R
el
ativ
e I
nf
lu
en
ce
o
n A
ctiv
35 3.4 Temporal and spatial patterns of peak activity
Overall, late-seasonal peak activity had a marginally negative but non-significant
relationship with latitude (Pearson’s Correlation = -0.126, p = 0.155). There was no
significant linear relationship between latitude and day for any species at any feature
(Pearson’s Correlation p > 0.1103), however late seasonal activity peaks for P. subflavus
at the ridge feature had a marginally negative linear relationship with latitude (Pearson’s
Correlation = -2.186, p = 0.057). The overall frequency of peak activity for P.
subflavus increased in the late-seasonal period compared to the mid-seasonal period
(Exact Poisson Test = 0.40, p = 0.017) while all other species did not have a
significant difference of peak activity between periods (Exact Poisson Test p > 0.2).
Comparing frequency of peak activity by species at each feature, P. subflavus’s peak
activity significantly increased from mid-seasonal period to late-seasonal period at the
ridge feature (Exact Poisson Test = 0.182, p = 0.022).
Trends in peak activity varied across species (Figure 9). Lasiurus cinereus had the
earliest occurring peaks, at 21 May (141) at two lower latitudes for ridge and barrier sites
(B2: 42°58 N; R3: 43°47 N). Lasiurus borealis activity peaked at 18 June (169) at the
higher latitudinal located sites for ridge (R1: 44°52 N) and barrier (B1: 45°26 N) features.
Increased frequency of activity peaks across all species occurred between 12 July (193)
and 1 August (213). The majority of peak activity for P. subflavus occurred early within
the late-seasonal period clustering around 6 August (218) across latitudes and all
landscape feature types. Lasiurus cinereus had no clustering but rather, was randomly
spread across time and latitude (Figure 9). In contrast, P. subflavus, M. lucifugus, and L.
36
features and latitudinal locations. Lasiurus borealis had no more peak activity after 6
September (249) while all other species had later peak activity. M. lucifugus had the latest
peak in activity at one barrier site (B2: 42°58 N) at 5 October (278).
The highest clustering of peak activity across species occurred on two dates, 6
August and 2 September, which were both located within the late-seasonal migratory
period. The average temperature was 23 degrees Celsius (28 degrees Celsius internal
37
Figure 9: Latitudinal site locations of peak activity, defined as three standard deviations
above the mean, color coded by feature and separated by species within the sampling
period of 13 May (133) to 13 October (287). The gray box indicates the potential
38
3.5 Categorizing peak activity in the late-seasonal period for sites and feature
According to the criteria, late-seasonal migratory activity occurred for all species
at central site C1 and ridge site R4 (Figure 10). At the shore sites, migratory activity for
all species except for L. cinereus was present at site S1, while S2 had little to no
indication of late-seasonal migratory activity for any species (Figure 10), thus all species
scored a medium level of late-seasonal migratory activity at the shore feature except L.
cinereus, which had an overall low late-seasonal migratory activity score (Table 6).
Late-seasonal migratory activity occurred at all central sites for L. cinereus (Figure 10), and
this species received an overall very high late-seasonal migratory activity level score for
the central feature (Table 6). Myotis lucifugus also scored a high level for late-seasonal
migratory activity at central sites (Table 6). Central site, C3, had no late-seasonal
migratory activity for either P. subflavus or L. borealis (Figure 10). At the ridge feature,
all species, except for L. cinereus, indicated positive medium late-seasonal migratory
activity (Table 8), but there were no uniform presence, possible, or absent activity trends
across any sites or species except for R4 (Figure 10). All species scored medium to low
late-seasonal migratory activity levels at barrier sites with B2 having the lowest presence
of activity during the late-seasonal migratory period for any species (Figure 10).
3.6 Summary of species activity at feature
Lasiurus cinereus was the only species with strong late-seasonal activity
associations at the central featureless landscape across multiple analysis methods (Table
7). Myotis lucifugus activity received a high level score for late-seasonal migratory
39
preference at any landscape feature (Table 7). Late-seasonal migratory activity at linear
landscape features was weakly associated with L. borealis at the shore and P. subflavus at
40
Figure 10: A status of yes (black), maybe (grey), and no (white) with respect to potential
migratory activity in the late-seasonal period (1 August to 1 October) by species at each
site located on the map. The status was determined based on a set of peak assessing
41
Table 6: Activity labels that indicates the level of possible migratory activity during the
late-seasonal period (1 August to 1 October) at a feature for each species. The assigned
activity label corresponds to a site score sum by feature for a species that was based on a
status that was given to each species at each site determined by a set of peak assessing
criteria that assessed the level of possible migratory activity within the late-seasonal
period (1 August to 1 October).
Feature
Species
Shore
(n=2)
Central
(n=3)
Ridge
(n=4)
Barrier
(n=3)
Perimyotis subflavus Medium Medium Medium Medium
Myotis lucifugus Medium High Medium Low
Lasiurus cinereus Low Very High Low Medium
42
Table 7: Summary of results of each analysis method indicating greatest overall or migratory activity at a feature for each
species.
Species
Analysis Method Lasiurus cinereus Lasiurus borealis Myotis lucifugus
Perimyotis subflavus
Seasonal activity using
ANOVA (Figure 3) Central Ridge, Shore Shore Ridge, Shore
Late-seasonal migration using GAMM (Figure
4; Figure 5) Central Shore - -
Activity peaks at latitude and between
seasons (Figure 8) - - - Ridge
Indication of late-seasonal migration using criteria (Figure 9)*
Central / Shore, Ridge (Very High) / (Low)
Ridge, Central, Shore (Medium)
Central / Shore, Ridge (High) / (Medium)
43 4. Discussion
I predicted that L. cinereus and L. borealis, categorized as latitudinal migrants,
would have greater late-seasonal activity at ridge and shore landscape features during
seasonal transitional periods than M. lucifigus and P. subflavus, presumed regional
migrants. I found that seasonal activity at landscape features differed by species rather
than according to categorized migration strategy depending on the analysis. I also
predicted that activity would increase in the mid-seasonal time period for all species,
since bats increase in foraging activity and have increased populations due to volant
juveniles, but migratory peaks of activity at late-seasonal time periods would be more
defined for L. cinereus and L. borealis which was supported in my results. Bat species
may not have the same relationship to prominent landscape features based on shared
putative migration strategy. Understanding the interactions of migratory bats with
landscape features depends on the overall perception of landmarks based on location,
seasonal timing, analysis, and sampling methods.
4.1 Species activity at landscape features
What a migratory bat perceives as a prominent landscape feature could depend on
the species-specific behavior, regional location, and the magnitude of geographical
features. For example, some bat species may perceive “featureless” areas as a
“prominent” feature depending on species-specific characteristics and behavior. Lasiurus
cinereus is thought to forage in open habitats rather than closed forested areas (Fenton
1990; Ford et al. 2005; Jantzen 2012) based on wing morphology and call characteristics
(Norberg and Rayner 1987; Orbrist 1995). In addition, L. cinereus fatalities at wind
44
species (Arnett et al. 2008). Open, agricultural habitat surrounds the area of central sites
which may be better suited for open habitat foraging and migration by L. cinereus. My
study showed little evidence that L. cinereus use coastlines during migration in spite of
previous documentation of migratory activity at the Pacific Ocean and northern Atlantic
Ocean coastlines (Cryan 2003, Dalquest 1943, Findley and Jones 1964, Miller 1897,
Tenaza 1966). Species may use different coastlines disproportionately depending on
species range and winter destinations. Since L. cinereus’s range spans across both east
and west North America, from L. cinereus’s perspective, ocean shores, especially in west
coast areas, may be better for migratory navigation than the lakes like the Lake Huron
shoreline.
Other species like L. borealis, may perceive prominent landscape features, like
shorelines, as important for navigation during migration depending on the type of
coastline and the continental location. Lasiurus borealis has often been associated with
shorelines (Cryan 2003; Griffin 1970; Mackiewicz and Backus 1956; Miller 1897),
typically described on the Atlantic Ocean (Cryan 2003; Mackiewicz and Backus) due to
its eastern range in North America; however, geographical features in relation to lake
shorelines could also influence migration. For example, Lake Manitoba, located in central
North America (Winnipeg, Canada), receives high migration activity of L. borealis at
specific times of the year (Barclay 1984). As well, after collecting forty-three L. borealis
compared to one L. cinereus and M. lucifugus during the fall season on the west coast of
the north-south oriented Lake Michigan, Timm (1989) suggested that L. borealis
migrates along lake shorelines. Compared to Lake Michigan and Lake Manitoba, Lake
45
not as easily navigated, compared to other types of lake shore locations.Ridge features
may also be important for L. borealis during migration. Eastern forested sites with wind
turbines had increased mortality of L. borealis than other habitat types (Arnett et al.
2008). Forested ridges may provide suitable roosting habitat as this species roosts in trees
(Mager and Nelson 2001) and more active foragers at forested locations than at aquatic
areas in Ontario (Furlonger et al. 1987). During the migratory season, L. borealis may
follow portions of a coast and/or ridge before turning inland, thus migratory activity
spreads across other landscape features within the study area. However no study has
determined the magnitude of directional change of migrating bats.
Some species may perceive different features as important depending on the
season. Myotis lucifugus is historically abundant across Southwestern Ontario (Fenton
1980) and hibernates within its summer range (Fenton 1969). Across the non-hibernation
period, M. lucifugus often forages over water and wetlands (Anthony and Kunz 1977;
Belwood and Fenton 1976; Buchler 1976) possibly contributing to the overall higher
activity at shoreline areas. During June and July, female M. lucifugus form maternity
colonies often in buildings. An area with high agricultural abundance and with suitable
roosting structures available, like the central feature, may have greater roosting
populations of M. lucifugus. High influxes of migrants at central locations may account
for adults and young of year leaving roosting areas for swarming and hibernation
locations. However, directionality of departure to winter sites is unknown for summer
residents of M. lucifugus in southwestern Ontario but may be inferred with reference to
46
feature was associated with high migratory activity possibly due to the radial movement
within the regional area rather than using landscape features for navigational direction.
Similar to M. lucifugus, P. subflavus may use different landscape features
depending on the season. Compared to open areas characteristic of shore and central
features, rocky outcroppings and forested areas define the ridge feature. Evidence of
migratory activity of P. subflavus at ridges include studies where proportionally greater
P. subflavus fatalities occurred at wind turbines located at forested ridge locations (Arnett
et al. 2008; Fiedler 2004). Important habitat requirements of P. subflavus include forested
areas as it typically roosts in foliage of trees during the reproductive season and forages
in forest areas (Broders et al. 2003; Fujita and Kuntz 1984; Perry and Thrill 2007;
Veilleux et al. 2003). Rock crevices at ridges may also provide hibernacula for P.
subflavus (Barbour and Davis 1969; Fiedler 2004). The negative latitudinal trend within
the late-seasonal period at the ridge feature for P. subflavus could further support the idea
that this species makes larger southern migration movements than previously thought
(Fraser et al. 2012). However, P. subflavus migratory activity across other landscape
features within the late-seasonal time period indicates a wider dispersal of movement not
located at one specific landscape feature.
Although in some cases latitudinal migrant species have been known to use linear
landscape features like mountains (Baerwald and Barclay 2009), neither L. cinereus nor
L. borealis had any migratory association with the ridge feature in my study.
Geographical location and magnitude of the landscape feature may determine the
distribution of migratory activity. For example, Baerwald and Barclay (2009) suggest that