The diagnostic accuracy of the GenoType
®MTBDR
sl
assay for
the detection of resistance to second-line anti-tuberculosis
drugs (Review)
Theron G, Peter J, Richardson M, Barnard M, Donegan S, Warren R, Steingart KR, Dheda K
This is a reprint of a Cochrane review, prepared and maintained by The Cochrane Collaboration and published inThe Cochrane Library 2014, Issue 10
http://www.thecochranelibrary.com
T A B L E O F C O N T E N T S
1 HEADER . . . .
1 ABSTRACT . . . .
3 PLAIN LANGUAGE SUMMARY . . . .
4 BACKGROUND . . . .
Figure 1. . . 6
Figure 2. . . 7
8 OBJECTIVES . . . . 8 METHODS . . . . 12 RESULTS . . . . Figure 3. . . 13
Figure 4. . . 14
Figure 5. . . 15
Figure 6. . . 17
Figure 7. . . 18
Figure 8. . . 20
Figure 9. . . 22
Figure 10. . . 24
Figure 11. . . 25
Figure 12. . . 27
Figure 13. . . 28
Figure 14. . . 29
40 DISCUSSION . . . . 43 AUTHORS’ CONCLUSIONS . . . . 43 ACKNOWLEDGEMENTS . . . . 44 REFERENCES . . . . 47 CHARACTERISTICS OF STUDIES . . . . 86 DATA . . . . Test 1. Indirect, FQ, culture. . . 87
Test 2. Indirect, Ofl, culture. . . 88
Test 3. Indirect, Mx, culture. . . 88
Test 4. Indirect, SLID, culture. . . 89
Test 5. Indirect, Ak, culture. . . 90
Test 6. Indirect, Kn, culture. . . 91
Test 7. Indirect, Cm, culture. . . 92
Test 8. Indirect, XDR, culture. . . 93
Test 9. Indirect, FQ, sequencing. . . 93
Test 10. Indirect, SLID, sequencing. . . 94
Test 11. Indirect, XDR, sequencing. . . 94
Test 12. Indirect, FQ, sequencing and culture. . . 95
Test 13. Indirect, SLID, sequencing and culture. . . 95
Test 14. Indirect, XDR, sequencing and culture. . . 96
Test 15. Indirect, FQ, culture followed by sequencing of discrepants. . . 96
Test 16. Indirect, SLID, culture followed by sequencing of discrepants. . . 97
Test 17. Direct, FQ, culture. . . 97
Test 18. Direct, Ofl, culture. . . 98
Test 19. Direct, SLID, culture. . . 98
Test 20. Direct, Ak, culture. . . 99
Test 21. Direct, Kn, culture. . . 99
Test 22. Direct, Cm, culture. . . 100
Test 23. Direct, XDR, culture. . . 100
Test 24. Direct, FQ, culture followed by sequencing of discrepants. . . 101
Test 25. Direct, SLID, culture followed by sequencing of discrepants. . . 101
Test 26. Direct, XDR, culture followed by sequencing of discrepants. . . 102
102 ADDITIONAL TABLES . . . . 108 APPENDICES . . . . Figure 15. . . 109
Figure 16. . . 110
Figure 17. . . 115
Figure 18. . . 116
Figure 19. . . 117
Figure 20. . . 119 119 CONTRIBUTIONS OF AUTHORS . . . .
119 DECLARATIONS OF INTEREST . . . .
119 SOURCES OF SUPPORT . . . .
120 DIFFERENCES BETWEEN PROTOCOL AND REVIEW . . . .
[Diagnostic Test Accuracy Review]
The diagnostic accuracy of the GenoType
®MTBDR
sl
assay for
the detection of resistance to second-line anti-tuberculosis
drugs
Grant Theron1, Jonny Peter1, Marty Richardson2, Marinus Barnard3, Sarah Donegan2, Rob Warren4, Karen R Steingart5, Keertan Dheda6
1Department of Medicine, University of Cape Town, Cape Town, South Africa.2Department of Clinical Sciences, Liverpool School of
Tropical Medicine, Liverpool, UK.3Task Laboratory, Department of Biochemical Sciences, Faculty of Medicine and Health Sciences,
Stellenbosch University, Matieland, South Africa.4DST/NRF Centre of Excellence for Biomedical Tuberculosis Research, SAMRC
Centre for Tuberculosis Research, Division of Molecular Biology and Human Genetics, Faculty of Medicine and Health Sciences, Stellenbosch University, Matieland, South Africa.5Cochrane Infectious Diseases Group, Liverpool School of Tropical Medicine,
Liverpool, UK.6Division of Pulmonology, Department of Medicine, University of Cape Town, Cape Town, South Africa
Contact address: Grant Theron, Department of Medicine, University of Cape Town, H47.88, Old Main Building, Groote Schuur Hospital, Cape Town, Western Cape, 7798, South [email protected].
Editorial group:Cochrane Infectious Diseases Group. Publication status and date:New, published in Issue 10, 2014. Review content assessed as up-to-date: 30 January 2014.
Citation: Theron G, Peter J, Richardson M, Barnard M, Donegan S, Warren R, Steingart KR, Dheda K. The diagnostic accuracy of the GenoType®MTBDRslassay for the detection of resistance to second-line anti-tuberculosis drugs.Cochrane Database of Systematic Reviews2014, Issue 10. Art. No.: CD010705. DOI: 10.1002/14651858.CD010705.pub2.
Copyright © 2014 The Authors. The Cochrane Database of Systematic Reviews published by John Wiley & Sons, Ltd. on behalf of The Cochrane Collaboration. This is an open access article under the terms of theCreative Commons Attribution-Non-Commercial Licence, which permits use, distribution and reproduction in any medium, provided the original work is properly cited and is not used for commercial purposes.
A B S T R A C T
Background
Accurate and rapid tests for tuberculosis (TB) drug resistance are critical for improving patient care and decreasing the transmission of drug-resistant TB. Genotype®MTBDRsl (MTBDRsl) is the only commercially-available molecular test for detecting resistance in
TB to the fluoroquinolones (FQs; ofloxacin, moxifloxacin and levofloxacin) and the second-line injectable drugs (SLIDs; amikacin, kanamycin and capreomycin), which are used to treat patients with multidrug-resistant (MDR-)TB.
Objectives
To obtain summary estimates of the diagnostic accuracy of MTBDRslfor FQ resistance, SLID resistance and extensively drug-resistant TB (XDR-TB; defined as MDR-TB plus resistance to a FQ and a SLID) when performed (1) indirectly (ie on culture isolates confirmed as TB positive) and (2) directly (ie on smear-positive sputum specimens).
To compare summary estimates of the diagnostic accuracy of MTBDRslfor FQ resistance, SLID resistance and XDR-TB by type of testing (indirect versus direct testing).
The populations of interest were adults with drug-susceptible TB or drug-resistant TB. The settings of interest were intermediate and central laboratories.
Search methods
We searched the following databases without any language restriction up to 30 January 2014: Cochrane Infectious Diseases Group Specialized Register; MEDLINE; EMBASE; ISI Web of Knowledge; MEDION; LILACS; BIOSIS; SCOPUS; the metaRegister of Controlled Trials; the search portal of the World Health Organization International Clinical Trials Registry Platform; and ProQuest Dissertations & Theses A&I.
Selection criteria
We included all studies that determined MTBDRslaccuracy against a defined reference standard (culture-based drug susceptibility testing (DST), genetic testing or both). We included cross-sectional and diagnostic case-control studies. We excluded unpublished data and conference proceedings.
Data collection and analysis
For each study, two review authors independently extracted data using a standardized form and assessed study quality using the Quality Assessment of Diagnostic Accuracy Studies (QUADAS-2) tool. We performed meta-analyses to estimate the pooled sensitivity and specificity of MTBDRslfor FQ resistance, SLID resistance, and XDR-TB. We explored the influence of different reference standards. We performed the majority of analyses using a bivariate random-effects model against culture-based DST as the reference standard. Main results
We included 21 unique studies: 14 studies reported the accuracy of MTBDRslwhen done directly, five studies when done indirectly and two studies that did both. Of the 21 studies, 15 studies (71%) were cross-sectional and 11 studies (58%) were located in low-income or middle-low-income countries. All studies but two were written in English. Nine (43%) of the 21 included studies had a high risk of bias for patient selection. At least half of the studies had low risk of bias for the other QUADAS-2 domains.
As a test for FQ resistance measured against culture-based DST, the pooled sensitivity of MTBDRslwhen performed indirectly was 83.1% (95% confidence interval (CI) 78.7% to 86.7%) and the pooled specificity was 97.7% (95% CI 94.3% to 99.1%), respectively (16 studies, 1766 participants; 610 confirmed cases of FQ-resistant TB;moderate quality evidence). When performed directly, the pooled sensitivity was 85.1% (95% CI 71.9% to 92.7%) and the pooled specificity was 98.2% (95% CI 96.8% to 99.0%), respectively (seven studies, 1033 participants; 230 confirmed cases of FQ-resistant TB;moderate quality evidence). For indirect testing for FQ resistance, four (0.2%) of 1766 MTBDRslresults were indeterminate, whereas for direct testing 20 (1.9%) of 1033 were MTBDRslindeterminate (P < 0.001).
As a test for SLID resistance measured against culture-based DST, the pooled sensitivity of MTBDRslwhen performed indirectly was 76.9% (95% CI 61.1% to 87.6%) and the pooled specificity was 99.5% (95% CI 97.1% to 99.9%), respectively (14 studies, 1637 participants; 414 confirmed cases of SLID-resistant TB;moderate quality evidence). For amikacin resistance, the pooled sensitivity and specificity were 87.9% (95% CI 82.1% to 92.0%) and 99.5% (95% CI 97.5% to 99.9%), respectively. For kanamycin resistance, the pooled sensitivity and specificity were 66.9% (95% CI 44.1% to 83.8%) and 98.6% (95% CI 96.1% to 99.5%), respectively. For capreomycin resistance, the pooled sensitivity and specificity were 79.5% (95% CI 58.3% to 91.4%) and 95.8% (95% CI 93.4% to 97.3%), respectively. When performed directly, the pooled sensitivity for SLID resistance was 94.4% (95% CI 25.2% to 99.9%) and the pooled specificity was 98.2% (95% CI 88.9% to 99.7%), respectively (six studies, 947 participants; 207 confirmed cases of SLID-resistant TB, 740 SLID susceptible cases of TB;very low quality evidence). For indirect testing for SLID resistance, three (0.4%) of 774 MTBDRslresults were indeterminate, whereas for direct testing 53 (6.1%) of 873 were MTBDRslindeterminate (P < 0.001). As a test for XDR-TB measured against culture-based DST, the pooled sensitivity of MTBDRslwhen performed indirectly was 70.9% (95% CI 42.9% to 88.8%) and the pooled specificity was 98.8% (95% CI 96.1% to 99.6%), respectively (eight studies, 880 participants; 173 confirmed cases of XDR-TB;low quality evidence).
Authors’ conclusions
In adults with TB, a positive MTBDRslresult for FQ resistance, SLID resistance, or XDR-TB can be treated with confidence. However, MTBDRsldoes not detect approximately one in five cases of FQ-resistant TB, and does not detect approximately one in four cases of SLID-resistant TB. Of the three SLIDs, MTBDRslhas the poorest sensitivity for kanamycin resistance. MTBDRslwill miss between one in four and one in three cases of XDR-TB. The diagnostic accuracy of MTBDRslis similar when done using either culture isolates or smear-positive sputum. As the location of the resistance causing mutations can vary on a strain-by-strain basis, further research is required on test accuracy in different settings and, if genetic sequencing is used as a reference standard, it should examine all resistance-determining regions. Given the confidence one can have in a positive result, and the ability of the test to provide results within a matter
of days, MTBDRslmay be used as an initial test for second-line drug resistance. However, when the test reports a negative result, clinicians may still wish to carry out conventional testing.
P L A I N L A N G U A G E S U M M A R Y
The rapid test GenoType®MTBDRslfor testing resistance to second-line TB drugs
Background
Different drugs are available to treat people with tuberculosis (TB), but resistance to these drugs is a growing problem. People with drug-resistant TB are more likely to die than people with drug-susceptible TB. People with drug-resistant TB require “second-line” TB drugs that, compared with “first-line” TB drugs used to treat drug-susceptible TB, cause more side effects and must be taken for longer. Extensively drug-resistant TB (XDR-TB) is a type of TB that is resistant to almost all TB drugs. A rapid and accurate test could identify people with drug-resistant TB, likely improve patient care, and reduce the spread of drug-resistant TB.
Test evaluated by this review
GenoType®MTBDRsl(MTBDRsl) is the only rapid test that detects resistance to line fluoroquinolone drugs and the
second-line injectable drugs. The test also detects XDR-TB. MTBDRslcan be performed on TB bacteria grown by culture from sputum, which takes a long time (indirect testing), or immediately on sputum (direct testing).
Main results
We examined evidence available up to 30 January 2014 and included 21 studies, 11 of which were in low-income or middle-income countries.
What do these results mean?
Fluoroquinolone drugs
By indirect testing, the test detected 83% of people with fluoroquinolone resistance and rarely gave a positive result for people without resistance. In a population of 1000 people, where 170 have fluoroquinolone resistance, MTBDRslwill correctly identify 141 people with fluoroquinolone resistance and miss 29 people. In this same population of 1000 people, where 830 people do not have fluoroquinolone resistance, the test will correctly classify 811 people as not having fluoroquinolone resistance and misclassify 19 people as having resistance (moderate quality evidence).
By direct testing, the test detected 85% of people with fluoroquinolone resistance and rarely gave a positive result for people without resistance (moderate quality evidence).
Second-line injectable drugs
By indirect testing, the test detected 77% of people with second-line injectable drug resistance and rarely gave a positive result for people without resistance. In a population of 1000 people, where 230 have second-line injectable drug resistance, MTBDRslwill correctly identify 177 people with second-line injectable drug resistance and miss 53 people. In this same population of 1000 people, where 770 do not have second-line injectable drug resistance, the test will correctly classify 766 people as not having second-line injectable drug resistance and misclassify four people as having resistance (moderate quality evidence).
By direct testing, the test detected 94% of people with second-line injectable drug resistance and rarely gave a positive result for people without resistance (very low quality evidence).
XDR-TB
By indirect testing, the test detected 71% of people with XDR-TB and rarely gave a positive result for people without XDR-TB. In a population of 1000 people, where 80 have XDR-TB, MTBDRslwill correctly identify 57 people with XDR-TB and miss 23 people. In this same population of 1000 people, where 920 do not have TB, the test will correctly classify 909 people as not having XDR-TB and misclassify 11 people as having XDR-XDR-TB (low quality evidence).
There was insufficient evidence to determine the accuracy of MTBDRslby direct testing for XDR-TB. Conclusions
The results show that a positive MTBDRslresult for resistance to the fluoroquinolone drugs or the second-line injectable drugs is reliable evidence that the person has drug-resistant TB and further conventional drug-resistance testing is not required. However, when the test reports a negative result, clinicians may still wish to carry out conventional testing.
B A C K G R O U N D
Tuberculosis (TB) is an infectious airborne disease caused by My-cobacterium tuberculosisbacteria and is the second most common cause of death from an infectious disease in adults (HIV/AIDS being first). TB predominantly affects the lungs (pulmonary TB) but can affect other parts of the body, such as the brain or the spine. Active TB disease is confirmed by the presence of viable TB bacilli. The symptoms of pulmonary TB include a persistent cough (for at least two weeks), fever, night sweats, weight loss, chills, haemoptysis and fatigue. In 2012, an estimated 8.6 mil-lion people developed TB and 1.3 milmil-lion people died from TB (WHO 2013a). TB that is drug sensitive (also referred to as drug-susceptible TB) is the most common type of TB and may be ef-fectively treated with a standardized regimen of first-line anti-TB drugs (WHO 2013a). However, TB bacilli may become drug re-sistant, meaning that first-line anti-TB drugs can no longer kill the bacilli. Drug resistance usually develops because of inappropriate or incorrect use of first-line drugs but new cases are increasingly caused by person-to-person transmission (Streicher 2011;Zhao 2012).
The emergence of drug-resistant TB (DR-TB) threatens to desta-bilise global TB control. In 2012, approximately 4% of new TB cases were multidrug resistant (WHO 2013a). Therapy for DR-TB requires treatment for more than 12 months and is toxic and expensive. In South Africa in 2011, the treatment of approximately 8000 cases of DR-TB, which comprised only 2.2% of the total TB burden, consumed 32% of the country’s annual national TB bud-get of US$218 million (Pooran 2013). Fifty percent to 75% of pa-tients experience unfavourable outcomes, such as death, treatment failure, or adverse drug reactions (Dheda 2010a;Dheda 2010b). There are two standardized definitions of DR-TB: multidrug-re-sistant TB (MDR-TB) and extensively drug-remultidrug-re-sistant TB (XDR-TB). MDR-TB is caused byM. tuberculosiswhich, when tested microbiologically in the laboratory, is resistant to rifampicin and isoniazid. These drugs are two of the most effective and widely-used anti-TB drugs that form part of the standardized first-line reg-imen for drug-susceptible TB. Patients with MDR-TB are com-monly treated with drugs belonging to the fluoroquinolone (FQ) and second-line injectable anti-TB drug (SLID) classes. The FQ drugs include ofloxacin and moxifloxacin and the SLIDs include amikacin and kanamycin (two aminoglycoside drugs) and capre-omycin (a cyclic peptide drug). XDR-TB is caused byM.
tuber-culosisresistant to isoniazid, rifampicin, plus any FQ and at least one of the three SLIDs (amikacin, kanamycin or capreomycin). Hence, patients with XDR-TB are resistant to both first-line and second-line drugs.
In South Africa, 80% of MDR-TB is thought to be spread via per-son-to-person transmission (Streicher 2011) and the same is likely true of MDR-TB and XDR-TB in China (Zhao 2012). Modelling studies (Basu 2007;Basu 2009;Dowdy 2008) have shown that, through the expansion of capacity to rapidly diagnose DR-TB, patient cure rates will be improved through the earlier initiation of appropriate and effective TB treatment. Importantly, once a patient is placed on effective treatment, their infectiousness dra-matically declines within one to two weeks (Menzies 1997). How-ever, the exact “infectiousness period” for DR-TB remains unclear. Early treatment initiation may therefore help curtail the spread of DR-TB through the disruption of person-to-person transmission. Thus, there is an urgent need for rapid tests that allow the early detection of drug resistance and the selection of appropriate TB drugs.
Conventional tests for detecting TB drug resistance, referred to as drug susceptibility testing (DST), are traditionally ’phenotypic’, in that bacteria in biological fluid from the patient (usually spu-tum) is inoculated into a culture medium containing the drug of interest and the presence (indicating resistance) or absence (indi-cating susceptibility) ofM. tuberculosisgrowth is detected (Heysell 2012). Such testing is commonly performed indirectly, in that the pure bacterial culture or isolate grown from the original pa-tient specimen is re-inoculated into drug-containing media. As the growth ofM. tuberculosistypically takes between two to six weeks for the initial culture, there is often a significant time delay (two to six months) associated with the diagnosis of DR-TB, especially if re-inoculation is required. These delays are often further exacer-bated by the technical and infrastructure requirements of testing, a lack of standardised methodologies for certain drugs (which cause unclear results that require repeating) (Richter 2009), as well as patient-associated difficulties, such as loss to follow-up. Recently, new tests for drug resistance such as the Genotype®MTBDRsltest
(henceforth called MTBDRsl) that are rapid (potentially offering a turn-around time of one to two days) and ’genotypic’ (as they detect the presence of specific mutations known to be associated with drug resistance) have offered considerable promise for the diagnosis of DR-TB.
One of the challenges in this Cochrane Review is the choice of the reference standard used to determine the presence or absence of the target conditions (described below). Phenotypic culture-based DST is the most widely used reference standard for drug resis-tance and is recommended by the WHO (WHO 2007). However, phenotypic culture-based DST is acknowledged to be imperfect and the results are dependent on the concentration of drug used. Genetic sequencing is widely considered to be the best reference standard for testing for the presence of drug resistance; but due to the technical aspects, costs and time associated with this method, it is rarely feasible to perform it on all samples suspected of DR-TB or in all regions of the TB genome that might be associated with resistance. Furthermore, not all genetic determinants or mecha-nisms of resistance may be known for a particular drug. We discuss the strengths and limitations of the different reference standards further below.
Target condition being diagnosed
We considered the following three target conditions: resistance of M. tuberculosisto FQs; resistance ofM. tuberculosisto SLIDs; and XDR-TB.
Index test(s)
The GenoType® MTBDRsl assay (MTBDRsl, Hain Life Sci-ences) detects mutations in thegyrAgene (encoding the A-sub-unit of DNA gyrase),therrsgene (encoding the 16S rRNA com-plex) and theembBgene (which, together with the genesembA andembC, codes for arabinosyltransferase) of the TB-causingM. tuberculosiscomplex species (which includesM. tuberculosis,M. africanum,M. bovissubsp. bovis,M. bovissubsp. caprae,M. bovis subsp. BCG,M. microti,M. canettiandM. pinnipedii) (Hain Life Sciences 2012a). The presence of mutations in these genes is associated with resistance to the FQs (including ofloxacin and levofloxacin), SLIDs (including kanamycin, amikacin and capre-omycin) and ethambutol, respectively. Since ethambutol is a first-line TB drug, we did not determine the accuracy of MTBDRsl assay for ethambutol resistance in this review.
The assay can be performed either on a patient specimen (direct testing) or on a culture grown from the patient specimen (indirect testing). The type of testing, direct or indirect, is dependent on the quantity of TB in the patient specimen. The manufacturer recommends that the assay is performed directly on the specimen if the specimen contains bacilli that can be seen using a light microscope and an acid-fast stain (smear-positive) (Figure 1).
Figure 1. Clinical pathway diagram showing how molecular drug susceptibility testing (DST), which may use the MTBDRsl assay, is applied. A patient with suspected TB or suspected drug-resistant TB supplies a biological specimen (usually sputum), which is examined by smear microscopy and cultured. If acid-fast bacilli
are observed under the microscope (smear-positive), a molecular DST can be performed directly on the specimen. If acid-fast bacilli are not observed (smear-negative), molecular DST can only be performed with
acceptable accuracy on the culture isolate grown from the specimen. A molecular test for first-line drug resistance (for example, the MTBDRplus assay) is performed first and, only if resistance to the first-line drugs
is indicated, the specimen is tested further for resistance to the second-line drugs using the MTBDRsl assay. Where molecular testing is not available, phenotypic testing for drug resistance may be performed on
culture-positive isolates. Although phenotypic testing is being replaced by molecular-based methods in some settings, it is still usually performed in research studies seeking to measure the accuracy of the molecular test. Furthermore, some research studies also use gene sequencing as a reference standard or any specimens with
discordant molecular DST-culture results.
The assay procedure is comprised of three sequential steps when using direct decontaminated patient material (decontaminated us-ing the standard N-acetyl-cysteine and sodium hydroxide (NALC/ NaOH) method), culture isolates in liquid media or when pick-ing colonies from solid media. These steps are: (1) mycobacterial genomic DNA is extracted from the patient specimen or culture isolate; (2) regions within thegyrA, rrsandembBgenes are se-lectively amplified using a multiplex polymerase chain reaction (PCR) assay; and (3) the amplification products are detected on a
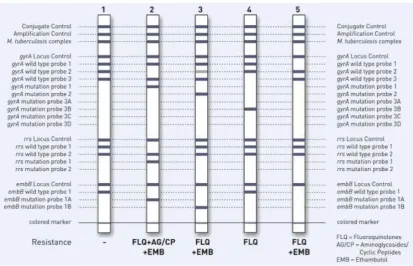
nitrocellulose membrane strip by reverse hybridisation and visu-alised using a streptavidin-conjugated alkaline phosphatase colour reaction. The observed bands, each corresponding to a specific probe, can be used to determine the drug susceptibility profile of the analysed specimen (an example is shown inFigure 2). The extraction can also be done indirectly on blood cultures, where a Middlebrook slant is inoculated prior to picking the colonies from the agar after incubation for a period of time.
Figure 2. Examples of different GenoType® MTBDRsl strip readouts (Hain Life Sciences 2012b).
A template is supplied by the manufacturer to help read the strips Appendix 1where the banding patterns are scored by eye, tran-scribed and manually fed into the Laboratory Information System (LIS). In high-volume settings, the GenoScan®, an automated reader, can be incorporated to interpret the banding patterns auto-matically and give a suggested interpretation (an example output of the machine is shown inAppendix 2. If the operator agrees with the interpretation, the results are automatically downloaded into the LIS, thus eliminating possible transcription errors. It is impor-tant to note that the automated reader only provides a suggested result and requires manual confirmation of the result after the op-erator has visually inspected the banding pattern. Nonetheless, the test manual provides fairly straightforward instruction with little room for variation in interpretation, even human interpretation. The entire assay procedure can be completed in five hours. The assay can also be performed on DNA from pure isolates taken from cultured patient specimens. Once a diagnosis of MDR-TB has been established, the MTBDRslcan also be used to confirm a diagnosis of XDR-TB.
Figure 2shows an example of different MTBDRslresults. The as-say consists of two internal controls (a conjugate control for con-firmation of the colorimetric reaction used to visualise bands and an amplification control to ensure that nucleic acid amplification reaction has occurred) plus a control for each gene locus (gyrA, rrs,embB). The two internal controls plus the locus control for
the gene of interest should always be positive; otherwise the assay cannot be evaluated for that particular drug. Of note is that a result can be indeterminate for one gene but valid for another (on the basis of only the gene-specific locus control failing). A band for the detection of theM. tuberculosiscomplex (the “TUB” band) is included. Should the wild-type or mutant probes appear whilst the locus control for a specific gene is less intense than that of the amplification control band (AC band) and the TUB band is interpretable, the locus probes should be considered secondary to that of the other probes for the gene in question and can thus be considered for interpretation.
An earlier version of the MTBDRslmanual (version 1) stated that if the locus band was absent but other non-control bands were present (even together with their accompanying gene locus control bands) the assay should be considered non-evaluable (Hain Life Sciences 2012a). However, the most recent version of the manual (version 2;Hain Life Sciences 2012b) states: “in rare cases the TUB zone may be negative while an evaluable resistance pattern is developed. If so, the presence of a strain belonging to the MTB complex must be suspected and the assay should be repeated”. Upon inspection, most of these are nontuberculous mycobacteria and thus if the TUB band is not present, it is suggested to use the GenoType® CM/AS kit for the identification of other common mycobacteria, or additional species should the GenoType® CM/
AS kit fail to produce a positive identification for any of the 17 species covered by the GenoType® CM/AS kit (Hain Life Sciences 2012b).
Clinical pathway
Figure 1illustrates the clinical pathway. Depending on the setting, DST is either performed on all patients with confirmed TB or only on patients who are clinically suspected of having DR-TB (for example, if the patient’s symptoms have failed to improved on first-line therapy, or if they still have viable bacilli in their sputum after an extended period of treatment. As mentioned above, the manufacturer recommends that if the patient specimen (usually sputum) is smear-positive the assay be performed directly on the specimen (direct testing). If smear-negative, it is recommended that the assay be performed on the culture isolate grown from the patient specimen (indirect testing). DST for resistance to the sec-ond-line drugs is only performed if resistance to the first-line drugs is confirmed. Where routine molecular (genotypic) testing is well established, phenotypic DST is not usually performed. However, we expected research studies evaluating the accuracy of molecu-lar DSTs, such as the MTBDRslassay, to almost always include phenotypic DST as a reference standard. Furthermore, we also expected some studies to use genetic sequencing to resolve any discordant index test-reference standard results.
Prior test(s)
As detailed inFigure 1, patients who received MTBDRsltesting will first have received (i) smear microscopy, (ii) liquid culture (if smear-negative), and (iii) phenotypic or genotypic DST for resistance to first-line drugs.
Role of index test(s)
MTBDRslwould be used as an initial test replacing phenotypic culture-based DST as the initial test.
Rationale
Second-line TB drugs are used to treat patients with TB that is resistant to the most effective and widely used first-line drugs. To ensure that the most appropriate and least toxic drugs are provided to patients as quickly as possible, it is critical to know whether a patient has resistance to FQs alone, resistance to SLIDs alone, or resistance to both FQs and SLIDs (XDR-TB) as this will guide the selection of drugs. In addition, the presence of XDR-TB has major prognostic implications for the patient and for infection control. The conventional method for the diagnosis of drug re-sistance (phenotypic culture-based testing) is vulnerable to con-tamination and the culture can lose viability, meaning it cannot be tested. This method is also slow and can take several months. The resulting diagnostic delay results in unnecessary morbidity, mortality and increased transmission, which is a major driver of
new TB cases. There is a need for rapid assays to improve time-to-diagnosis and new molecular assays, such as the MTBDRslassay, present a promising potential solution.
O B J E C T I V E S
• To assess and compare the diagnostic accuracy of MTBDRslfor the detection of resistance to FQs in patient specimens (using direct testing) and culture isolates (using indirect testing) confirmed as TB positive.
• To assess and compare the diagnostic accuracy of MTBDRslfor the detection of resistance to SLIDs in patient specimens (using direct testing) and culture isolates (using indirect testing) confirmed as TB positive.
• To assess and compare the diagnostic accuracy of MTBDRslfor the detection of XDR-TB in patient specimens (using direct testing) and culture isolates (using indirect testing) confirmed as TB positive.
Secondary objectives
We planned to investigate heterogeneity in relation to the refer-ence standard (culture-based DST compared with (1) genetic se-quencing, (2) culture-based DST and genetic sese-quencing, and (3) culture-based DST followed by genetic sequencing with discor-dant results) and individual drugs within a drug class (for exam-ple, ofloxacin and moxifloxacin within the FQ class). We also pre-specified in the protocol investigations of heterogeneity in relation to HIV status, condition of the specimens (fresh or frozen, vol-ume of specimen), patient population (patients suspected of hav-ing MDR-TB or XDR-TB) and whether WHO-recommended critical drug concentrations were used for culture-based reference testing.
M E T H O D S
Criteria for considering studies for this review
Types of studies
We included all studies that determined the diagnostic accuracy of the index test in comparison with a defined reference standard, including case-control designs, in which cases and controls were sampled from the same patient population. We only included stud-ies from which data could be extracted for true positives (TP), true
negatives (TN), false positives (FP) and false negatives (FN). We excluded unpublished studies reported only in abstracts.
Participants
We included patients and specimens from patients of any age who were thought to have resistance to any of the second-line TB drugs, as well as patients and patient specimens with confirmed MDR-TB from all settings, irrespective of background burden and patient population.
Index tests
We included studies that evaluated the MTBDRslassay.
Target conditions
We considered three target conditions:
1. Resistance to any of the FQs. The FQs include ofloxacin, levofloxacin and moxifloxacin. We excluded ciprofloxacin because this drug is infrequently used in DST.
2. Resistance to any of the SLIDs. The SLIDs include two aminoglycosides, kanamycin and amikacin, and one cyclic peptide, capreomycin.
3. XDR-TB.
For the FQs, the presence of mutations in each of the genes probed by the MTBDRslassay has very high concordance with resistance to all drugs within that drug class. For example, a mutation in thegyrAusually means a strain is resistant to each of the FQs: ofloxacin, levofloxacin and moxifloxacin (Sirgel 2012a). The same holds true for therrsgene and the two aminoglycosides, kanamycin and amikacin (Sirgel 2012b). Evidence is mixed regarding the level of concordance between resistance to the two aminoglycosides and capreomycin arising from mutations in therrsgene. We acknowl-edge that determining resistance to all three SLIDs together, and thus including capreomycin with the aminoglycosides, may be a limitation. However, the index test results are reported in this manner. We discuss this issue further in theDiscussion.
Reference standards
The following reference standards were used to define the target conditions:
1. Phenotypic culture-based DST: solid culture or a commercial liquid culture system (BACTEC 460, MGIT 960 and MGIT Manual System, Becton Dickinson, USA) incorporating the drug of interest.
2. Genetic sequencing of thegyrAorrrsgenes, or both. 3. Two reference standards used together: phenotypic culture-based DST and genetic sequencing of the same samples. If a specimen was resistant according to phenotypic culture-based DST or had a mutation in thegyrAorrrsgenes, the specimen was classified as having the target condition. If both phenotypic
culture-based DST and genetic sequencing indicated
susceptibility, the specimen was classified as not having the target condition.
4. Two reference standards used sequentially: phenotypic culture-based DST followed by selective testing by genetic sequencing of samples with discordant results (also referred to as discrepant analysis). Discordant results may be either index test positive/phenotypic culture-based DST negative or index test negative/phenotypic culture-based DST positive.
There are strengths and limitations to each of the reference stan-dards. As mentioned, phenotypic culture-based DST is the con-ventional reference standard, but it is considered to be imperfect and is dependent on the drug concentration threshold used to de-fine resistance. Genetic sequencing is considered to be more ac-curate than phenotypic culture-based DST; however, this is only if it targets all known resistance determining regions, which are not completely defined for the FQs and the SLIDs. Therefore, genetic sequencing can miss mutations that may cause drug resis-tance which fall outside of the targeted genes. Furthermore, ge-netic sequencing is usually applied only to culture isolates when results for the index test and the culture-based reference test do not agree. In this latter situation, there is potential for verification bias because the same reference standard is not being used to verify all index test results.
We carried out separate analyses for the different reference stan-dards, described below. In our primary analysis we used culture-based DST as the reference standard. We expected all or nearly all included studies to report results using this reference standard.
Search methods for identification of studies
We attempted to identify all relevant studies regardless of language and publication status (published, unpublished, in press and on-going). We searched for unpublished data as a means of ensuring the sensitivity of the search for published literature. Unpublished data in this field may provide misleading results as the data set is incomplete. While unpublished sources were searched, we did not include unpublished data in the review. We did not apply date restrictions to the searches.
Electronic searches
Vittoria Lutje (VL), the Information Specialist for the Cochrane Infectious Diseases Group, performed literature searching up to 30 January 2014. To identify all relevant studies, she searched the following databases using the search terms and strategy described inAppendix 3: Cochrane Infectious Diseases Group Specialized Register; MEDLINE (Pubmed, 1966 to January 2014); EMBASE OVID (1980 to January 2014); ISI Web of Knowledge (Science Citation Index - Expanded (1900 to present), Conference Pro-ceedings Citation Index- Science (CPCI-S) (1990 to present) and BIOSIS Previews (1926 to January 2014)); MEDION (http://
www.mediondatabase.nl/); LILACS (http://lilacs.bvsalud.org/en/ ; 1982 to January 2014); and SCOPUS (1995 to January 2014). VL also searched the metaRegister of Controlled Trials (mRCT; http://www.controlled-trials.com/) and the search portal of the World Health Organization (WHO) International Clinical Trials Registry Platform (www.who.int/trialsearch), to identify ongoing trials, and ProQuest Dissertations & Theses A&I to identify rele-vant dissertations.
Searching other resources
We reviewed reference lists of included articles and any relevant re-view articles identified through the above methods. We contacted the assay manufacturer (Hain Life Sciences) to identify unpub-lished studies. We contacted researchers at the Foundation for In-novative New Diagnostics (FIND), members of the StopTB Part-nership’s New Diagnostics Working Group and other experts in the field of TB diagnostics for information on ongoing or unpub-lished studies.
Data collection and analysis
Selection of studies
Two review authors (GT and JP) independently scrutinized titles and abstracts identified by electronic literature searching to iden-tify potentially eligible studies. We selected all citations identified as suitable during this screen for full-text review. The same two review authors then independently reviewed full-text papers for study eligibility using the predefined inclusion and exclusion cri-teria. For full text articles, we resolved any discrepancies by dis-cussion with a third review author (KRS). We maintained a list of excluded studies and their reasons for exclusion.
Data extraction and management
Two review authors (GT and JP) independently extracted a set of data from each study using a piloted data extraction form. We resolved any discrepancies by discussion. Based on the pilot, we fi-nalized the data extraction form. We then independently extracted data on the following characteristics:
• Details of study: first author; publication year; country where testing was performed; setting (primary care laboratory, hospital laboratory, reference laboratory); study design; manner of participant selection; number of participants enrolled; number of participants for whom results available; industry sponsorship.
• Characteristics of participants: age (mean, SD; median, interquartile range; age range); HIV status; smear status; history of TB; known MDR-TB, pre-XDR-TB or XDR-TB status.
• Target conditions: resistance to FQs; resistance to SLIDs; XDR-TB.
• Reference standards: name and manufacturer; type; percentage of patients whose reference standard was
’uninterpretable’ (for example, contaminated, sequencing failed). • Details of specimen: type (such as expectorated sputum, induced sputum or culture isolate); condition (fresh or frozen); definition of a positive smear; type of testing (direct testing or indirect testing).
• Details of outcomes: the number of TP, TN, FP and FN results; number of indeterminate assay results.
• Time to treatment initiation: defined as the time from specimen collection until patient starts treatment.
• Time to diagnosis: defined as the time from specimen collection until there is an available TB result in lab or clinic, if the assay was performed in a clinic.
We assigned country income status (high-income or low- and mid-dle-income) as classified by the World Bank List of Economies (World Bank 2014). We contacted authors of primary studies for missing data or clarifications. We entered all data into a database manager (Microsoft Excel 2012).
For one study that tested the same panel of TB isolates in multiple centres, we selected one centre that provided results in the middle range (neither the best nor the worst results).
Whenever possible, we extracted data that used a single patient as the unit of analysis (one MTBDRslresult per one specimen from one patient).
When culture-based DST was performed using more than one drug from the FQs (ofloxacin, moxifloxacin or levofloxacin) or SLIDs (amikacin, kanamycin or capreomycin), we extracted data (TP, TN, FP, FN) for each drug and for each class overall. We also extracted data for the SLIDs as a class overall if culture-based DST was performed using only one drug.
No studies reported on the number of ’no TB’ or ’no result’ results obtained from MTBDRsl,therefore we only reported the propor-tion of ’indeterminate’ results.
In the 2 x 2 tables of TP, FP, FN and TN, we based the results of the index test on categorical assay results defined by the visual readout of the MTBDRslstrip.
Possible results for the Genotype® MTBDRslassay (as defined by the product manual)
1. Sensitive to either FQs or SLIDs (referred to as ’aminoglycosides/cyclic peptides’), or both (conjugation and amplification bands present; TUB band present; gene locus band present; all wild type (wt) bands for each gene present; no mutation bands present). In the case of susceptibility to both drug classes, the test would indicate susceptibility for each, rather than having a single composite readout specifying XDR-TB.
2. Resistant to either FQs or SLIDs, or both (conjugation and amplification bands present; TUB band present; gene locus band present; all, none or somewtbands for each gene present; all, none or some mutation bands present with similar intensity to
amplification control). In the case of resistance to both drug classes, the test would indicate resistance for each, rather than having a composite readout.
3. Indeterminate (faint bands) or no result (no conjugation or amplification bands present, no locus band present for the gene of interest).
4. No TB (negative for MTB complex irrespective of locus control band).
5. No result (failure of any one of the control bands, as well as the TUB band).
Assignment of results to the fluoroquinolones, second-line injectable drugs or both categories
MTBDRsldetects the presence of mutations in genes that cause drug resistance for drug classes (ie FQs, SLIDs or both), not to individual drugs within these classes (ofloxacin, moxifloxacin and levofloxacin in the case of the FQs; amikacin, kanamycin and capreomycin in the case of SLIDs). Thus, one study might use phenotypic DST for detection of kanamycin resistance and an-other study might use phenotypic DST for detection of amikacin resistance as reference standards to confirm SLID resistance. In such a scenario, if the phenotypic DST was positive for resistance and the MTBDRslresult was concordant, we classified the index case result as true-positive. We adopted the same approach for the FQs. Similarly, if the index tests reported resistance to a SLID and, in the case of genetic sequencing being used as a reference standard, the presence of mutations known to be associated with drug resistance to the SLIDs was confirmed, we recorded this as a concordant result positive for resistance to SLIDs. A similar ap-proach was used for the FQs that used genetic sequencing as a reference standard.
Assessment of methodological quality
We appraised the quality of the included studies with the Qual-ity Assessment of Diagnostic Accuracy Studies (QUADAS-2) tool (Whiting 2011;Appendix 4). QUADAS-2 consists of four do-mains: patient selection, index test, reference standard, and flow and timing. We assessed all domains for the potential for risk of bias and the first three domains for concerns regarding applica-bility. We used signalling questions in each domain to form judg-ments about the risk of bias. One review author (GT) piloted the tool with two included studies and finalized the tool based on ex-perience gained from the pilot testing. Two review authors then independently assessed methodological quality of included studies with the finalized tool.
Statistical analysis and data synthesis
We performed descriptive analysis for key variables (such as coun-try income status and number of study participants)of the primary
studies using Stata version 12.0 and displayed key study charac-teristics inCharacteristics of included studies.
We used the reference standard ’culture’ in our primary analyses. We stratified these analyses first by target condition (FQ resistance, SLID resistance or XDR-TB) and second by type of MTBDRsl testing (indirect testing or direct testing). Within each stratum (for example, FQ resistance by indirect testing), we plotted estimates of the studies’ observed sensitivities and specificities in forest plots with 95% confidence intervals (CI) and in receiver-operating char-acteristic (ROC) space usingReview Manager (RevMan). Where adequate data were available, we combined data using meta-anal-ysis. We performed the majority of meta-analyses by fitting the bivariate random-effects model (Macaskill 2010;Reitsma 2005) using Stata version 11 with the metandi and xtmelogit commands. We compared models with separate and identical variance terms using likelihood ratio tests to determine the best fitting model. In situations in which there were fewer than four studies, we deter-mined summary estimates of sensitivity and specificity by simpli-fying the bivariate model to two univariate random-effects logis-tic regression models. When it was not possible to fit the model and we observed little heterogeneity, we determined summary es-timates of sensitivity and specificity separately using a fixed-effect model (Zamora 2006). We presented meta-analysis summaries in tables and ROC space.
We compared results from studies of direct testing with results from studies of indirect testing by adding a covariate for the type of testing to the model. We assessed the significance of the difference in test accuracy between studies using direct testing and studies using indirect testing by a likelihood ratio test comparing models with and without covariate terms. For these comparative analyses, we first included all studies with relevant data and then included only those studies that made direct comparisons between direct and indirect testing with the same participants, where such studies existed. We present the results according to the stated objectives, under the appropriate subheadings in theResultssection for each condition: Estimates of the diagnostic accuracy of MTBDRsl us-ing phenotypic culture-based DST as a reference standard, and Investigations of heterogeneity for each testing method.
Approach to uninterpretable (indeterminate) MTBDRsl results
We excluded indeterminate test results from the analyses for de-termination of sensitivity and specificity. We determined the pro-portion of indeterminate MTBDRslresults among the primary studies for each target condition and provided results separately for indirect and direct testing.
Investigations of heterogeneity
Within each stratum (for example SLID resistance), we investi-gated heterogeneity through visual examination of forest plots of
sensitivity and specificity. Then, if sufficient studies were avail-able, we explored the possible influence of the following pre-spec-ified categorical covariates: reference standard (culture, genetic se-quencing, culture and genetic sese-quencing, culture followed by ge-netic sequencing) and individual drug (amikacin, kanamycin and capreomycin). We determined variation in sensitivity and speci-ficity by adding covariate terms to the meta-analysis models de-scribed above. The significance of the difference in test accuracy (for example, between studies using culture versus those using ge-netic sequencing as the reference standard) was assessed by a like-lihood ratio test comparing models with and without covariate terms.
We had also planned to investigate the effect of HIV status, the condition of the specimen (fresh or frozen), sample volume, the drug concentration used for culture-based DST (WHO-recom-mended or not) and patient population (patients thought to have MDR-TB or XDR-TB) on summary estimates of sensitivity and specificity in a meta-regression analysis by adding covariate terms to the bivariate model. However, there were insufficient data for these additional analyses.
Sensitivity analyses
For our primary analysis using the culture-based DST reference standard, we performed sensitivity analyses for four QUADAS-2 signalling questions to explore whether the results we found were robust with respect to the methodological quality of the studies. We used the following questions:
• Was a consecutive or random sample of patients/specimens enrolled?
• Was a case-control design avoided?
• Were the reference standard results interpreted without knowledge of the results of the index test?
• Were the index test results interpreted without knowledge of the results of the reference standard?
We did not exclude any studies based on these answers.
Assessment of reporting bias
We did not undertake a formal assessment of publication bias of data included in this review using methods such as fun-nel plots or regression tests because such techniques have not been found to be helpful for determining publication bias within diagnostic test accuracy studies (Macaskill 2010;Tatsioni 2005).
Other analyses
We had intended to summarize two patient outcomes, time-to-diagnosis and time-to-treatment initiation; however time-to-diag-nosis was the only one described in the included studies.
R E S U L T S
Results of the search
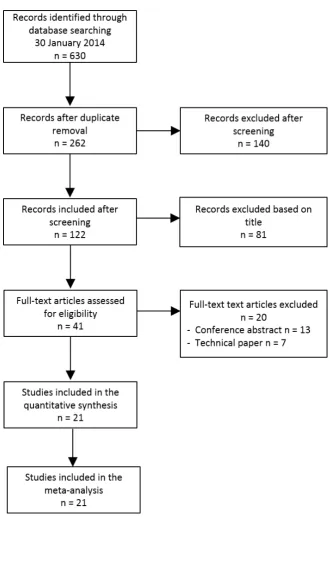
Our search identified 630 titles (Table 1;Table 2;Figure 3). We did not add any additional titles after reference review or contact with experts. After we removed duplicates, 262 titles remained of which we excluded 140 titles based on a review of title, or abstract, or both. We retrieved full text articles for 41 citations, of which we excluded 20, leaving 21 unique studies included in the review and meta-analysis (Figure 3). We have listed the reasons for exclusion of studies in theCharacteristics of excluded studiessection. One of the 21 studies (Ignatyeva 2012) evaluated a panel of isolates at four different sites in Eastern Europe and we extracted data for the one site that neither performed the best or the worst.
Figure 3. Study flow diagram.
Methodological quality of included studies
Figure 4andFigure 5show the quality assessment of the 21 in-cluded studies. In the patient selection domain, we considered 10 studies (48%) to be at low risk of bias because participants were enrolled consecutively or randomly and the study design was cross-sectional. We considered nine studies to be at high risk of bias because (1) there was a case-control design (five stud-ies:Brossier 2010;Hillemann 2009;Ignatyeva 2012;Kiet 2010; Miotto 2012); (2) enrolment was by convenience (three studies: Barnard 2012;Lacoma 2012;Lopez-Roa 2012); or (3) the study had both a case-control design and convenience sampling (one study:van Ingen 2010). We considered two studies to have un-clear risk of bias because it was unun-clear how patients were selected (Chikamatsu 2012;Fan 2011). With regard to applicability (pa-tient characteristics and setting), we judged 15 studies (71%) to include the appropriate patients and settings to address the review question and six studies to have a high concern about applicabil-ity (Brossier 2010;Hillemann 2009;Ignatyeva 2012;Kiet 2010; Miotto 2012;van Ingen 2010). In the index test domain, we con-sidered two studies at high risk of bias as the index test results were not interpreted without knowledge of the results of the ref-erence standard (Chikamatsu 2012;Kiet 2010) and seven stud-ies at unknown risk of bias because information about blinding was unavailable (Brossier 2010;Fan 2011;Ferro 2013;Hillemann 2009;Lopez-Roa 2012;Surcouf 2011;Tukvadze 2014). In all but two studies (Brossier 2010;Tukvadze 2014), the use, conduct and
interpretation of the index test was considered applicable. In the reference standard domain, we judged eleven studies (52%) to be at low risk of bias because the reference standard was appropriate and the results were interpreted without knowledge of the results of the MTBDRslassay (Ajbani 2012;Barnard 2012;Chikamatsu 2012;Hillemann 2009;Huang 2011;Ignatyeva 2012;Jin 2013; Lopez-Roa 2012 Miotto 2012;Tukvadze 2014;Zivanovic 2012. We judged applicability to be of low concern for all studies in the reference standard domain. In the flow and timing domain, we considered 16 studies (76%) to be of low concern for risk of bias because all patients were accounted for in the analysis, informa-tion about uninterpretable results was provided and all patients had the same reference tests performed. We considered five studies to have unclear risk of bias in the flow and timing domain because discrepant analysis was performed (Ajbani 2012;Barnard 2012; Kiet 2010;Lacoma 2012;Lopez-Roa 2012) meaning that not all patients received culture-based and sequencing reference testing. Also, we considered one study (Ferro 2013) to have unclear risk of bias because not all patients were accounted for in the analyses. We noted industry involvement in seven (33%) studies and this included: i) donation of MTBDRsltests (four studies:Hillemann 2009;Miotto 2012;Surcouf 2011;Ferro 2013); ii) preferred pric-ing of MTBDRsltests (one study:Barnard 2012); iii) financial support for non-test related study costs (one study:Said 2012); and iv) involvement in the design, analysis or manuscript produc-tion (one study:Ajbani 2012).
Figure 4. Risk of bias and applicability concerns graph: review authors’ judgements about each domain presented as percentages across included studies.
Figure 5. Risk of bias and applicability concerns summary: review authors’ judgements about each domain for each included study.
Findings
Of the 21 included studies, eight reported on MTBDRsltesting for resistance to FQs, SLIDs and XDR-TB, 12 reported on testing for resistance to FQs and SLIDs, and one reported on testing for resistance to FQs only. Fourteen studies reported on MTBDRsl performance when done directly on patient specimens, five stud-ies reported on MTBDRslwhen performed indirectly on isolates grown from the specimens and a further two studies contained information on both testing methods. Of the 21 studies, 11 used only phenotypic culture-based DST, seven used sequencing and culture on all specimens, three used culture followed by the se-quencing of discrepant results and one used sese-quencing alone. The median (interquartile range (IQR)) number of participants in each study was 100 (50.75, 229.5). The proportion of patients screened with resistance to a FQ, SLID, or XDR-TB (according to phenotypic culture-based testing) were 30% (95% CI 28 to 32), 32% (95% CI 30 to 34), or 15% (95% CI 13 to 17), respectively. We presented key characteristics for the 21 studies in the Characteristics of included studiessection. The majority (15 stud-ies, 71%) were of cross-sectional study design. One study (Barnard
2012) included extrapulmonary specimens that we excluded from the analysis. Eleven studies (58%) were located in low-income or middle-income countries. All studies but two (Fan 2011, written in Chinese, andChikamatsu 2012, written in Japanese) were in English.
I. Fluoroquinolone resistance detection
A. Estimates of the diagnostic accuracy of MTBDRslusing phenotypic culture-based DST as a reference standard
1. Indirect testing
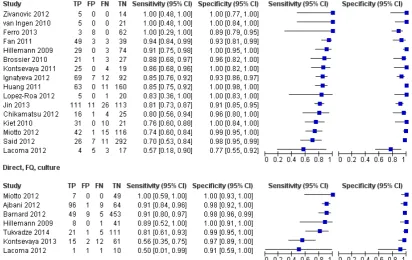
We present forest plots of MTBDRsl sensitivity and specificity when performed indirectly for the detection of FQ resistance for 16 studies (1766 participants) that used phenotypic culture-based DST as a reference standard inFigure 6. For individual studies, sensitivity estimates ranged from 57% to 100% and specificity estimates ranged from 77% to 100%. In the meta-analysis, the pooled sensitivity and specificity were 83.1% (95% CI 78.7 to 86.7) and 97.7% (95% CI 94.3 to 99.1), respectively.
Figure 6. Forest plots of MTBDRsl sensitivity and specificity when performed indirectly or directly for FQ resistance detection and using phenotypic culture-based DST as a reference standard. The individual studies are ordered by decreasing sensitivity. TP = true positive; FP = false positive; FN = false negative; TN = true
negative. Values between brackets are the 95% CIs of sensitivity and specificity. The figure shows the estimated sensitivity and specificity of the study (blue square) and its 95% CI (black horizontal line).
2. Direct testing
In Figure 6 we show forest plots of MTBDRslsensitivity and specificity when performed directly for the detection of resistance to FQs for seven studies (1033 participants) that used phenotypic culture-based DST as a reference standard. For individual studies, sensitivity estimates ranged from 50% to 100% and specificity estimates ranged from 91% to 100%. In the meta-analysis, the pooled sensitivity and specificity were 85.1% (95% CI 71.9 to 92.7) and 98.2% (95% CI 96.8 to 99.0), respectively.
3. Comparison of indirect versus direct testing
(i) Diagnostic accuracy
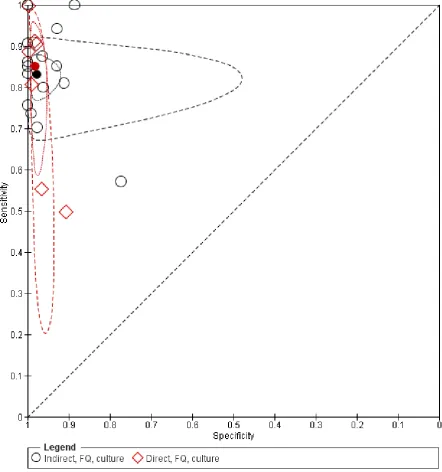
We present results comparing indirect and direct MTBDRsl test-ing for detection of FQ resistance inTable 3,Table 4andFigure 7. There was no evidence of a statistically significant difference in MTBDRslaccuracy between indirect and direct testing and using culture-based DST as a reference standard when the test was per-formed in different populations (indirect comparison, P = 0.549). Direct comparisons within the same population were not possible because no studies performed direct and indirect MTBDRsl test-ing on specimens or isolates from the same patients.
Figure 7. Summary plots of MTBDRsl sensitivity and specificity comparing detection of fluoroquinolone resistance by indirect and direct testing. The solid circles correspond to the summary estimates of sensitivity
and specificity and are shown with 95% confidence regions (dotted lines) and 95% prediction regions (dashed lines).
(ii) Indeterminate rates
For indirect testing for FQ resistance, four (0.2%) of 1766 MTBDRslresults were indeterminate (three culture DST resis-tant and one culture DST sensitive), whereas for direct testing 20 (1.9%) of 1033 were MTBDRslindeterminate (P < 0.001; 14 were culture DST-sensitive and six did not report a culture-based DST result).
B. Investigations of heterogeneity
1. Indirect testing
(i) Type of reference standard
We present MTBDRsl accuracy estimates for detection of FQ resistance against different reference standards in Table 3and Appendix 5.
Reference standard is genetic sequencing:
For individual studies (seven in total), sensitivity estimates ranged from 85% to 100% and specificity estimates ranged from 92% to 100%. In the meta-analysis, the pooled sensitivity and specificity were 99.3% (95% CI 85.9 to 100.0) and 99.7% (95% CI 92.0 to 100.0), respectively. The accuracy using this reference standard was higher than when culture-based DST was used (P < 0.001 for indirect statistical comparisons,Table 3; P < 0.001 for direct statistical comparisons,Table 4). Five studies sequenced thegyrA gene and two sequencedgyrAandgyrB.
Reference standard is culture-based DST and genetic sequencing (ie both investigations performed in all isolates):
For individual studies (seven in total), sensitivity estimates ranged from 74% to 91% and specificity estimates ranged from 99% to 100%. In the meta-analysis, the pooled sensitivity and specificity were 82.0% (95% CI 77.7 to 85.6) and 99.8% (95% CI 98.5 to 100.0), respectively. The accuracy using this reference standard was higher than when culture-based DST was used (P < 0.001 for indirect comparisons,Table 3; P < 0.001 for direct comparisons, Table 4).
Reference standard is culture-based DST followed by genetic se-quencing of discrepant index test-culture-based DST results: For individual studies (three in total), sensitivity estimates ranged from 73% to 100% and specificity estimates ranged from 94% to 100%. In the meta-analysis, the pooled sensitivity and specificity were 83.7% (95% CI 74.2 to 90.8) and 99.7% (95% CI 98.4 to 100.0), respectively. Comparisons between accuracy estimates using this reference standard and culture-based DST were not possible given the small number of studies in the former group.
(ii) Drugs used in the culture-based DST
We present MTBDRslaccuracy estimates for detection of resis-tance to ofloxacin and moxifloxacin against a phenotypic culture-based reference standard in Table 3, Table 4 andAppendix 6. For ofloxacin resistance, sensitivity estimates ranged from 70% to 100% and specificity estimates ranged from 91% to 100%. In the meta-analysis, the pooled sensitivity and specificity were 82.9% (95% CI 79.5 to 87.1) and 98.2% (95% CI 96.1 to 99.1), re-spectively. For moxifloxacin resistance, sensitivity estimates ranged from 57% to 100% and specificity estimates from 77% to 100%. In the meta-analysis, the pooled sensitivity and specificity were 91.4% (95% CI 64.7 to 98.4) and 90.6% (95% CI 79.3 to 96.1), respectively. The accuracy of MTBDRsl when performed indi-rectly was not different for ofloxacin versus moxifloxacin (indirect comparison, P = 0.091).Appendix 7presents a summary ROC plot of sensitivity versus specificity comparing test performance for detection of resistance to the individual FQ drugs.
(iii) Drug concentration used in culture-based DST
Nine studies used the WHO-recommended critical concentration of ofloxacin, whereas two did not (Jin 2013; Kiet 2010).Ferro 2013used the WHO-recommended critical concentration for low level moxifloxacin resistance whereasLacoma 2012used the con-centration recommended for high level resistance. Two studies (Fan 2011;van Ingen 2010) did not used the recommended crit-ical concentration of moxifloxacin. Comparisons between accu-racy estimates for each drug according to concentration were not possible given the small number of studies.
2. Direct testing
(i) Type of reference standard
Reference standard is genetic sequencing:
No studies performed direct MTBDRsltesting and used genetic sequencing as a reference standard.
Reference standard is culture-based DST and genetic sequencing (ie both investigations performed in all isolates):
No studies performed direct MTBDRsltesting and used both phe-notypic culture-based DST and genetic sequencing (performed in all isolates) as a reference standard.
Reference standard is culture-based DST followed by genetic se-quencing of discrepant index test-culture-based DST results: Two studies reported MTBDRslsensitivity and specificity when performed directly for the detection of resistance to FQs, with
phenotypic culture-based DST and genetic testing performed only on discrepant results as a reference standard. The reported sen-sitivities were 91% and 96% and the reported specificities were 98% and 99%.
(ii) Drugs used in the culture-based DST
Sensitivity estimates for MTBDRslfor ofloxacin resistance by di-rect testing against a phenotypic culture-based reference standard for three studies ranged from 89% to 100%. Specificity estimates from 98% to 100%. No studies performed MTBDRslby direct testing for moxifloxacin resistance.
(iii) Drug concentration used in culture-based DST
All three studies in this category used the WHO-recommended critical concentration for ofloxacin.
II. SLID resistance detection
A. Estimates of the diagnostic accuracy of MTBDRslusing phenotypic culture-based DST as a reference standard
1. Indirect testing
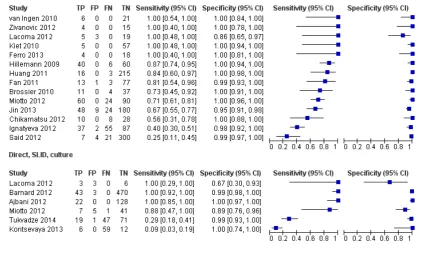
We present forest plots of MTBDRsl sensitivity and specificity when performed indirectly for the detection of resistance to SLIDs for 14 studies (1637 participants) that used phenotypic culture-based DST as a reference standard inFigure 8. For individual stud-ies, sensitivity estimates ranged from 25% to 100% and specificity estimates ranged from 86% to 100%. In the meta-analysis, the pooled sensitivity and specificity were 76.9% (95% CI 61.1 to 87.6) and 99.5% (95% CI 97.1 to 99.9), respectively.
Figure 8. Forest plots of MTBDRsl sensitivity and specificity for SLID resistance detection when performed indirectly or directly and using phenotypic culture-based DST as a reference standard. The individual studies
are ordered by decreasing sensitivity. TP = true positive; FP = false positive; FN = false negative; TN = true negative. Values between brackets are the 95% CIs of sensitivity and specificity. The figure shows the
estimated sensitivity and specificity of the study (blue square) and its 95% CI (black horizontal line)
2. Direct testing
InFigure 8we show forest plots of MTBDRslsensitivity and speci-ficity when performed directly for the detection of resistance to SLIDs for six studies (947 participants) that used phenotypic cul-ture-based DST as a reference standard. For individual studies, sensitivity estimates ranged from 9% to 100%, with one study from Eastern Europe reporting low sensitivity (Kontsevaya 2013). Specificity estimates ranged from 67% to 100%. In the meta-analysis, the pooled sensitivity and specificity were 94.4% (95% CI 25.2 to 99.9) and 98.2% (95% CI 88.9 to 99.7), respectively. When the study from Eastern Europe that reported low sensitivity (Kontsevaya 2013) was removed (Appendix 8), the pooled sen-sitivity increased to 98.0% (95% CI 39.6 to 100.0), while the pooled specificity decreased to 97.8% (95% CI 86.4 to 99.7).
3. Comparison of indirect versus direct testing
(i) Diagnostic accuracy
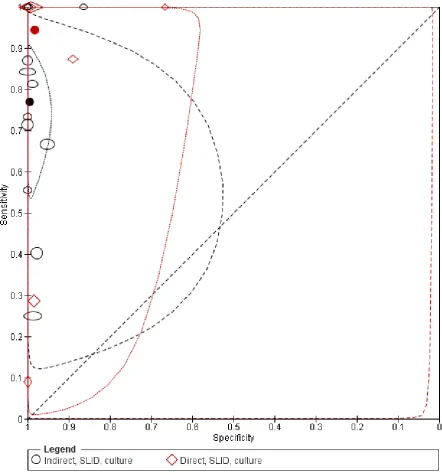
We present results comparing indirect and direct MTBDRsl test-ing for SLID resistance inTable 3, Table 4andFigure 9. The pooled sensitivity for direct testing (94.4%, 95% CI 25.2 to 99.9) was similar to the pooled estimate for indirect testing (76.9%, 95% CI 61.1 to 87.6) when the test was performed in different populations using all studies (indirect comparisons, P = 0.451). The pooled specificity was lower (indirect comparisons, P = 0.005) for direct testing (98.2%, 95% CI 88.9 to 99.7) when compared to indirect testing (99.5%, 95% CI 97.1 to 99.9) .
Figure 9. Summary plots of MTBDRsl sensitivity and specificity comparing detection of resistance for second-line injectable drugs by indirect and direct testing. The solid circles correspond to the summary estimates of sensitivity and specificity and are shown with 95% confidence regions (dotted lines) and 95%
prediction regions (dashed lines).
(ii) Indeterminate rates
For indirect testing for SLID resistance, three (0.4%) of 774 MTBDRslresults were indeterminate (one culture DST resistant and two culture DST sensitive; three studies did not report these), whereas for direct testing 53 (6.1%) of 873 were MTBDRsl inde-terminate (four were culture DST resistant, 22 were culture DST susceptible and 27 did not have a culture-based DST result; one study did not report indeterminate results) (P < 0.001).
B. Investigations of heterogeneity
1. Indirect testing
(i) Type of reference standard
We present MTBDRslaccuracy estimates for detection of SLID resistance against different reference standards in Table 3and Appendix 9.
Reference standard is genetic sequencing:
For individual studies (six in total), sensitivity estimates ranged from 62% to 100% and specificity estimates ranged from 96% to 100%. In the meta-analysis, the pooled sensitivity and specificity were 97.8% (95% CI 77.0 to 99.7) and 99.5% (95% CI 94.5 to 100.0), respectively. The accuracy using this reference standard was higher than when culture-based DST was used (P = 0.017 for indirect statistical comparisons,Table 3; P = 0.045 for direct statistical comparisons,Table 4). All six studies sequenced only therrsgene.
Reference standard is culture-based DST and genetic sequencing (ie both investigations performed in all isolates):
For individual studies (seven in total), sensitivity estimates ranged from 30% to 85% and specificity estimates ranged from 99% to 100%. In the meta-analysis, the pooled sensitivity and specificity were 56.7% (95% CI 40.8 to 71.3) and 99.9% (95% CI 99.2 to 100.0), respectively. The accuracy using this reference standard was higher than when culture-based DST was used (P = 0.008 for indirect comparisons,Table 3).
Reference standard is culture-based DST followed by genetic se-quencing of discrepant index test-culture-based DST results: For individual studies (three in total), sensitivity estimates ranged from 34% to 100% and specificity estimates ranged from 95% to 100%. We did not determine summary estimates because there were only three studies and the sensitivity was variable.
(ii) Drugs used in the culture-based DST
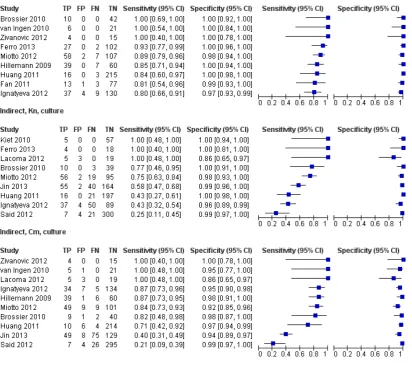
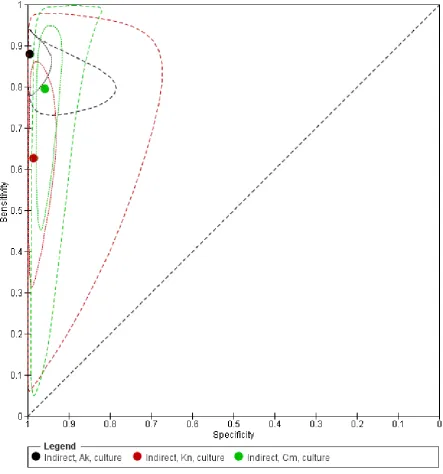
We present MTBDRslaccuracy estimates for detection of resis-tance to amikacin, kanamycin and capreomycin by indirect testing against a phenotypic culture-based reference standard inTable 3 andFigure 10. For amikacin resistance, sensitivity estimates ranged from 80% to 100% and specificity estimates ranged from 97% to 100%. In the meta-analysis, the pooled sensitivity and specificity were 87.9% (95% CI 82.1 to 92.0) and 99.5% (95% CI 97.5 to 99.9), respectively. For kanamycin resistance, sensitivity estimates ranged from 25% to 100% and specificity estimates from 86% to 100%. The pooled sensitivity and specificity were 66.9% (95% CI 44.1 to 83.8) and 98.6% (95% CI 96.1 to 99.5). For capreomycin resistance, sensitivity estimates ranged from 21% to 100% and specificity estimates from 86% to 100%. The pooled sensitivity and specificity were 79.5% (95% CI 58.3 to 91.4) and 95.8% (95% CI 93.4 to 97.3).Figure 11presents a summary ROC plot of sensitivity versus specificity comparing test performance for de-tection of resistance to the individual SLIDs by indirect testing.
Figure 10. Forest plots of MTBDRsl sensitivity and specificity when performed indirectly for the detection of resistance to amikacin (Ak), kanamycin (Kn) and capreomycin (Cm) using culture as a reference standard. The individual studies are ordered by decreasing sensitivity. TP = true positive; FP = false positive; FN = false negative; TN = true negative. Values between brackets are the 95% CIs of sensitivity and specificity. The figure shows the estimated sensitivity and specificity of the study (blue square) and its 95% CI (black horizontal line).
Figure 11. Summary plots of MTBDRsl sensitivity and specificity comparing indirect detection of resistance for amikacin (Ak), kanamycin (Kn) and capreomycin (Cm) using culture as a reference standard. The solid circles correspond to the summary estimates of sensitivity and specificity and are shown with 95% confidence
regions (dotted lines) and 95% prediction regions (dashed lines).