Open Access
Research article
Customized birth weight for gestational age standards: Perinatal
mortality patterns are consistent with separate standards for males
and females but not for blacks and whites
K S Joseph*
1, Russell Wilkins
2, Linda Dodds
1, Victoria M Allen
3,
Arne Ohlsson
4, Sylvie Marcoux
5and Robert Liston
6Address: 1Perinatal Epidemiology Research Unit, Departments of Obstetrics and Gynaecology and of Pediatrics, Dalhousie University, Halifax, Nova Scotia, Canada, 2Health Analysis and Measurement Group, Statistics Canada, Ottawa, Ontario, Canada, 3Division of Maternal-Fetal Medicine, Department of Obstetrics and Gynaecology, Dalhousie University, Halifax, Nova Scotia, Canada, 4Departments of Paediatrics and of Obstetrics and Gynecology, University of Toronto, Toronto, Ontario, Canada, 5Department of Social and Preventive Medicine, Université Laval, Sainte-Foy, Quebec, Canada and 6Department of Obstetrics and Gynecology, University of British Columbia, Vancouver, British Columbia, Canada
Email: K S Joseph* - [email protected]; Russell Wilkins - [email protected]; Linda Dodds - [email protected];
Victoria M Allen - [email protected]; Arne Ohlsson - [email protected]; Sylvie Marcoux - [email protected]; Robert Liston - [email protected]
* Corresponding author
Abstract
Background: Some currently available birth weight for gestational age standards are customized
but others are not. We carried out a study to provide empirical justification for customizing such standards by sex and for whites and blacks in the United States.
Methods: We studied all male and female singleton live births and stillbirths (22 or more weeks
of gestation; 500 g birth weight or over) in the United States in 1997 and 1998. White and black singleton live births and stillbirths were also examined. Qualitative congruence between gestational age-specific growth restriction and perinatal mortality rates was used as the criterion for identifying the preferred standard.
Results: The fetuses at risk approach showed that males had higher perinatal mortality rates at all
gestational ages compared with females. Gestational age-specific growth restriction rates based on a sex-specific standard were qualitatively consistent with gestational age-specific perinatal mortality rates among males and females. However, growth restriction patterns among males and females based on a unisex standard could not be reconciled with perinatal mortality patterns. Use of a single standard for whites and blacks resulted in gestational age-specific growth restriction rates that were qualitatively congruent with patterns of perinatal mortality, while use of separate race-specific standards led to growth restriction patterns that were incompatible with patterns of perinatal mortality.
Conclusion: Qualitative congruence between growth restriction and perinatal mortality patterns
provides an outcome-based justification for sex-specific birth weight for gestational age standards but not for the available race-specific standards for blacks and whites in the United States.
Published: 20 February 2005
BMC Pregnancy and Childbirth 2005, 5:3 doi:10.1186/1471-2393-5-3
Received: 04 May 2004 Accepted: 20 February 2005
This article is available from: http://www.biomedcentral.com/1471-2393/5/3 © 2005 Joseph et al; licensee BioMed Central Ltd.
Background
Birth weight-specific perinatal mortality curves among male and female births intersect to produce a paradox: overall perinatal mortality rates and perinatal mortality rates at lower birth weights are relatively higher among male births, while at higher birth weights perinatal mor-tality rates are relatively higher among female births [1]. This puzzling observation reflects a general phenomenon that is also seen when birth weight- and gestational age-specific perinatal mortality curves are contrasted across race, plurality, maternal smoking status, parity, altitude, country, and other determinants of birth weight and ges-tational age [2-14]. We have previously presented a solu-tion for this paradox of intersecting mortality curves that involves a reformulation of perinatal and neonatal mor-tality risk [15-20]. This reformulation, based on the fetuses at risk approach, eliminates the crossover phe-nomenon and provides several new insights into perinatal health issues.
In this paper, we demonstrate the paradoxical crossover of birth weight-specific perinatal mortality curves among male and female births and show how this phenomenon is resolved using the fetuses at risk approach. We also explore issues related to fetal growth restriction among males and females using the same approach. This latter issue is particularly important from a conceptual and clin-ical standpoint because the current literature on birth weight for gestational age standards (sometimes referred to as fetal growth standards) is confusing. Some standards provide unisex reference values [21-24], several are sex-specific [1,25-34] and yet others provide both sex-sex-specific and unisex reference values [35-38]. Of equal concern is the fact that several standards are customized for different races [1,25,27-29], parity [25,27,29,34,36], plurality [24,30] and other characteristics [27], while others are not [21-23,26,31-33,35,37].
We used the fetuses at risk approach to contrast growth restriction and perinatal mortality rates among males and females in order to provide empirical justification for sex-specific (vs unisex) birth weight for gestational age stand-ards. We also constructed and compared gestational age-specific growth restriction and perinatal mortality curves among whites vs blacks in order to evaluate currently available birth weight for gestational age standards (single standard vs separate standards for whites and blacks in the United States).
Methods
We used data on all reported live births and stillbirths in the United States in 1997 and 1998 (National Center for Health Statistics perinatal mortality data file for all states and the District of Columbia for 1997 and 1998). Live births and infant death records for these years have been
previously linked and gestational duration has been calcu-lated based on the last menstrual period (LMP). Missing or inconsistent information on gestational age has been imputed or replaced in a small fraction (approximately 7 percent) of records by the National Center for Health Sta-tistics (Hyattsville, Maryland). Gestational age was imputed from the month and year of the LMP when the exact LMP day was missing [39]. LMP-based gestational age information was replaced by the clinical estimate [40] when the former was inconsistent with birth weight or when there was no information on LMP (approximately 5 percent of births).
Analyses were restricted to singleton live births and still-births ≥22 weeks gestational age and ≥500 g birth weight in order to eliminate potential problems arising from regional differences in birth registration. Male and females births were first contrasted in terms of their gesta-tional age and birth weight distributions. Birth weights were categorized into 500 g intervals for this purpose (500–999 g, 1,000–1,499 g, 1,500–1,999 g and so on). Birth weight-specific perinatal mortality rates, calculated within these birth weight categories, were computed as per convention by dividing the number of stillbirths and early neonatal (0 to 6 days) deaths in any birth weight cat-egory by the number of total births (stillbirths and live births) in that birth weight category. Similarly, gestational age-specific perinatal mortality rates among male and female births were contrasted, with rates computed by dividing perinatal deaths at any given gestation by the number of total births at that gestation.
of birth since the responsible pathologic event/process is present at birth [18]. Gestational age-specific 'birth rates' (i.e., the number of births at any particular gestational week divided by the number of fetuses at risk of birth at that gestation) and rates of gestational age-specific labor induction/cesarean delivery were also estimated using the fetuses at risk approach [15-18].
We also examined gestational age-specific patterns of fetal growth restriction using the fetuses at risk approach [15,17-19]. The number of small-for-gestational age (SGA) live births at each gestation was divided by the number of fetuses at risk at that gestation in order to obtain the gestational age-specific SGA rate (or the gesta-tional age-specific fetal growth restriction rate). SGA live births were identified using the 10th percentile cut-off
from a birth weight for gestational age standard based on live births in the United States [38]. Gestational age-spe-cific SGA rates were calculated using both the unisex and sex-specific 10th percentile values provided by this
stand-ard [38] to evaluate how well patterns of gestational age-specific growth restriction correspond with patterns of gestational age-specific perinatal mortality. This evalua-tion was premised on the belief that fetal growth restric-tion patterns should be qualitatively congruent with gestational age-specific perinatal mortality patterns. Such an expectation is consistent with clinical understanding and studies which show that growth restricted fetuses have a substantially higher perinatal mortality than appropriate-for-gestational age fetuses. For instance, Wil-liams et al [1] showed that perinatal mortality at each ges-tational week was much higher among growth restricted births at the 10th percentile of birth weight for gestational
age (eg., perinatal mortality rate 138 per 1,000 total births at 34–35 weeks) compared with appropriate-for-gesta-tional age births at the 50th percentile of birth weight for gestational age (eg., perinatal mortality rate 27 per 1,000 total births at 34–35 weeks). We also examined gesta-tional age-specific growth restriction differences among males and females using rate ratios (eg., growth restriction rate among males at 35 weeks gestation divided by growth restriction rate among females at 35 weeks gestation) and contrasted these with gestational age-specific differences in stillbirth and neonatal mortality rates (also using rate ratios eg., stillbirth rate among males at 35 weeks divided by the stillbirth rate among females at 35 weeks; early neonatal death rate among males at 35 weeks divided by the early neonatal death rate among females at 35 weeks). This was done to ascertain the relationship between pat-terns of growth restriction and patpat-terns in the two compo-nents of perinatal mortality (stillbirth and early neonatal death).
Comparisons of male and female gestational age-specific growth restriction and gestational age-specific perinatal
mortality patterns were contrasted with similar compari-sons according to maternal race. Specifically, live births and stillbirths ≥22 weeks of gestational age and ≥500 g birth weight in the United States in 1997 and 1998 were used to compare gestational age-specific growth restric-tion and perinatal mortality rates among whites vs blacks.
Identification of SGA live births among blacks and whites was carried out using a single standard for both races [38] and also a race-specific standard [29]. As with contrasts between males and females, the contrasts between whites and blacks were restricted to singleton births.
Differences in rates were assessed using rate ratios and excess risks. Taylor series 95% confidence intervals were calculated on all rate ratios. All p values presented are two-sided. Sensitivity analyses were carried out to assess the potential effect of gestational age errors on patterns of growth restriction and perinatal mortality among males and females. Specifically, we reassessed growth restriction and mortality patterns among males and females after excluding all births for whom menstrual-based gesta-tional age was either imputed or replaced by the clinical estimate of gestation.
Results
There were 3,905,694 singleton male births in the United States in 1997 and 1998 (≥22 weeks gestational age and
≥500 g birth weight). The low birth weight (<2,500 g) rate among male live births was 5.5%, and 10.5% of male live births were born preterm (<37 weeks). There were 3,723,153 female births in the United States during the same period and relative to males, female live births had a higher rate of low birth weight (6.4%, p < 0.0001) but a lower rate of preterm birth (9.4%, p < 0.0001). Males had a 14% (95% confidence interval 12 to 16, p < 0.0001) higher perinatal mortality than females; perinatal mortal-ity rates among males and females were 6.78 and 5.95 per 1,000 total births, respectively.
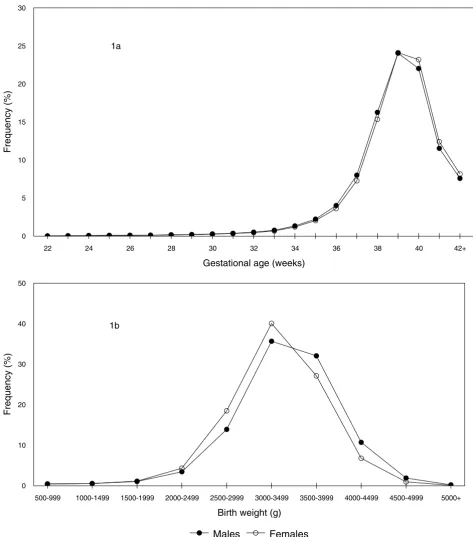
Gestational Age and Birth Weight Distributions of Male and Female Singleton Live Births
Figure 1
Gestational Age and Birth Weight Distributions of Male and Female Singleton Live Births. Gestational age (1a) and birth weight (1b) distributions of male and female singleton live births ≥22 weeks and ≥500 g in the United States, 1997 and 1998.
22 24 26 28 30 32 34 36 38 40 42+
Gestational age (weeks) 0
5 10 15 20 25 30
Frequency (%)
500-999 1000-1499 1500-1999 2000-2499 2500-2999 3000-3499 3500-3999 4000-4499 4500-4999 5000+
Birth weight (g) 0
10 20 30 40 50
Frequency (%)
Males Females
1a
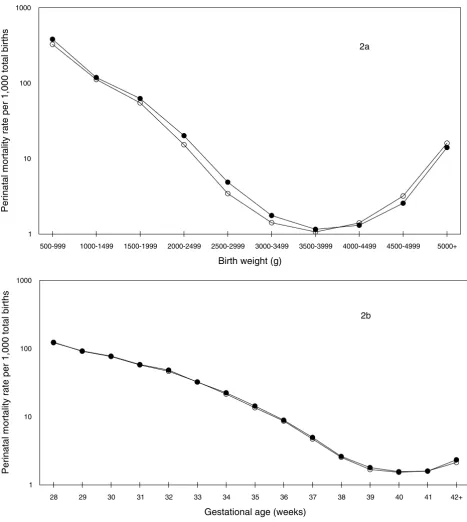
Conventional Calculation: Birth Weight- and Gestational Age-Specific Perinatal Mortality Rates among Male and Female Births
Figure 2
Conventional Calculation: Birth Weight- and Gestational Age-Specific Perinatal Mortality Rates among Male and Female Births. Conventional calculation: birth weight-specific (2a) and gestational age-specific (2b) perinatal mortality rates per 1,000 total births among male and female singleton births in the United States, 1997 and 1998.
500-999 1000-1499 1500-1999 2000-2499 2500-2999 3000-3499 3500-3999 4000-4499 4500-4999 5000+
Birth weight (g) 1
10 100 1000
Perinatal mortality rate per 1,000 total births
28 29 30 31 32 33 34 35 36 37 38 39 40 41 42+
Gestational age (weeks) 1
10 100 1000
Perinatal mortality rate per 1,000 total births
Males Females
2a
Table 1: Gestational Age-Specific Numbers and Rates of Perinatal Death among Male Singleton Births, United States, 1997 and 1998.
Gestational age Stillbirths Live births Early neonatal deaths
Perinatal mortality rate (1)†
Fetuses at risk Perinatal mortality rate (2)†
28 648 6,808 263 122.2 3,841,944 0.24
29 579 8,100 221 92.2 3,834,488 0.21
30 701 11,297 230 77.6 3,825,809 0.24
31 668 14,339 208 58.4 3,813,811 0.23
32 809 20,242 209 48.4 3,798,804 0.27
33 786 30,140 212 32.3 3,777,753 0.26
34 881 51,673 298 22.4 3,746,827 0.31
35 915 86,166 338 14.4 3,694,273 0.34
36 1,033 154,986 354 8.9 3,607,192 0.38
37 1,144 308,629 394 5.0 3,451,173 0.45
38 1,173 626,450 470 2.6 3,141,400 0.52
39 1,122 925,764 541 1.8 2,513,777 0.66
40 897 848,527 431 1.6 1,586,891 0.84
41 469 444,468 237 1.6 737,467 0.96
≥42* 454 292,076 229 2.3 292,530 2.33
Total‡ 17,680 3,888,014 8,800 6.8 3,905,694 6.78
† Total births at each gestational week served as the denominator for perinatal mortality rates (1), while perinatal mortality rates (2) were calculated using fetuses at risk as the denominator (see text). All rates are expressed per 1,000.
* Large increase in perinatal mortality (2) at ≥42 weeks is partly because the period of risk exceeds 1 week (see also Figures 3-5). ‡ All gestational ages, including those ≥22 weeks and those with missing gestational age.
Table 2: Gestational Age-Specific Numbers and Rates of Perinatal Death among Female Singleton Births, United States, 1997 and 1998.
Gestational age Stillbirths Live births Early neonatal deaths
Perinatal mortality rate (1)†
Fetuses at risk Perinatal mortality rate (2)†
28 614 5,838 184 123.7 3,665,497 0.22
29 530 7,000 158 91.4 3,659,045 0.19
30 611 9,742 179 76.3 3,651,515 0.22
31 578 12,493 173 57.5 3,641,162 0.21
32 632 17,168 195 46.5 3,628,091 0.23
33 654 25,282 187 32.4 3,610,291 0.23
34 747 44,275 221 21.5 3,584,355 0.27
35 796 75,238 234 13.5 3,539,333 0.29
36 874 133,386 286 8.6 3,463,299 0.33
37 927 267,501 337 4.7 3,329,039 0.38
38 1,071 563,676 361 2.5 3,060,611 0.47
39 1,072 885,523 419 1.7 2,495,864 0.60
40 926 851,848 376 1.5 1,609,269 0.81
41 505 455,313 222 1.6 756,495 0.96
≥42* 443 300,234 198 2.1 300,677 2.13
Total‡ 15,537 3,707,616 6,614 6.0 3,723,153 5.95
† Total births at each gestational week served as the denominator for perinatal mortality rates (1), while perinatal mortality rates (2) were calculated using fetuses at risk as the denominator (see text). All rates are expressed per 1,000.
[image:6.612.55.553.414.633.2]Fetuses at Risk Approach: Gestational Age-Specific Birth, Labor Induction and Perinatal Mortality Rates among Male and Female Births
Figure 3
Fetuses at Risk Approach: Gestational Age-Specific Birth, Labor Induction and Perinatal Mortality Rates among Male and Female Births. Fetuses at risk approach: Gestational age-specific birth rates (3a, primary Y-axis), labor induction rates (3b, pri-mary Y-axis) and perinatal mortality rates (3a and 3b, secondary Y-axis) among male and female singleton births in the United States, 1997 and 1998.
28 29 30 31 32 33 34 35 36 37 38 39 40 41 42+
Gestational age (weeks) 0
200 400 600 800 1000
Birth rate per 1,000 fetuses at risk
0 0.5 1 1.5 2 2.5
Perinatal mortality rate per 1,000 fetuses at risk
Birth rate-males Birth rate-females Perinatal mortality-males Perinatal mortality-females
28 29 30 31 32 33 34 35 36 37 38 39 40 41 42+
Gestational age (weeks) 0
50 100 150 200 250
Labour induction rate per 1,000 fetuses at risk
0 0.5 1 1.5 2 2.5
Perinatal mortality rate per 1,000 fetuses at risk
Induction-Males Induction-Females Perinatal mortality-males Perinatal mortality-females
3a
mortality patterns among males and females (Tables 1 and 2), with males having a slightly higher perinatal mor-tality rate at some gestational ages (Figure 2b).
Gestational age-specific perinatal mortality rates calcu-lated using the fetuses at risk approach showed that peri-natal mortality rates increased with increasing gestational age (Figure 3). Males had a higher perinatal mortality than females at virtually all gestational ages (Tables 1 and 2). Gestational age-specific 'birth rates' (Figure 3a), gesta-tional age-specific labor induction rates (Figure 3b) and gestational age-specific labour induction and/or cesarean delivery rates (data not shown) were marginally (but con-sistently) higher among pregnancies with males as com-pared with pregnancies with females (Figure 3). For example, the birth rate among males at 35 weeks gestation was 23.6 per 1,000 fetuses at risk, while that among females at 35 weeks was 21.5 per 1,000 fetuses at risk (rate ratio 1.10, 95% confidence interval 1.09 to 1.11, p < 0.0001). The labour induction rates at 35 weeks among males and females were 3.6/1,000 and 3.1/1,000 fetuses at risk, respectively; rate ratio 1.10, 95% confidence inter-val 1.07 to 1.13, p < 0.0001.
Figure 4 compares gestational age-specific rates of fetal growth restriction among males and females. When growth restriction was determined using a sex-specific standard, growth restriction rates among males were higher than growth restriction rates among females at all gestational ages and this pattern was qualitatively congru-ent with sex differences in perinatal mortality (Figure 4a). For instance, males at 35 weeks gestation had an 8 percent (95% confidence interval 5 to 11, p < 0.0001) higher
growth restriction rate than females at the same gesta-tional week (sex-specific standard) and this was qualita-tively congruent with a 17 percent (95% confidence interval 7 to 27 percent, p = 0.0003) higher perinatal death rate among males compared with females at 35 weeks ges-tation. On the other hand, when a unisex standard was used to identify growth restricted live births, males had a
lower rate of growth restriction at all gestational ages and this was not qualitatively congruent with the higher gesta-tional age-specific pattern of perinatal mortality among males (Figure 4b). For instance, at 35 weeks gestation, growth restriction rates determined using a single stand-ard for both males and females showed that males had a 20 percent (95% confidence interval 18 to 22 percent, p < 0.0001) lower rate of growth restriction compared with females (not consistent with the 17% higher perinatal mortality rate).
Overall growth restriction rates based on a sex-specific standard showed that rates were 3% (95% CI 2 to 3) higher among males. Stillbirth and early neonatal mortal-ity differences (rate ratios) among male vs female births
both favored females (Table 3), although the mortality differences were much larger for early neonatal mortality (27%, 95% CI 23 to 31) than for stillbirth (8%, 95% CI 6 to 11). Gestational age-specific differences in growth restriction between males and females based on a sex-spe-cific standard (eg., rate ratio at 35 weeks 1.08, 95% CI 1.05 to 1.11, Table 3) tended to be similar to gestational age-specific differences in stillbirth rates (eg., rate ratio at 35 weeks 1.10, 95% CI 1.00 to 1.21, Table 3), while dif-ferences in gestational age-specific early neonatal mortal-ity tended to be larger (eg., rate ratio at 35 weeks 1.38, 95% CI 1.17 to 1.63, Table 3). Sensitivity analyses carried out to examine the potential effect of gestational age errors (by excluding births among whom gestational age was imputed or for whom the clinical estimate of gesta-tion was used) showed essentially the same patterns of growth restriction and perinatal mortality among males and females.
Patterns of gestational age-specific growth restriction among whites and blacks could not be reconciled with patterns of gestational age-specific perinatal mortality, when growth restriction was defined by a race-specific standard (Figure 5a). Growth restriction rates defined using the race-specific birth weight for gestational age standard showed a crossover with blacks having signifi-cantly higher growth restriction rates than whites below 39 weeks and significantly lower growth restriction rates at 39 weeks and over. For instance, rates of growth restric-tion as defined by the race-specific standard were signifi-cantly lower among blacks compared with whites at 40 weeks gestation (rate ratio 0.89, 95% confidence interval 0.88 to 0.91, p < 0.0001), despite a significantly higher
perinatal mortality rate among blacks at 40 weeks gesta-tion (rate ratio 1.43, 95% confidence interval 1.29 to 1.58, p < 0.0001). On the other hand, rates of gestational age-specific growth restriction were qualitatively congru-ent with patterns of gestational age-specific perinatal mor-tality when growth restriction among blacks and whites was defined using a single birth weight for gestational age standard (Figure 5b). For example, at 40 weeks gestation, the significantly higher rate of perinatal death among blacks was consistent with the significantly higher rate of growth restriction seen among blacks when a single standard was used to define growth restriction (rate ratio for growth restriction at 40 weeks among blacks vs whites 2.06, 95% confidence interval 2.04 to 2.09, p < 0.0001). Growth restriction (based on a single standard for both races) and perinatal mortality rates were substantially higher among births to black mothers as compared with births to white mothers at all gestational ages (Figure 5b).
Discussion
Fetuses at Risk Approach: Gestational Age-Specific Growth Restriction and Perinatal Mortality Rates among Male and Female Births
Figure 4
Fetuses at Risk Approach: Gestational Age-Specific Growth Restriction and Perinatal Mortality Rates among Male and Female Births. Fetuses at risk approach: Gestational age-specific fetal growth restriction (primary Y-axis) and perinatal mortality rates (secondary Y-axis) among male and female singleton births, with growth restriction rates based on sex-specific (4a) and unisex (4b) birth weight for gestational age standards, United States, 1997 and 1998.
28 29 30 31 32 33 34 35 36 37 38 39 40 41 42+
Gestational age (weeks)
0 20 40 60 80 100 120
Growth restriction rate per 1,000 fetuses at risk
0 0.5 1 1.5 2 2.5
Perinatal mortality rate per 1,000 fetuses at risk
SGA-males SGA-females Perinatal mortality-males Perinatal mortality-females
28 29 30 31 32 33 34 35 36 37 38 39 40 41 42+
Gestational age (weeks)
0 20 40 60 80 100 120
Growth restriction rate per 1,000 fetuses at risk
0 0.5 1 1.5 2 2.5
Perinatal mortality rate per 1,000 fetuses at risk
SGA-males SGA-females Perinatal mortality-males Perinatal mortality-females
4a
female births exhibit a puzzling crossover paradox [1]. Gestational age-specific perinatal mortality rates among males and females were similar when mortality rates were calculated per convention (using total births at a particular gestation for calculating the perinatal mortality rate). On the other hand, use of the fetuses at risk formu-lation [15-19,41-44] showed that males have a consistently higher perinatal mortality rate at all gesta-tional ages. Further, our study shows that gestagesta-tional age-specific growth restriction and perinatal mortality rates both increase with advancing gestational age. Gestational age-specific rates of growth restriction among males and females are qualitatively congruent with gestational age-specific perinatal mortality patterns when growth restric-tion rates are based on a sex-specific birth weight for ges-tational age standard. Use of a single standard for males and females results in a gestational age-specific pattern of growth restriction that cannot be reconciled with gesta-tional age-specific differences in perinatal mortality among males and females.
In contradistinction, contrasts between whites vs blacks show that use of a single birth weight for gestational age standard for both races is justified, while the use of a cur-rently available race-based standard is not defensible. Ges-tational age-specific growth restriction patterns among whites vs blacks based on a single standard correspond qualitatively to patterns of gestational age-specific perina-tal morperina-tality among whites and blacks (Figure 5).
Birth weight for gestational age standards are modeled after infant and child growth standards and assume that fetal growth restriction occurs at a constant rate through-out pregnancy. This assumption is implicit in the use of the same, fixed cut-off (eg., the 3rd percentile or the 10th
[image:10.612.53.553.110.407.2]percentile cut-off of birth weight for gestational age) for identifying fetal growth restriction at all gestational ages. Our findings challenge the former assumption and show that in fact fetal growth restriction rates are better viewed as increasing with advancing gestational age (Figures 4 and 5). This contention is supported by the finding that
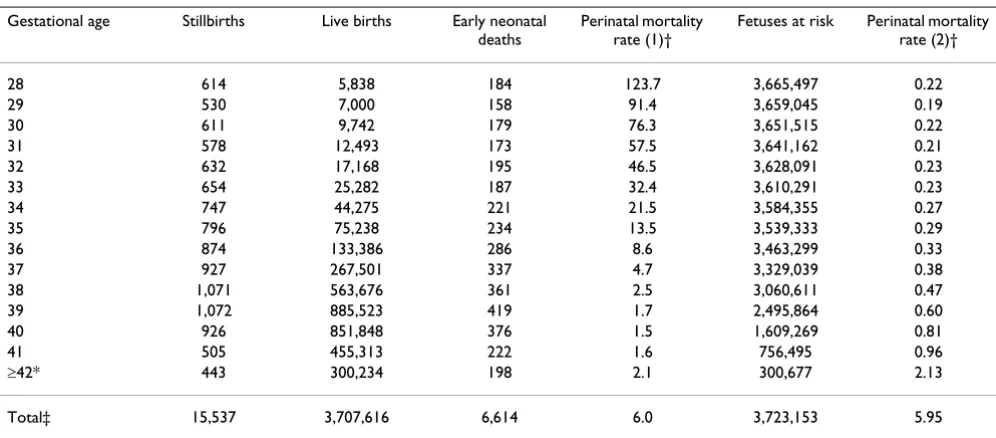
Table 3: Gestational Age-Specific Rates of Fetal Growth Restriction Based on a Sex-Specific Standard [38] and Differences in Growth Restriction, Stillbirth and Early Neonatal Mortality Among Males and Females, Singleton Births, United States, 1997 and 1998.
Gestational age Fetal growth restriction Stillbirth rate ratio(males vs
females)
Early neonatal mortality rate ratio(males vs
females)
Males Females Rate ratio
(males vs females)
Number Rate † Number Rate †
28 631 0.2 502 0.1 1.20 1.01 1.36
29 764 0.2 660 0.2 1.10 1.04 1.33
30 1,165 0.3 923 0.3 1.20 1.10 1.23
31 1,539 0.4 1,369 0.4 1.07 1.10 1.15
32 2,141 0.6 1,866 0.5 1.09 1.22 1.02
33 3,294 0.9 2,946 0.9 1.07 1.15 1.08
34 5,691 1.6 5,098 1.5 1.07 1.13 1.29
35 8,934 2.5 7,922 2.3 1.08 1.10 1.38
36 15,813 4.6 13,910 4.2 1.09 1.13 1.19
37 30,029 9.1 25,180 7.9 1.15 1.19 1.13
38 55,401 18.5 49,599 17.1 1.09 1.07 1.27
39 84,257 35.7 79,440 33.9 1.05 1.04 1.28
40 75,983 52.8 74,504 51.1 1.03 0.98 1.16
41 36,956 62.6 34,214 56.5 1.11 0.95 1.10
≥42 14,679 100.5 14,551 96.7 1.04 1.05 1.19
Total‡ 337,277 91.6 312,684 89.3 1.03 1.08 1.27
† Gestational age-specific growth restriction rates (based on a sex-specific standard [38]) were calculated by dividing the number of small-for-gestational age live births (<10th percentile) at any gestational age by the number of fetuses at risk at that gestation. Stillbirth and early neonatal
mortality rates were also calculated using fetuses at risk as the denominator.
Fetuses at Risk Approach: Gestational Age-Specific Fetal Growth Restriction and Perinatal Mortality Rates among White and Black Births
Figure 5
Fetuses at Risk Approach: Gestational Age-Specific Fetal Growth Restriction and Perinatal Mortality Rates among White and Black Births. Fetuses at risk approach: Gestational age-specific fetal growth restriction (primary Y-axis) and perinatal mortality rates (secondary Y-axis) among white and black singleton births, with growth restriction rates based on a race-specific stand-ard (5a) and on a single birth weight for gestational age standstand-ard (5b), United States, 1997 and 1998.
28 29 30 31 32 33 34 35 36 37 38 39 40 41 42+
Gestational age (weeks)
0 20 40 60 80 100 120 140 160 180 200
Growth restriction rate per 1,000 fetuses at risk
0 0.5 1 1.5 2 2.5 3
Perinatal mortality rate per 1,000 fetuses at risk
SGA-whites SGA-blacks Perinatal mortality-whites Perinatal mortality-blacks
5a
gestational age-specific growth restriction rates follow the pattern of gestational age-specific perinatal mortality rates. Recent studies which show that the incidence of hypertensive disorders and chorioamnionitis increases with increasing gestational age provide at least a partial explanation for the gestational age-dependent rise in fetal growth restriction and perinatal mortality rates [45,46].
Table 3 shows that differences in stillbirth rates between males and females are smaller than differences in early neonatal mortality rates. The phenomenon of higher neo-natal mortality differentials (relative to stillbirth differentials) between males and females has been previ-ously noted [1] and is probably a consequence of obstetric intervention. Obstetric intervention (i.e., early delivery through labor induction and/or cesarean delivery) is typi-cally prompted by signs of fetal compromise and will be more likely among pregnancies with male fetuses given the male fetuses' greater biological vulnerability. Such intervention leads to a reduction in the stillbirth differen-tial, while having a smaller (or the opposite) effect on neonatal mortality differences between males and females. This explanation is supported by the higher rates of labor induction (and labour induction and/or cesarean delivery) observed among pregnancies with male fetuses (Figure 3b). Differences in rates of congenital anomalies that are lethal after birth and more frequent in males (eg., X-linked recessive conditions) may partly contribute to this phenomenon as well.
The slightly higher rate of gestational age-specific labor induction/cesarean delivery among males relative to females is encouraging since it suggests that the small mortality risk difference between males and females is already being addressed by modern obstetric practice (despite male sex not being formally identified as a factor in decision making related to obstetric intervention). This may be a consequence of the use of sex-specific birth weight for gestational age standards or sex-specific ultra-sound-based fetal growth standards and, as mentioned, probably also reflects higher rates of suspected fetal com-promise among pregnancies with male fetuses. Despite the marginally higher rates of labor induction among pregnancies with male fetuses, however, mortality differ-ences persist. Research should be directed at ascertaining whether excess neonatal mortality among males can be successfully reduced through explicit recognition of male sex as a factor for altering the threshold for obstetric intervention.
Although contemporary birth weight for gestational age standards have substantial face validity [1,47,48], their development would benefit from greater empirical sup-port and validation. For instance, it should be feasible to refine standards based on empirically observed
(cause-specific) patterns of birth weight-specific perinatal mortal-ity and serious neonatal morbidmortal-ity (at each gestational age). This would represent an improvement over current standards which rely heavily on theoretical assumptions (eg., normality of birth weight at any given gestational age) and insufficiently on relevant empirical information (namely, perinatal morbidity and mortality related to growth restriction). Such cross-sectional information can-not address fetal growth in continuing pregnancies, how-ever; the latter requires longitudinal information which is ideally obtained through ultrasonographic measure-ments. On the other hand, estimation of fetal weight through ultrasonography [31,49] needs to be improved [50,51] and diagnostic methods for identifying fetal growth restriction have tended to rely on other indicators of growth restriction besides estimated fetal weight.
Our study has limitations that are typical of studies that use large data bases. Errors in gestational age information are inevitable, although the magnitude of these errors is likely to be similar among male and female births. The overall rate of missing gestational age was low, however (0.9 percent among white live births and 0.8 percent among black live births). Our estimates of gestational age-specific fetal growth restriction rates are approximate. Ide-ally, estimation of the incidence of fetal growth restriction requires identification of fetal growth restriction on a lon-gitudinal basis among continuing pregnancies [18]. The alternative measure of gestational age-specific growth restriction employed in our study represents an index of 'revealed' fetal growth restriction [18]. This approxima-tion is unlikely to be a factor that seriously distorts patterns of gestational age-specific growth restriction since faltering of fetal growth typically leads to a spontaneous delivery or delivery following obstetric intervention. Other potential limitations of our study include the use of gestational age information on stillbirths. The gestational age at delivery of a stillbirth typically overestimates the gestational age at the time of fetal death, although this dif-ference is unlikely to be large in recent years. Further, both male and female stillbirths would have been affected by this measurement error to a similar extent.
Conclusion
race-specific standards since gestational age-race-specific growth restriction patterns among blacks and whites (based on a single standard) are qualitatively congruent with gesta-tional age-specific patterns of perinatal mortality.
Competing interests
The author(s) declare that they have no competing interests.
Authors' contributions
KSJ proposed the study, carried out the analyses and drafted the manuscript. The results of the analyses were presented and discussed at a meeting of the Fetal and Infant Health Study Group of the Canadian Perinatal Sur-veillance System. All authors contributed to revising the manuscript for intellectual content. All authors read and approved the final version.
Acknowledgements
We are grateful to National Center for Health Statistics for providing us with access to the data. This study was carried out under the auspices of the Fetal and Infant Health Study Group of the Canadian Perinatal Surveil-lance System. Dr. Joseph, Dr. Dodds and Dr. Allen are supported by Clin-ical Research Scholar awards from the Dalhousie University Faculty of Medicine. Dr. Joseph is a recipient of a Peter Lougheed New Investigator award of the Canadian Institutes of Health Research and Dr. Dodds is a New Investigator of the Canadian Institutes of Health Research.
References
1. Williams R, Creasy R, Cunningham G, Hawes W, Norris F, Tashiro M: Fetal growth and perinatal viability in California.Obstet Gynecol 1982, 59:624-632.
2. Yerushalmy J: The relationship of parents' cigarette smoking to outcome of pregnancy – implications as to the problem of inferring causation from observed associations.Am J Epidemiol
1971, 93:443-56.
3. Meyer MB, Comstock GW: Maternal cigarette smoking and perinatal mortality.Am J Epidemiol 1972, 96:1-10.
4. Wilcox AJ, Russell IT: Why small black infants have lower mor-tality than small white infants: the case for population-spe-cific standards for birth weight.J Pediatr 1990, 116:7-10. 5. Wilcox AJ, Russell IT: Birthweight and perinatal mortality: III.
Towards a new method of analysis. Int J Epidemiol 1986,
15:188-96.
6. Wilcox AJ, Skjœrven R: Birth weight and perinatal mortality: the effect of gestational age.Am J Public Health 1992, 82:378-82. 7. English PB, Eskenazi B: Reinterpreting the effects of maternal
smoking on infant birthweight and perinatal mortality: a multivariate approach to birth weight standardization.Int J Epidemiol 1992, 21:1097-1105.
8. Wilcox AJ: Birth weight and perinatal mortality: the effect of maternal smoking.Am J Epidemiol 1993, 137:1098-1104. 9. Buekens P, Wilcox A: Why do small twins have a lower
mortal-ity than small singletons?Am J Obstet Gynecol 1993, 168:937-41. 10. Wilcox AJ, Skjœrven R, Buekens P, Kiely J: Birth weight and
peri-natal mortality: A comparison of the United States and Norway.JAMA 1995, 272:709-11.
11. Hertz-Picciotto I, Din-Dzietham R: Comparisons of infant mor-tality using a percentile-based method of standardization for birthweight or gestational age.Epidemiol 1998, 9:61-7. 12. Lie RT: Invited commentary: Intersecting perinatal mortality
curves by gestational age – are appearances deceiving?Am J Epidemiol 2000, 152:1117-9.
13. Cheung YB, Yip P, Karlberg J: Mortality of twins and singletons by gestational age: a varying-coefficient approach. Am J Epidemiol 2000, 152:1107-16.
14. Wilcox AJ: On the importance – and the unimportance – of birthweight.Int J Epidemiol 2001, 30:1233-41.
15. Joseph KS, Liu S, Demissie K, Wen SW, Platt RW, Ananth CV, Dzak-pasu S, Sauve R, Allen AC, Kramer MS, for the Fetal and Infant Health Study Group of the Canadian Perinatal Surveillance System: A parsi-monious explanation for intersecting perinatal mortality curves: understanding the effect of plurality and of parity.
BMC Pregnancy Childbirth 2003, 3:3.
16. Joseph KS, Allen AC, Lutfi S, Murphy-Kaulbeck L, Vincer MJ, Wood E:
Does the risk of cerebral palsy increase or decrease with increasing gestational age?BMC Pregnancy Childbirth 2003, 3:8. 17. Joseph KS, Demissie K, Platt RW, Ananth CV, McCarthy BJ, Kramer
MS: A parsimonious explanation for intersecting perinatal mortality curves: understanding the effects of race and of maternal smoking.BMC Pregnancy Childbirth 2004, 4:7.
18. Joseph KS: Incidence based measures of birth, growth restric-tion and death can free perinatal epidemiology from errone-ous concepts of risk.J Clin Epidemiol 2004, 57:889-97.
19. Joseph KS: Theory of obstetrics: the fetuses at risk approach as a causal paradigm.J Obstet Gynaecol Can 2004, 26:953-6. 20. Platt RW, Joseph KS, Ananth CV, Grondines J, Abrahamowicz M,
Kramer MS: A proportional hazards model with time-depend-ent covariates and time-varying effects for analysis of fetal and infant death.Am J Epidemiol 2004, 160:199-206.
21. Gruenwald P: Growth of the human fetus. I. Normal growth and its variation.Am J Obstet Gynecol 1966, 94:1112-9.
22. Usher R, McLean F: Intrauterine growth of live-born Caucasian infants at sea-level: standards obtained from measurements in 7 dimensions of infants born between 25 and 44 weeks gestation.J Pediatr 1969, 74:901-10.
23. David R: Population-based intrauterine growth curves from computerized birth certificates.South Med J 1983, 76:1401-6. 24. Ananth CV, Vintzileos AM, Shen-Schwarz S, Smulian JC, Lai Y-L:
Standards of birth weight in twin gestations stratified by pla-cental chorionicity.Obstet Gynecol 1998, 91:917-24.
25. Brenner W, Edelman D, Hendricks C: A standard of fetal growth for the United States of America.Am J Obstet Gynecol 1976,
126:555-64.
26. Lawrence C, Fryer J, Karlberg J, Niklasson A, Ericson A: Modeling of reference values for size at birth. Acta Paediatr Scand 1989,
350(suppl):55-69.
27. Gardosi J, Chang A, Kalyan B, Sahota D, Symonds E: Customized antenatal growth charts.Lancet 1992, 339:283-7.
28. Amini S, Catalano P, Hirsch V, Mann L: An analysis of birth weight by gestational age using a computerized perinatal data base, 1975–1992.Obstet Gynecol 1994, 83:342-52.
29. Zhang J, Bowes W Jr: Birth-weight-for-gestational-age patterns by race, sex, and parity in the United states population.Obstet Gynecol 1995, 86:200-208.
30. Arbuckle T, Wilkins R, Sherman G: Birth weight percentiles by gestational age in Canada.Obstet Gynecol 1993, 81:39-48. 31. Maršál K, Persson P-H, Larsen T, Lilja H, Selbing A, Sultan B:
Intrau-terine growth curves based on ultrasonically estimated foe-tal weights.Acta Paediatr 1996, 85:843-8.
32. Beeby PJ, Bhutap T, Taylor LK: New South Wales population-based birthweight percentile charts.J Paediatr Child Health 1996,
32:512-8.
33. Kramer MS, Platt RW, Wen SW, Joseph KS, Allen A, Abrahamowicz M, Blondel B, Breart G, for the Fetal/Infant Health Study Group of the Canadian Perinatal Surveillance System: A new and improved pop-ulation-based Canadian reference for birth weight for gesta-tional age.Pediatrics 2001, 108:E35.
34. Källén B: A birth weight for gestational age standard based on data in the Swedish Medical Birth Registry, 1985–1989.Eur J Epidemiol 1995, 11:601-6.
35. World Health Organization: Physical status: the use and inter-pretation of anthropometry. In Report of a WHO expert committee. Technical Report Series No. 854 Geneva: WHO; 1995.
36. Lubchenco L, Hansman C, Dressler M, Boyd E: Intrauterine growth as estimated from liveborn birth weight data at 24 to 42 weeks of gestation.Pediatrics 1963, 32:793-800.
37. Thomson A, Billewicz W, Hytten F: The assessment of fetal growth.J Obstet Gynaecol Br Common 1968, 75:903-16.
38. Alexander G, Himes J, Kaufman R, Mor J, Kogan M: A United States national reference for fetal growth. Obstet Gynecol 1996,
Publish with BioMed Central and every scientist can read your work free of charge "BioMed Central will be the most significant development for disseminating the results of biomedical researc h in our lifetime."
Sir Paul Nurse, Cancer Research UK
Your research papers will be:
available free of charge to the entire biomedical community
peer reviewed and published immediately upon acceptance
cited in PubMed and archived on PubMed Central
yours — you keep the copyright
Submit your manuscript here:
http://www.biomedcentral.com/info/publishing_adv.asp
BioMedcentral
39. Taffel S, Johnson D, Heuse R: A method of imputing length of gestation on birth certificates.Vital Health Stat 2 1982, 93:1-11. 40. MacDorman MF, Atkinson JO: Infant mortality statistics from
the linked birth/infant death data set – 1995 period data. In
Monthly Vital Statistics ReportVolume 46. Issue Suppl 2 Hyattsville, MD: National Center for Health Statistics; 1998.
41. Yudkin PL, Wood L, Redman CWG: Risk of unexplained stillbirth at different gestational ages.Lancet 1987, 1:1192-4.
42. Ferguson R, Myers SA: Population study of the risk of fetal death and its relationship to birth weight, gestational age, and race.Am J Perinatol 1994, 11:267-72.
43. Hilder L, Costeloe K, Thilaganathan B: Prolonged pregnancy: evaluating gestation-specific risks of fetal and infant mortality.Br J Obstet Gynaecol 1998, 105:169-73.
44. Kramer MS, Liu S, Luo Z, Yuan H, Platt RW, Joseph KS: Analysis of perinatal mortality and its components: time for a change?
Am J Epidemiol 2002, 156:493-7.
45. Caughey AB, Stotland NE, Escobar GJ: What is the best measure of maternal complications of term pregnancy: ongoing preg-nancies or pregpreg-nancies delivered? Am J Obstet Gynecol 2003,
189:1047-52.
46. Caughey AB, Musci TJ: Complications of term pregnancies beyond 37 weeks of gestation.Obstet Gynecol 2004, 103:57-62. 47. Battaglia F, Frazier T, Hellegers A: Birth weight, gestational age,
and pregnancy outcome, with special reference to high birth weight-low gestational age infant.Pediatrics 1966, 37:417-22. 48. Platt RW, Abrahamowicz M, Kramer MS, Joseph KS, Mery L, Blondel
B, Breart G, Wen SW: Detecting and eliminating erroneous gestational ages: a normal mixture model. Stat Med 2001,
20:3491-503.
49. Hadlock FP, Harrist RB, Carpenter RJ, Deter RL, Park SK: Sono-graphic estimation of fetal weight.Radiology 1984, 150:535-40. 50. Nahum GG, Stanislaw H: Ultrasonographic prediction of term
birth weight: how accurate is it? Am J Obstet Gynecol 2003,
188:566-74.
51. Lerner JP: Fetal growth and well-being.Obstet Gynecol Clin North Am 2004, 31:159-76.
Pre-publication history
The pre-publication history for this paper can be accessed here:
![Table 3: Gestational Age-Specific Rates of Fetal Growth Restriction Based on a Sex-Specific Standard [38] and Differences in Growth Restriction, Stillbirth and Early Neonatal Mortality Among Males and Females, Singleton Births, United States, 1997 and 1998.](https://thumb-us.123doks.com/thumbv2/123dok_us/839089.1099845/10.612.53.553.110.407/gestational-restriction-differences-restriction-stillbirth-neonatal-mortality-singleton.webp)
