Development of a Retaining Wall Inventory and Condition Assessment System. (Under the direction of Dr. William Rasdorf and Dr. Mohammed Gabr.)
Under Section 1106 of the “Moving Ahead for Progress in the 21st Century Act,” also commonly referred to as “MAP-21,” State agencies are required to “develop a risk-based asset management plan for the National Highway System to improve or preserve the condition of the assets and the performance of the system” [23 USC 119(e)(1)]. Thus, it is mandated that measures are put into place for highway assets that may potentially fail as they age. In the past, permanent earth retaining structures (ERSs), including retaining walls, were such assets that were often excluded from inventory programs and were regarded as non-critical or lost assets.
Department of Transportation (NCDOT). The research products developed as a result of this study include a literature review of highway agencies with the most notable contributions in wall asset management, an identification of ERS data attributes and critical elements of data collection, the development of data collection forms for inventory, condition assessment, and criticality assessment, a pilot study of (15) geographically distributed ERS locations, the development of a rating condition assessment model, an evaluation and demonstration of the condition assessment model, the development of a criticality assessment model, the development of a risk assessment matrix, and the design and development of a prototype database.
by
Cedrick Jerrell Butler
A thesis submitted to the Graduate Faculty of North Carolina State University
in partial fulfillment of the requirements for the degree of
Masters of Science
Civil Engineering
Raleigh, North Carolina 2015
APPROVED BY:
_______________________________ ______________________________
Dr. William Rasdorf Dr. Mohammed Gabr
Committee Co-Chair Committee Co-Chair
DEDICATION
BIOGRAPHY
Cedrick Jerrell Butler is currently a graduate student in Civil Engineering at North Carolina State University. He is the son of James Butler Jr. and Cheryl Jennings. He was raised in Burlington, NC and graduated as the salutatorian of Hugh M. Cummings High School. After high school, he attended North Carolina State University where he graduated Magna Cum Laude with a Bachelor of Science degree in Civil Engineering.
TABLE OF CONTENTS
LIST OF TABLES ... ix
LIST OF FIGURES ... xi
1.0 INTRODUCTION... 1
1.1 Background ... 3
1.2 Research Objectives ... 5
1.3 Outcomes and Benefits ... 6
1.4 Thesis Organization ... 7
2.0 LITERATURE REVIEW ... 8
2.1 Asset Management ... 9
2.1.1 Managing Earth Retaining Structures ... 10
2.1.2 NCDOT Asset Management Program ... 10
2.2 Wall Inventory and Inspection Programs ... 11
2.2.1 Wall Inventory Program Development Methodology ... 15
2.2.2 Locating Earth Retaining Structures ... 20
2.2.3 ERS Acceptance Criteria ... 20
2.2.4 ERS Classification ... 23
2.2.5 Data Collection Categories ... 26
2.2.6 Inspection, Condition Assessment, and Rating ... 28
2.2.7 Rating Scales ... 34
3.0 METHODOLOGY ... 39
3.1 Review of NCDOT Walls and Identification of Data Fields... 41
3.1.1 BMS ... 41
3.1.2 HiCAMS ... 43
3.2 Field Site Visit (3) Identification of Data Fields ... 44
3.3 Prototype Locations ... 45
3.3.1 Western Region ... 46
3.3.2 Eastern Region ... 49
3.4 Data Collection ... 54
3.4.1 Inventory Data Collection Form ... 56
3.4.2 Field Condition Assessment Data Collection Form ... 59
3.5 Database Structure and Manipulation ... 62
3.5.1 Enumerated Data Fields ... 63
3.5.2 Tool Selection ... 67
3.5.3 User Interface ... 68
3.5.4 ERS Identification Number ... 70
3.5.5 Database Population and Quality Control ... 72
3.5.6 Reporting Interface ... 72
3.6 Limitations of Methodology ... 74
3.6.1 Data Management ... 75
3.6.3 Data Integrity and Redundancy ... 76
4.0 EXISTING RATING SYSTEMS ... 77
4.1 MCAP ... 77
4.2 PMS ... 78
4.3 BMS ... 79
5.0 PROPOSED RATING SYSTEM ... 80
5.1 Wall Rating Procedure ... 82
5.2 Condition Scoring Assessment ... 84
5.3 Condition Rating Demonstration ... 89
5.3.1 Large Score Deviation ... 89
5.3.2 Small Score Deviation ... 94
5.3.3 Safety Critical Criteria ... 95
5.3.4 Non-Safety Critical Criteria ... 96
6.0 RATING SYSTEM FIELD STUDY AND COMPARISON ... 98
6.1 Condition Evaluation Criteria ... 99
6.2 Case Studies ... 102
6.3 Results ... 105
6.3.1 Good Non-MSE Walls ... 107
6.3.2 Poor Non MSE Walls... 109
6.3.3 MSE Wall Rating ... 111
6.3.3.2 MSE Wall in Poor Condition ... 116
7.0 ERS CRITICALITY RATING PROCEDURE ... 119
7.1 Criticality Scoring Assessment ... 123
7.2 Rating Methodology and Demonstration ... 125
8.0 WICAS PROGRAM PHILOSOPHY ... 128
8.1 Risk Assessment... 129
8.2 Discussion of System Framework Philosophy ... 132
8.2.1 Step 1: Collect Inventory Data ... 133
8.2.2 Step 2: Collect Condition Data ... 134
8.2.2.1 Assemble Inspection Preparation ... 134
8.2.2.2 Inspection Tools and Equipment ... 135
8.2.2.3 Conduct Field Inspections ... 135
8.2.2.4 Perform Additional Engineering Investigation ... 135
8.2.3 Step 3: Determine Wall Criticality ... 136
8.2.4 Step 4: Determine Wall Condition ... 137
8.2.5 Step 5: Perform Risk Assessment ... 138
8.2.6 Step 6: Perform Action Assessment ... 139
8.2.7 Step 7: Perform Inspection Assessment ... 139
8.2.8 Step 8: Implementation ... 140
9.0 SUMMARY ... 140
REFERENCES ... 149
APPENDICES ... 153
Appendix A. Wall Attribute Data Definitions Table ... 154
Appendix B. Wall Type Summary Report ... 157
Appendix C. Wall Function Summary Report ... 158
LIST OF TABLES
Table 2.1: Agencies with an Inventory and Inspection Program ... 12
Table 2.2: ERS Acceptance Crieria for the WIP [DeMarco, et. al. 2010a] ... 22
Table 2.3: Agency Classification of Wall Function and Type ... 24
Table 2.4: FHWA-CFLHD Classification of Wall Types [Brutus and Tauber, 2009] .. 25
Table 2.5: ERS Data Attributes [Brutus and Tauber, 2009] ... 27
Table 2.6: Primary/Secondary Wall Elements [DeMarco, et. al. 2010b] ... 30
Table 2.7: Earth Retaining Structures Condition Checklist [Brutus, et. al. 2011] ... 31
Table 2.8: Vic Roads Retaining Wall Inspection Process [VicRoads, 2011] ... 33
Table 2.9: Wall Element Condition Rating Criteria [DeMarco, et. at. 2009] ... 35
Table 2.10: Conditional Rating States and Calculations [VicRoads, 2011] ... 37
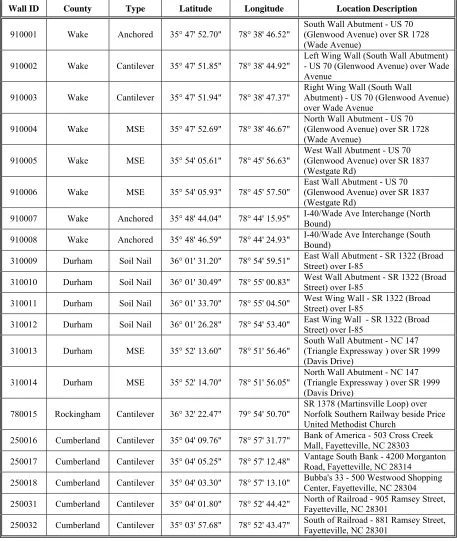
Table 3.1: ERSs Field Surveyed In Western North Carolina ... 47
Table 3.2: ERSs Field Surveyed In Eastern North Carolina ... 50
Table 3.3: Wall Support Table ... 63
Table 3.4: Fill Material Table ... 63
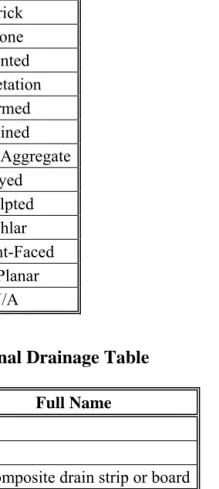
Table 3.5: Retaining Wall Type and Facing Table ... 64
Table 3.6: Wall Top Features Table ... 65
Table 3.7: External Drainage Table ... 65
Table 3.8: Wall Obstructions Table ... 65
Table 3.9: Wall Function Table ... 65
Table 3.11: Internal Drainage Table ... 66
Table 3.12: Soil Reinforcement Table ... 66
Table 3.13: Wall Purpose Table ... 66
Table 3.14: Wall Features Table... 67
Table 3.15: Bridge Maintenance County Numbers ... 71
Table 5.1. Proposed Condition Rating Definitions ... 81
Table 5.2. Possible Wall Rating Outcomes ... 86
Table 5.3. Rating Methodologies for Field Surveyed Walls ... 87
Table 6.1: Variation in Evaluation Criteria by Agency ... 101
Table 6.2: Rating Methodologies for Field Surveyed ERSs ... 104
Table 6.3: MSE Wall (0025) in Good Condition ... 113
Table 6.4: MSE Wall (0014) in Poor Condition ... 114
Table 7.1: Summary Criticality Rating Definitions ... 124
Table 7.2: Possible Criticality Rating Outcomes ... 125
Table 8.1: Risk Assessment Matrix ... 131
LIST OF FIGURES
Figure 2.1: FHWA-CFLHD’s Wall Assessment Procedure [DeMarco, et. at. 2009] ... 39
Figure 3.1: Flow Chart of Project Tasks Undertaken ... 40
Figure 3.2: Geographical Location of All Field Surveyed ERSs ... 46
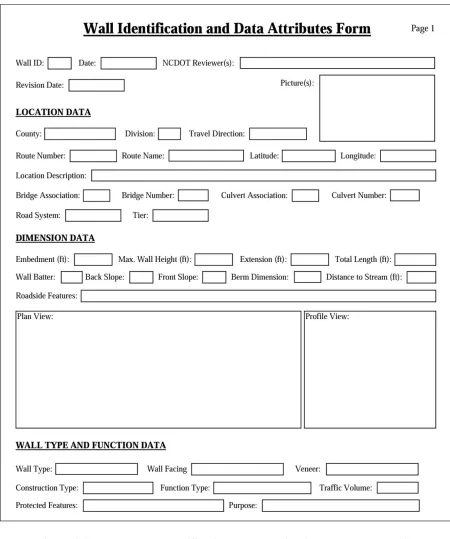
Figure 3.3: Blank Wall Identification and Data Attributes Form (Page 1) ... 57
Figure 3.4: Blank Wall Identification and Data Attributes Form (Page 2) ... 58
Figure 3.5. Blank Field Condition Assessment Data Collection Form... 61
Figure 3.6: WICAS Home Screen ... 69
Figure 3.7: Wall Search Menu ... 69
Figure 3.8: ERS Identification Number ... 71
Figure 3.9: WICAS Reports Menu ... 74
Figure 5.1: Two-Part Summary Rating Approach ... 83
Figure 5.2: Distribution of Composite Scores ... 88
Figure 5.3: Field Condition Assessment Data Collection Form Rating Example 1 ... 90
Figure 5.4: Field Condition Assessment Data Collection Form Rating Example 2 ... 91
Figure 5.5: Field Condition Assessment Data Collection Form Rating Example 3 ... 92
Figure 6.1: Sample Geographical Location of Field Surveyed ERSs ... 103
Figure 6.2: Condition Ratings for Field Surveyed ERSs... 107
Figure 7.1: ERS Criticality Assessment Data Collection Form Example ... 122
Figure 7.2: Two-Part Summary Criticality Rating Approach ... 123
1.0 INTRODUCTION
Asset management is a relatively new concept in geotechnical engineering. Spatial and performance data (obtained by the measurement of a wall’s geometry and performance over time during operating conditions, or through a survey of a wall’s condition) and their use in asset management systems is emerging as an effective approach for prioritizing maintenance and upgrades to optimize the use of ever increasingly limited rehabilitation funds. The principle of asset management has been applied by engineers and planners to strategically prioritize infrastructure improvement and replacement projects based on inventory and condition assessments. The idea is that better management of assets will extend the operational life of existing infrastructure in a way that saves money, sustains reliability, and ensures public safety.
Included in asset management are a database of assets, tools to manage the database, asset condition assessment models, strategies for condition assessment, damage mitigation, and asset rehabilitation and replacement. In general, the nature of permanent highway earth retaining structures (ERSs), including retaining walls, in highway engineering also renders the concept of asset management a valuable tool for operation efficiency and cost control. Described herein is a study focused on ERSs whose purpose is to:
1. Assess ERS data collection needs and methods.
3. Identify five predominant retaining wall types of greatest interest to the North Carolina Department of Transportation (NCDOT).
4. Develop data collection forms for inventory, condition, and criticality assessment. 5. Study existing rating systems to define a new ERS condition metric.
6. Preform a pilot study at (15) geographically distributed ERS locations.
7. Develop a new condition assessment model to provide an indication of the overall condition of an ERS.
8. Define a metric to evaluate ERS risk (likelihood and consequence for failure). 9. Develop a prototype database.
It is recommended that data collection procedures include both ERS spatial as well as ERS attribute (characteristics) data. Spatial data are organized in the prototype database in such a way as to be able to link to existing asset management systems. The proposed database design (of key parameters defining the various types of ERSs in North Carolina) is intended to assist transportation engineers and contractors in evaluating their need for maintenance and replacement as well as to inventory and preserve records for often-lost assets.
tables and the attributes contained in the prototype database as well as a brief discussion on the 32 ERSs (from the 15 geographically distributed ERS locations) that were field surveyed and stored in the in the prototype database.
1.1 Background
The NCDOT owns and operates approximately 80,000 miles of roadway that consists of 1,299 miles of interstate highways, 13,754 miles of primary U.S. and NC numbered routes, 60,068 miles of secondary paved roads, and 4,357 miles of secondary unpaved roads [Conti, et. at. 2012]. While the State’s roads perform relatively efficiently, safely, and functionally, the aging pavements and critical assets that make up the network require investments for improvement and upkeep.
implementation of a retaining wall inventory and condition assessment system (WICAS) is essential for establishing effective master planning, engineering, design, maintenance, and management of geotechnical structures as assets.
Under Section 1106 of the “Moving Ahead for Progress in the 21st Century Act,” also commonly referred to as “MAP-21,” State agencies are required to “develop a risk-based asset management plan for the National Highway System (NHS) to improve or preserve the condition of the assets and the performance of the system” [23 U.S.C. § 119(e)(1) (2012)]. In order to receive Federal funding for transportation improvement projects, the receiving agency must provide, at minimum, the following six items in their State asset management plan [23 U.S.C. § 119(e)(4) (2012)]:
1. A summary listing of the pavement and bridge assets on the NHS in the State, including a description of the condition of those assets.
2. Asset management objectives and measures. 3. Performance gap identification.
4. Lifecycle cost and risk management analysis. 5. A financial plan.
6. Investment strategies.
MAP-21 specifies that funding may be used for eligible projects with the purpose of “inspecting and evaluating other highway infrastructure assets on the NHS, including signs and sign structures, earth retaining walls, and drainage structures” [23 U.S.C. § 119(d)(2)(D)
(2012)]. Recognizing that ERS failures may be costly and detrimental to the safety of the public, it is critical that measures, standards, and condition assessments be applied to ERSs as a part of managing the resources for the maintenance of these highway assets. The maintenance condition report and the infrastructure health dashboard are prime examples of how the NCDOT is already addressing this legislation. However, it is also of utmost importance that measures are put into place for the other potentially risky assets, such as ERSs, identified by MAP-21 so the State’s highway system continues to operate safely, efficiently, and cost effectively.
1.2 Research Objectives
1.3 Outcomes and Benefits
The results from this research study will provide the NCDOT and other highway agencies with a design for an information resource that documents ERSs owned and maintained by various highway agencies. The database underlying the information resource will support a number of applications that will enable highway agencies to properly assess the condition of their ERSs and develop remediation strategies when necessary. Each application supported by the proposed database will be discussed in greater detail.
Additionally, information presented herein would serve as a tutorial for various highway agencies. With these materials highway agencies will be poised to implement the development of inventory, inspection, and condition assessment program and procedures. Finally, highway agencies will obtain a full understanding and articulation of the practical applications of the ERS database presented herein.
1.4 Thesis Organization
programming. Chapters 9 and 10 provide the summary and conclusions from this research study.
2.0 LITERATURE REVIEW
A thorough review of literature was undertaken as a basis for developing a retaining wall asset management program for the NCDOT. This chapter of the thesis aims to provide a better understanding of (1) asset management and inventory systems, (2) NCDOT’s existing asset management program, (3) the current state of practice, (4) classification of common retaining walls and their components, (5) data collection categories, (6) inspection, condition assessment, and ratings, and (7) action assessment.
the most notable contributions in retaining wall asset management and summarize all the literature related to earth retaining structures (ERS), which includes retaining walls.
2.1 Asset Management
2.1.1 Managing Earth Retaining Structures
For the agencies that regularly inspect ERS assets as a part of their bridge inspection program, the raw data collected in the field are generally managed by their bridge management systems (BMS). VicRoads Technical Consulting of Victoria, Australia, records its inspection data in a road asset system (RAS), which is an information system for all structures’ inventory and condition data managed by the Network and Asset Planning Division [VicRoads, 2011]. Conversely, other agencies use a standalone wall management system (WMS) to track and manage their ERS assets. In most cases, these WMS are linked with other management systems. For instance, the Minnesota DOT has its WMS linked to the Permitting Department, the British Columbia Ministry of Transportation has its WMS linked with the Road Inventory Management System, and the Pennsylvania DOT has its WMS linked to the Roadway Management System, Planning and Programming System, and Maintenance Management System [Brutus and Tauber, 2009].
2.1.2 NCDOT Asset Management Program
historical data; condition ratings and performance analyses; and planned and actual work orders, the business processes, and associated rules for each asset are contained in a single central Oracle database. The Performance Dashboard, an online feature derived from AMS, provides the overall health of NCDOT’s highway infrastructure.
2.2 Wall Inventory and Inspection Programs
Over the years, many agencies have recognized the need to include walls such as earth retaining, noise, and visual walls in their inventory and inspection programs. In the past, ERSs were often excluded from inventory and inspection programs. The New York City Department of Transportation first realized the importance of implementing an inventory and inspection system for their ERSs after a few major earth retaining walls failed without warning. One of those failures occurred in 2005 when a 75 foot high earth retaining wall crashed onto Riverside Drive in Manhattan, NY [Brutus, et. al. 2011]. As a result, the northbound lane of the Henry Hudson Parkway was closed for a week. With the recognition that ERS failures may be detrimental to the roadway and the surroundings, many highway agencies have begun to incorporate ERSs into their inventory and inspection programs.
Structures” to help highways agencies with the development of an asset management system for ERSs [Brutus and Tauber, 2009]. Still, only a few agencies have substantial ERS inventory and inspection programs in place, which could benefit from improvement. Two critical components of an infrastructure asset management program for ERSs (or other geotechnical assets) are asset inventories and condition assessments. At the time of this research study, most highway agencies had not fully implemented either component. A complete summary, based on a review of literature and online sources, of the highway agencies with some form of an inventory and/or inspection program is outlined in Table 2.1.
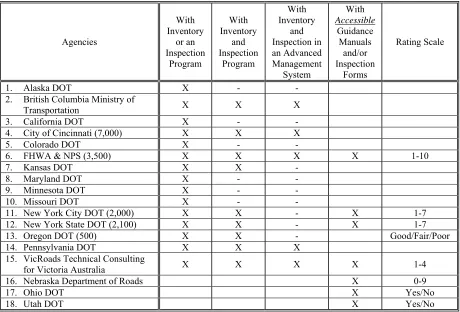
Table 2.1: Agencies with an Inventory and Inspection Program
Agencies With Inventory or an Inspection Program With Inventory and Inspection Program With Inventory and Inspection in an Advanced Management System With Accessible Guidance Manuals and/or Inspection Forms Rating Scale
1. Alaska DOT X - -
2. British Columbia Ministry of
Transportation X X X
3. California DOT X - -
4. City of Cincinnati (7,000) X X X
5. Colorado DOT X - -
6. FHWA & NPS (3,500) X X X X 1-10
7. Kansas DOT X X -
8. Maryland DOT X - -
9. Minnesota DOT X - -
10. Missouri DOT X - -
11. New York City DOT (2,000) X X - X 1-7
12. New York State DOT (2,100) X X - X 1-7
13. Oregon DOT (500) X X - Good/Fair/Poor
14. Pennsylvania DOT X X X
15. VicRoads Technical Consulting
for Victoria Australia X X X X 1-4
16. Nebraska Department of Roads X 0-9
17. Ohio DOT X Yes/No
Note: The number in parenthesis represents the number of earth retaining structures surveyed by each agency, if available.
To date, the most extensive ERS inventory and inspection program in the United States is the FHWA-CFLHD’s inventory of 3,500 earth retaining walls for the National Parks Service (NPS) [CTC, 2013]. The WIP was designed to inventory ERS data, assess the condition of ERSs, provide recommendations, and give cost estimates for overall improvements. It was also designed to mimic the NPS existing Road Inventory Program (RIP) and Bridge Inventory Program (BIP). Implementation of the WIP provided many benefits and challenges for the NPS as outlined below [DeMarco, et. at. 2009]:
i. Benefits
Preventing failures resulting in injuries.
Providing credible documentation of the total value of roadway ERSs, as well as the cost needed to repair and maintain them.
o This documentation will assist budget request approvals. Identifying serious problems before failures occur.
Improving design by identifying design problems before multiple ERSs are designed the same way.
ii. Difficulties
Classifying a particular ERS’s function (ex: wing wall supporting a bridge vs. a retaining wall connected to the wing walls).
Resolving rating inconsistencies because of the inevitable human factor of different inspectors.
In summary, the ultimate benefit of the WIP is its ability to provide information that can be used to mitigate potential failures that may result in injuries to the public and damage to surrounding infrastructure. While the FHWA-CFLHD created the most extensive ERS inventory and inspection program in the United States, there are two agencies with substantial programs that predate the FHWA-CFLHD’s WIP. Since 1990, the City of Cincinnati has used its retaining wall inventory and inspection program to prioritize repairs and replacements [FHWA, 2008]. As a result, the city has surveyed nearly 7,000 retaining walls within its right-of-way. Similarly, the Oregon DOT has a fully developed inventory program that predates FHWA-CFLHD’s WIP, and which is currently being used to assess its retaining walls statewide.
Brutus and Tauber (2009) developed a comprehensive guide for inventorying and inspecting ERSs. Using the procedures outlined in their guide, they surveyed nearly 2,000 retaining walls for the New York City DOT. Similarly, the Alaska DOT and Public Facilities (AKDOT & PF) has relied heavily on the guidance of FHWA-CFLHD to develop a preliminary draft of their 2013 Retaining Wall Inventory Procedure Manual.
As an example of international efforts to address management of ERSs as assets, VicRoads Technical Consulting (2011) produced the “Road Structures Inspection Manual” for Victoria, Australia which applies to retaining walls, visual walls, and noise walls, along with many other roadway structures including bridges and culverts. The British Columbia Ministry of Transportation has both expanded its Bridge Management and Information System (BMIS) and revised its maintenance specification to include ERSs [BC MOT, 2003]. Still, only a few agencies have substantial ERS inventory and inspection programs in place.
2.2.1 Wall Inventory Program Development Methodology
elements and the overall wall, essentially a rating system. After establishing a wall assessment criteria and condition rating system, the FHWA-CFLHD developed an inventory database using Microsoft Access to store all the pertinent data collected. Once they had all the major elements of the WIP in place, the final step was to pilot their methods at several different wall locations. A summary of FHWA-CFLHD’s process for developing the final WIP is outlined below [DeMarco, et. at. 2009]:
i. Initial Research
Identify the range of retaining wall types and elements.
Estimate costs for wall rehabilitation, repair, and replacement.
Determine inventor size.
Research current inventory programs.
ii. Determine Data Collection Method
Develop a plan to collect wall data consistent with existing bridge and road inventory programs.
Develop a method for assessing the condition of wall elements and the entire wall as a whole.
iii. Create/Design A Database
iv. Trial and Error
Pilot the determined data collection methods at select locations and input findings into the database.
Similarly, Brutus and Tauber’s process for developing a retaining wall inventory and inspection system closely resembles that of the FHWA-CFLHD. After reviewing the current state-of-practice, the team determined their next step was to develop a map showing the physical locations of all the ERSs being inventoried and investigated. Once the locations of all ERSs were known, they created a database to store the pertinent data obtained in the field. Following the design of the database, Brutus and Tauber used the guidance of FHWA-CFLHD to develop a condition assessment checklist and rating system. The final step was to pilot their methodology at several ERS locations. A summary of Brutus and Tauber’s inventory and inspection program development is outlined below [Brutus, et. al. 2011].
i. Create a Map showing the location where all retaining walls are located.
Utilize GIS Mapping which enables one to link descriptive data and images with any location (Retaining Wall) on the map.
Determine Location of Retaining walls.
o Review As-built drawings in agency archives
ii. Create a Database that assigns characteristics to each structure. Data to be included:
o ERS (Retaining Wall) ID # o Location Data (GPS coordinates)
o Dimensional Data (height, face area, etc.) o Structural Type (MSE, tie-back, etc.) o Functional Type (Supporting roadway) o Ownership or Maintenance Responsibility o Previous data on wall condition
o Records of inspections and actions taken
iii. Create a Check List to be used to determine the Condition of the retaining wall. Conditions to be included (among others):
o Wall or parts of it, out of plumb, tilting or deflecting o Bulges or distortion in wall facing
o Some elements not fully bearing against load o Misaligned joints
o Cracks or spalls in concrete, brick or stone masonry o Missing blocks, bricks, or other facing elements, o Settlement behind wall
The inspection team records the conditions observed and takes photographic documentation.
The surrounding area is also assessed to establish the consequences of wall failure.
iv. Assess the Performance of the retaining wall (Essentially the Rating System) Inspection data are brought back to office personnel for review and a decision for
future action is made.
Office personnel use the consequences of failure to establish the time frame for repair and future inspection.
2.2.2 Locating Earth Retaining Structures
As part of a state-of-practice review, Brutus and Tauber discovered that most agencies initially locate ERSs by aerial surveying or reviewing design drawings and records, and then confirm the located ERSs on the ground [Brutus and Tauber, 2009]. Both Brutus and Tauber and the AKDOT & PF used as-built drawings to help determine the location of many ERSs. For Brutus and Tauber, once all the documented ERSs were mapped, a detailed analysis of aerial photographs and extensive site visits were undertaken to locate additional ERSs not documented in the drawing archives. At the time of this review, AKDOT & PF have not reached the point where site visits could be conducted to verify or obtain additional ERS information, but plan to use light detection and ranging (LiDAR) technologies to aid in the process of measuring ERS geometry. In addition to using as-built drawings, the AKDOT & PF also utilize Google Maps and Digital Roadway View Alaska to help locate ERSs. Similarly, the Oregon DOT currently uses Google Maps and Bing Maps for visual ERS locations and conducts field visits to locate others.
2.2.3 ERS Acceptance Criteria
guidelines to help reduce the size of the inventory is crucial for creating a database that is both manageable and suitable.
Included in FHWA-CFLHD’s WIP are earth retaining walls and qualified culvert headwalls located on all classes of paved roadways and parking areas. The four main guidelines used to select these ERSs are: the ERS must be located along a qualifying roadway, the ERS must be related to a roadway asset, the ERS’s height must be greater than or equal to 4ft with the exception of culvert headwalls and wing wall (greater than or equal to 6ft), and the ERS must have an internal wall face angle greater than or equal to 45 [DeMarco, et. al. 2010b]. Table 2.2 summarizes the complete wall acceptance criteria used by FHWA-CFLHD. Likewise, both the Oregon DOT and the AKDOT & PF also used a wall height greater than or equal to 4ft. However, the most common wall height criterion used by the New York State DOT, New York City DOT, and British Columbia Ministry of Transportation (British Columbia) is 6 feet. Irrespective of height preference, a minimum height criterion is used by virtually every highway agency with an ERS inventory program. In the end, the intent of this criterion is to exclude low ERSs that do not pose a major threat if failure were to occur. As a result, the extra time, cost, and effort required to inventory non-critical ERSs can be reduced significantly.
includes ERSs that are a part of a roadway asset (such as a bridge) or ERSs that have a face angle greater than or equal to 45. Similarly, the British Columbia also included ERSs that have a face angle greater than or equal to 45 in their inventory. According to the National Highway Institute, a retaining wall is defined as an earth retaining structure having an internal face angle greater than or equal 70⁰ [Brutus and Tauber, 2009]. However, the AKDOT & PF, FHWA-CFLHD, and British Columbia each opted to deviate from this standard definition to allow the capture of ERSs with shallower slopes (e.g., rockeries, tiered wall) in the final inventory.
Table 2.2: ERS Acceptance Crieria for the WIP [DeMarco, et. al. 2010a]
Criteria Subject Criteria Definition
Qualifying Roads
The inventory includes retaining walls, together with qualifying culvert headwalls, located on all classes of paved park roadways and parking areas as described in the RIP Route Inventory Report or identified by park facilities, maintenance, or resource staff.
Relation to Roadway Asset
Retaining walls and culvert headwalls, that meet the minimum height requirements, must reside within the known or assumed construction limits of the existing roadway or parking area and must support or protect the roadway or parking area.
Wall Height
The maximum wall height, measuring only that portion of the wall structure intended to actively retain soil and/or rock, must be greater than or equal to 4 ft. For culvert headwalls or wing walls, maximum wall heights must be greater than or equal to 6 ft.
Wall Embedment
Include fully- or partially-buried retaining wall structures in the inventory that are known to meet the minimum wall height requirements, and when wall locations are known or verifiable.
Wall Face Angle
Individual walls are further defined by an internal wall face angle, measured at the wall face, greater than or equal to 45⁰ (≥1H:1V face slope ratio). This criterion also applies to the internal angle of tiered wall systems (when considered as a single wall system), measured along the top edges of each wall tier.
General Acceptance
For most agencies, only walls that serve as an earth retaining structure are included in the final inventory. As a result, sound and noise walls are often excluded from inventory because they do not retain earth. In the same way, agencies like the NY City DOT generally exclude ERSs that are associated with bridges. Unlike the FHWA-CFLHD and the AKDOT & PFDOT&PF, Brutus and Tauber excluded all ERS associated with bridges in the NY City DOT wall inventory. This would include retaining walls along a bridge abutment (wing wall) and culvert headwalls. According to Brutus and Tauber, there is no need to include wing walls and culvert headwall in the final wall inventory because they are already inventoried by bridge inspection programs [Brutus and Tauber, 2009].
2.2.4 ERS Classification
Similarly, the typical retaining wall types included in Brutus and Tauber’s inventory were gravity walls, soldier piles with lagging, mechanically stabilized earth walls, and soil nail walls. AKDOT & PF plans to have its final data base structure correspond directly with those used by FHWA-CFLHD. A summary of the retaining wall types and wall functions used by FHWA-CFLHD, AKDOT & PF, and Brutus and Tauber is listed in Table 2.3. Depicted in Table 2.4 is FHWA-CFLHD’s suggested approach of classifying different wall structure types.
Table 2.3: Agency Classification of Wall Function and Type
Wall Function Wall Type
FHWA-CFLHD AKDOT & PF FHWA-CFLHD &
AKDOT & PF Brutus and Tauber
Fill Wall Bridge associated Anchor, Tieback H-Pile Gravity Walls
Cut Wall Grade separation Anchor, Micropile Soldier Piles with Lagging
Head Wall Slope stabilization Anchor, Tieback SheetPile Mechanically Stabilized
Bridge Wall Earth retaining, cut Bin, Concrete Soil Nail Walls
Switchback wall Earth retaining, fill Bin, Metal
Slope Protection Pedestrian Undercrossing Cantilever, Concrete Flood control Cantilever, Soldier Pile
Seawall Cantilever, Sheet Pile
Crib, Concrete
Crib, Metal
Crib, Timber
Gravity, Block, or Brick Gravity, Mass Concrete Gravity, Dry Stone
Gravity, Gabion
Gravity, Mortared Stone MSE, Geosynthetic Face
MSE, Precast Panel
MSE, Segmental Block
MSE, Welded Wire Face
Soil Nail
Table 2.4: FHWA-CFLHD Classification of Wall Types [Brutus and Tauber, 2009]
(Adapted from FHWA Geotechnical Engineering Circular No. 2, 1997)
Fill-Constructed Walls (Built from the Bottom Up)
Externally Stabilized Internally Stabilized
Rigid Gravity Walls Mechanically Stabilized Earth (MSE) Walls -Masonry gravity walls (stone, concrete, brick) -Segmental, pre-Cast facing MSE wall -Cast-in-place (CIP) concrete gravity walls -Prefabricated modular block facing
-Flexible facing (geotextile, geogrid or welded- wire facing)
Rigid Semi-Gravity Walls Reinforced Soil Slopes (RSS) -CIP concrete cantilever T-wall or L-wall
(including counterforted walls and buttressed
walls) Prefabricated Modular Gravity Walls
-Crib wall -Bin wall -Gabion wall -Rockeries
Cut-Constructed Walls (Built from the Top Down)
Externally Stabilized Internally Stabilized Non-Gravity Cantilevered (Embedded) Walls In-situ Reinforced Walls
-Sheet-pile wall (steel, concrete, timber) -Soil-nailed wall -Soldier pile and lagging wall -Micropile walls -Slurry (diaphragm) wall Root-pile wall -Tangent or secant pile walls Insert pile wall -Soil-mixed wall (SMW)
Anchored Walls*
-Ground anchor (tieback) -Deadman anchor
2.2.5 Data Collection Categories
All the highway agencies identified in this study that collects and records ERS information in a database include the following: wall location, retaining wall type, wall function, geometrics, conditions of structure and elements, and the consequence associated with structural failure. For the FHWA-CFLHD’s WIP, 65 different attributes were collected to define, quantify, and assess the different variety of ERSs included in its database [DeMarco, et. al. 2009]. As a result, their database application uses three forms for entering data collected during field inspections. The first form contains general descriptions including the ERS’s location, function, type, age, facings, and surface treatments. The second form is used to enter condition assessment data for each individual wall element. The third form is used to enter action assessment data such as an overall wall condition rating, a wall action status, the consequence of failure, the repair and/or replacement cost, work order descriptions, and repair recommendations [DeMarco, et. al. 2010b].
list of 96 possible ERS attributes. The complete list of data fields used in existing inventory and inspection programs is outlined in Table 2.5.
Table 2.5: ERS Data Attributes [Brutus and Tauber, 2009]
SURVEY LOG DATA LOCATION DATA DIMENSION DATA (GENERAL)
STRUCTURAL DATA (PRELIMINARY)
-ID number* -GPS location coordinates* -Exposed height* -Wall face material*
-Date of survey* -Location* -Total length* -Apparent wall type
-Times of arrival and
departure* -Offset* -Wall face slope* -Wall surface treatment
-Surveyed by* -Location photos* -Total height* -Wall top feature
-Weather* -District/pollital subdivision -Estimated area of exposed face* -Top of wall attachments
-Soil Moisture -End coordinates -Exposed height at beginning point -Wall face attachments
-Work-zone saftey or measures
-Bridge/culvert assocation
-Exposed height at
end point HISTORY AND OWNERSHIP
-Special access equiptment
-Other realted feature
-Height above
retained soil -Year built*
CONDITION DATA
FROM INSPECTION -Access constraints -Upslope angle -New or retrofit*
-Inspection report* -Did constraints affect accuracy? -Downslope angle -Design Service Life*
-Inspection date* -Block and lot
number -Criterion length -Current owner*
-Name of inspector* -Photo(s) of access constraints -Offset of criterion portion -Owner contact information*
-Prior documentation
reviewed* PRIORITYACTION
-Photo(s) of top
profile -Original owner
-Potential failure type* -Action approved* -Roadside features above -Original contract number
-Condition rating* -Action priority* -Roadside features below -Original cost
-Performance rating* -Action date scheduled* -Photos of roadside feature -Original designer -Projected replacement
date* -Action completed* -Original contractor
Table 2.5: Continued [Brutus and Tauber, 2009]
STRUCTURAL DATA
(VERIFIED) FUNCTION DATA
CONDITION DATA (PRELIMINARY)
CONSEQUENCES OF FAILURE FACTORS
-Structral type* -Functional type* -Checklist conditions* -Critical wall height* -Total wall face area* -Supported feature -Inspection priority* -Critical distance* -Estimated replacement
cost per square foot -Protected feature
-Condition photos &
sketches -Roadway type and lanes*
-Cost estimate reference*
-Photo(s) of supported features
-Sensitive facility
supported* -Estimated total
replacement cost*
-Photo(s) of
protected features -Sensitive facility protected*
-Wall face angle as
built* -COF rating*
-Foundation type -Traffic volumes
-Proprietary type -Interchange distances
-Fill material -Utilities near top of wall
-Utilities near base of wall -Utilities on wall face
-Detour length
-Affected locations
*Minimum data that should be collected and stored in the ERS database
2.2.6 Inspection, Condition Assessment, and Rating
distress [DeMarco, et. al. 2010b]. Finally, the elements are rated with a numerical value according to a predetermined rating system. After each individual element is rated, the overall wall rating is determined by a weighted average of all the elemental ratings.
Unlike the FHWA-CFLHD, many agencies don’t have to ability to use qualified inspectors or persons with the required expertise. Unfortunately, due to the cost and time required for these ERS inspections, many agencies resort to using junior engineers and technicians to perform them. As a result, many agencies do not look at individual ratings of wall elements and overall wall performance to establish a final wall rating. Instead, a simple check list is used to assess and determine the overall condition of ERSs.
Table 2.6: Primary/Secondary Wall Elements [DeMarco, et. al. 2010b]
Primary Element Condition Ratings Secondary Element Condition Rating
Piles and Shafts
Soldier piles, sheet piles, micropiles or drilled shafts, as well as supplemental structures such as walers, comprising part or all of the visible wall.
Wall Drains
Function and capacity of visible drain holes, pipes, slot drains, etc., that provide wall subsurface drainage.
Lagging Structural lagging between piles and walers. Architectural Facing
Facing that is not relied on for structural capacity, including concrete, shotcrete, stone, timber, vegetation, etc.
Anchor Heads
All visible parts of tieback anchor, including pad (generally observed without removing cap).
Traffic Barrier/Fence
Traffic barrier or fence above or below wall, and within the influence of the wall.
Wire/Geosyn. Facing Elements
Visible facing or basket wire, soil reinforced elements, hardware cloth, geotextile or geogrids and facing stone.
Road/Sidewalk/ Shoulder
Road and/or sidewalk surface above or below a wall, and within the influence of the wall.
Bin or Crib Visible portion of cellular gravity
wall. Upslope
Groundslope area above a wall affecting wall condition and/or performance.
Concrete
Visible precast or cast-in-place concrete wall and footing elements (does not include piles, lagging, crib blocks, manufactured block or brick, and architectural facing).
Downslope
Groundslope area below the wall, distinct from the Wall Foundation Material element, affecting wall condition and/or performance.
Shotcrete
Visible shotcrete (does not include piles lagging, architectural facing, or
other specific elements). Lateral Slope
Groundslope laterally adjacent to a wall affecting wall condition and/or performance.
Mortar Visible mortar used between uncut or masoned rock, manufactured blocks or
brick, or used for wall repairs. Vegetation
Vegetation near wall or on wall face affecting wall condition and/or performance.
Manufactured Block/Brick
Manufactured blocks and bricks, including CMU’s segmental blocks, large gravity blocks, etc. (does not include concrete lagging or crib wall elements).
Culvert Culvert and inlets/outlets through, below, or adjacent to wall.
Placed Stone Dry-laid or mortar-set uncut rock Curb/Berm/Ditch Lined or unlined surface drainage feature above or below wall. Stone
Masonary Dry-laid or mortar cut rock
Other Secondary Wall Element
Any secondary wall element not listed (provide detailed narrative definition)
Wall Foundation
Material
Soil or rock immediately adjacent to and supporting the wall.
Other Primary Wall
Element
Table 2.7: Earth Retaining Structures Condition Checklist [Brutus, et. al. 2011]
1. Wall or parts of it, out of plumb, tilting or deflecting 2. Bulges or distortion in the wall facing
3. Some elements not fully bearing against load
4. Joints between facing units (panels, bricks, etc.) are misaligned 5. Joints between panels are too wide or too narrow
6. Cracks or spalls in concrete, brick, or stone masonry 7. Missing blocks, bricks, or other facing units
8. Settlement of wall or visible wall elements 9. Settlement behind wall
10. Settlement or heaving in front of wall 11. Displacement of coping or parapet
12. Rust stains of other evidence of corrosion of rebars 13. Damage from vehicle impact
14. Material from upslope rockfall or landslide adding to load on wall 15. Presence of graffiti (slight, moderate, heavy)
16. Drainage channels along top of wall not operating properly 17. Drainage outlets (pipes/weepholes) not operating properly 18. Any excessive ponding of water over backfill
19. Any irrigation or watering of landscape plantings above wall 20. Root penetration of wall facing
21. Trees growing near top of wall
22. Any other observations not listed above
or signs of distress are noted, the inspector then takes a photograph and determines whether further investigation is needed.
The level two inspections are conducted every two to five years to assess and rate the condition of ERSs. The data from these inspections then goes into an asset database to determine final maintenance needs, assess the effectiveness of past maintenance treatments, model and forecast future changes in condition, and estimate future budget requirements. For the level two inspections, the inspector visually inspects the condition of each element using a standard condition rating system and compares the defects observed with past inspection photographs. After the visual inspection, the inspector documents the ERS by taking a new photograph and identifies the structural elements that may need a detailed engineering inspection (level three inspections), closer condition monitoring, or additional testing. If the inspector identifies a potentially hazardous defect during level one or level two inspections and believes further condition assessment is needed, the inspector can request a level three inspection.
Table 2.8: Vic Roads Retaining Wall Inspection Process [VicRoads, 2011]
Level One (Routine Maintenance
Inspection)
Level Two (Road Structure Condition
Inspection)
Level Three (Detailed Engineering
Inspection)
Purpose
To check general serviceability of a structure, particularly for the safety of road users and to identify any emerging problems
To assess and rate the condition of a structure and adjacent roadway and report any significant damage or defects that may require urgent repair or replacement
To undertake specific, detailed structural investigation of a specific component or element of a structure.
Entails
Brief inspection of structural elements – reporting any significant visual signs of damage, distress or unusual behavior
Inspection of road structure elements and an assessment of the condition rating for the structure as a whole using the standard condition rating system.
• Inspection shall start at bottom of structure and continue to the top of the structure
• Inspect and rate each specified element individually
• Compare photos and observations from previous inspections
A variety of tests and inspections may occur depending on the severity and element experiencing the defect.
Recommendation
Determine if structure is in need of a more in-depth and qualified inspection.
Determine if structure is in need of a more in-depth and qualified inspection and nominate elements for closer monitoring if necessary.
Frequency Every 6 Months
Every new structure should be given a Level 2, Road
Structure Condition Inspection within 12 months of opening and thereafter, once every 2-5 years.
As-Needed Basis
Data Sheets
This literature review identified agencies that had an ERS inventory and inspection programs. However, no sufficient information was found to conclusively determine an exact inspection cycle for ERS. Based on the literature, inspection interval can range from 2-7 years. For the Oregon DOT, ERSs that were rated “good” are to be inspected every 5 years while those rated “fair” or “poor” are inspected more frequently. The VicRoads Technical Consulting suggests an inspection cycle of 2 years and the FHWA-CFLHD is considering a 5-7 year inspection cycle.
2.2.7 Rating Scales
The element conditional rating system developed by FHWA-CFLHD consists of a numerical scale from 1-10, where 10 is the best and 1 is the worst. This rating scale uses a detailed condition assessment criterion to ensure each ERS inspection is completed in the most objective manner. The final wall performance rating used to represent the overall wall condition ranges from 5-100. The meaning attributed to each condition rating in the FHWA-CFLHD’s rating system for the NPS is outlined in Table 2.9.
This is especially true as the rating is propagated through the higher level administrative decision makers. Additionally, since there are not any formal rating metrics, inspection standards, or condition assessment measures for ERSs, the types of rating systems used to evaluate ERSs can vary between qualitative assessments and quantitative assessments. A summary of the variation in ratings systems utilized were previously presented in Table 2.1.
Table 2.9: Wall Element Condition Rating Criteria [DeMarco, et. at. 2009]
Element
Condition Rating Rating Definition
9-10 Excellent
No-to-very-low extent of very low distress. Any defects are minor and are within the normal range for newly constructed or fabricated elements. Defects may include those typically caused from fabrication or construction. Ratings of 9-10 are only given to conditions typically seen shortly after wall construction or substantial wall repairs.
7-8 Good
Low-to-moderate extent of low severity distress. Distress present does not significantly compromise the element function, nor is there significant severe distress to major structural elements of an element. Ratings of 7-8 indicate highly functioning wall elements that are only beginning to show the first signs of distress or weathering.
5-6 Fair
High extent of low severity distress and/or low-to-medium extent of medium to high severity distress. Distress present does not compromise element function, but lack of treatment may lead to impaired function and/or elevated risk of element failure in the near term. Ratings of 5-6 indicate functioning wall elements with specific distresses that need to be mitigated in the near-term to avoid significant repairs or element replacement in the longer term.
3-4 Poor
Medium-to-high extent of medium-to-high severity distress. Distress present threatens element function, and strength is obviously compromised and/or structural analysis is warranted. The element condition does not pose an immediate threat to wall stability and closure is not necessary.
Ratings of 3-4 indicate marginally functioning, severely distressed wall elements in jeopardy of failing without element repair or replacement in the near-term.
1-2 Critical
Medium-to-high extent of high severity distress. Element is no longer serving intended function. Element performance is threatening overall stability of the wall at the time of inspection.
For example, the City of Cincinnati uses a numerical rating system with ratings that range from 0-4 [Brutus and Tauber, 2009]. Brutus and Tauber (2009) used a numerical rating system that ranged from 1-7 to survey ERSs for the New York City Department of Transportation. Likewise, the Pennsylvania Department of Transportation and the Nebraska Department of Roads have developed inspection and conditions assessment procedures for MSE walls, which rely on a numerical rating of 2-8 and 0-9 respectively [Jensen, 2009]. Conversely, the Oregon Department of Transportation relies on a three level rating system based on good, fair, or poor condition ratings [Brutus and Tauber, 2009]. The Ohio and Utah Departments of Transportation also use a qualitative assessment method to evaluate the condition of MSE walls. In both of these rating systems, condition assessments are based on a “Yes” or “No” observational evaluation [Gerber, 2012].
Table 2.10: Conditional Rating States and Calculations [VicRoads, 2011]
Conditional Rating States Percentage Calculations
Condition 1: Element is in good condition with little or no deterioration
The number of units making up the element (ex: if 2 out of 10 units are at condition 2, then the rating at condition 2 is 20%)
Condition 2: Element shows minor deterioration: minor cracking & no spalls of real concern
The length of the element (ex: if 2 ft. out of 10 ft.
of an element are at condition 2, then the rating at condition 2 is 20%)
Condition 3: Element shows advanced deterioration and loss of protection to the supporting material: large spalls, medium cracking
The area of the element (ex: if 2 ft2 out of 10ft2 of an element are at condition 2, then the rating at condition 2 is 20%)
Condition 4: Element shows advanced
deterioration and loss of effective section to the primary supporting material or showing signs of distress: very large spalls, heavy cracking
For example, if the facing of a concrete retaining wall is 100 meters long and has a 10 meter crack, 90% of the facing would be considered condition 1 and 10% would be condition 3. The sum of the individual condition percentages assigned to each element has to equal 100%. The approach used in this rating system closely resembles the 1-4 rating system outlined in AASHTO’s “Manual for Bridge Element Inspection” for its bridge element ratings [AASHTO, 2013b].
2.2.8 Action Assessment
recommended actions, the numerical condition ratings of the wall elements, the overall wall rating, the apparent design criteria, and the consequences of wall failure are all taken into consideration. The inspector can then recommend one of the following.
No action is needed
Need to continue monitoring the wall
Maintenance work needs to be performed on the wall
Repair on specific wall elements is needed
Wall elements should be replaced
Figure 2.1: FHWA-CFLHD’s Wall Assessment Procedure [DeMarco, et. at. 2009]
3.0 METHODOLOGY
geographically distributed throughout the state of North Carolina. Various data fields were specified and organized according to key identifiers specific to retaining wall type (such as common description given to the apparent retaining wall type). The data collected was utilized to develop a rating system for quantitative condition assessment of various retaining wall types. Presented in Figure 3.1 are the ten individual tasks pursued in this research study and the process for which each task was executed.
Figure 3.1: Flow Chart of Project Tasks Undertaken
3.1 Review of NCDOT Walls and Identification of Data Fields
A review was conducted to collect and assess ERS characteristics that are deemed to be the most important to NCDOT. Existing NCDOT files and databases were reviewed and compiled. The assistance of NCDOT personnel from the Structures Management and Geotechnical Engineering Units was used to help identify specific ERS data aspects and features that each unit might like to maintain and manipulate using a relational database.
3.1.1 BMS
The NCDOT’s Bridge Management System (BMS) is an asset management system that enables NCDOT to manage current and historical bridge inventory and condition data, and then use those data to recommend an optimal set of projects and treatments. BMS manages bridge inventory and condition data by evaluating the performance and deterioration potential of NCDOT bridges, determining maintenance treatments and their costs, and creating a model for prioritizing maintenance actions.
When evaluating BMS inventory, three bridge elements: deck, superstructure, and substructure, and their corresponding sub-elements, are rated based on their conditions. Bridge inspectors then recommend maintenance treatments based on the condition of bridge elements and sub-elements. The impact of these treatments are then assessed at the project level – by analyzing the impact of maintenance on each specific bridge – and the network level – by analyzing the impact of maintenance across several bridges.
In conjunction with the assessment of maintenance treatments, BMS also determines the lifecycle costs of bridge maintenance. A maintenance activity’s labor hours, equipment, materials, and overall cost is tracked and recorded. This information enables NCDOT to estimate the allocation of resources and budget while preparing maintenance work plans.
BMS offers some maintenance advantages that are transferable to ERSs. A summary of the BMS functions that can also be applied to ERSs are as follows:
Storing inventory and condition data in an integrated database.
Assigning condition ratings based on elemental distresses.
Developing a maintenance action plan based on elemental condition ratings.
Evaluating the impact of maintenance at both the project and network level.
Determining the lifecycle cost based on a maintenance activity’s labor and resources.
3.1.2 HiCAMS
An investigation of NCDOT’s Highway Construction and Material System (HiCAMS) was conducted to determine what its data items are, how the data are collected, and how the data are stored. HiCAMS is a database system used by two primary NCDOT user groups (the Central Construction Unit and the Materials & Test Unit) to help manage major construction projects in North Carolina. The Central Construction Unit is primarily responsible for reviewing contract details and authorizing the contracts for work in HiCAMS. The Materials & Test Unit (M&T) is primarily responsible for setting, maintaining, and enforcing compliance standards for the materials used on construction projects for the State. Collectively, both utilize different functions (data entry, records processing and tracking, reference data retrieval, and reporting) within HiCAMS to effectively monitor and manage ongoing construction work, the control and testing of materials, and the producers and suppliers used in that work. A summary of the systems functionality and capabilities are as follows:
Authorizing and maintaining contract line items for Highway Projects.
Recording construction work via entry of Material Receipts, Pay Records, and Tickets.
Calculating contractor payments based on Work Accomplished (Estimates).
Processing contract changes and adjustments, such as Supplemental Agreements.
Processing and tracking Contractor Claims.
Entering and maintaining reference data on Materials, Producers, and Suppliers.
Entering and maintaining information about Technicians, Technician Certifications, and Certification Courses and Classes.
Entering Material Samples and Field Inspection Data.
Auditing materials, tests, and contractor payments for adherence to standards in support of Project Certification efforts.
With regards to data related to ERSs, the HiCAMS currently stores basic construction data (project number, project location, multimodal investment network (road tier), wall types constructed, wall size, construction cost of walls, and year constructed) for ERSs constructed since the year 2000.
3.2 Field Site Visit (3) Identification of Data Fields
As a result of the three site visits and internal discussions with key NCDOT personnel, it was determined that two separate data collection forms would ultimately be needed for cataloging and assessing the condition of permanent highway ERSs. A discussion on each form is provided in Section 3.4 (Data Collection) of this thesis. Also as a result of these site visits, it is recommended that critical ERSs in distress have LiDAR measurements taken at each inspection visit (or at some other regular period as determined by the agency). For noncritical ERSs, LiDAR measurements should be conducted only if and when an ERS is severely deflecting, rotating, bulging, or settling. The use of LiDAR for inventory assessment and infrastructure health monitoring has been demonstrated in a wide variety of applications and is well-suited for ERSs [Chang, et. al. 2014]. It is also recommend that the inspector takes pictures and provide comments whenever the ERS or is elements are in a poor or severe state of distress.
3.3 Prototype Locations
Carolina and the others were located in the Eastern Region of North Carolina. Presented in Figure 3.2 is a map with the geographical locations of each of the ERSs surveyed throughout the state of North Carolina.
Figure 3.2: Geographical Location of All Field Surveyed ERSs
3.3.1 Western Region
Table 3.1: ERSs Field Surveyed In Western North Carolina
Wall ID County Type Latitude Longitude Location Description
480019 Iredell MSE 35° 34' 47.94" 80° 51' 23.84" West Wall Abutment - SR 1100 (Brawley School Rd) over I-77
480020 Iredell MSE 35° 34' 45.16" 80° 51' 23.05"
Left Wing Wall (West Wall Abutment ) - SR 1100 (Brawley School Rd) over I-77
480021 Iredell MSE 35° 34' 51.22" 80° 51' 24.63" Right Wing Wall (West Wall Abutment) - SR 1100 (Brawley School Rd) over I-77
480022 Iredell MSE 35° 34' 46.48" 80° 51' 21.80" East Wall Abutment - SR 1100 (Brawley School Rd) over I-77
480023 Iredell MSE 35° 34' 49.26" 80° 51' 22.23" Left Wing Wall (East Wall Abutment) - SR 1100 (Brawley School Rd) over I-77
480024 Iredell MSE 35° 34' 44.25" 80° 51' 20.97" Right Wing Wall (East Wall Abutment) - SR 1100 (Brawley School Rd) over I-77
120025 Cabarrus MSE 35° 24' 04.30" 80° 35' 32.09" 380 Corban Ave SW, Concord, NC 28025
480026 Iredell Soil Nail 35° 48' 22.77" 80° 52' 52.52" East Bound on I-40 - East of Radio Rd and West of US 21
790027 Rowan Anchored 35° 41' 43.33" 80° 24' 03.38" East Wall Abutment - SR 2120 (Long Ferry Rd) over I-85
790028 Rowan Anchored 35° 41' 44.35" 80° 24' 04.35" West Wall Abutment - SR 2120 (Long Ferry Rd) over I-85
480029 Iredell Gravity 35° 34' 41.66" 80° 53' 09.35" The Brawley Market - 798 Brawley School Road, Mooresville, NC 28117
120030 Cabarrus Gravity 35° 24' 30.56" 80° 40' 25.05" 5790 Poplar Tent Rd, Concord, NC 28027
A brief summary of the retaining wall types for these 12 ERSs and their function and/or purpose are as follows:
Pilot Location #01: SR 1100 (Brawley School Road) over I-77 2 MSE wall abutments.
Wall ID: 480019 and 480020
4 MSE wing walls.
Constructed with precast concrete panels.
Both abutments support the Brawley School Road bridge (Bridge ID: 70) over I-77 in Iredell County.
Wing walls (parallel to I-77) were constructed to minimize right-of-way and serve as right-of-way support for I-77.
Pilot Location #02: 380 Corban Ave SW, Concord, NC
1 MSE wall.
Wall ID: 120025
Constructed with segmental retaining wall units.
Constructed to minimize right-of-way, encroachment, and permitting.
Pilot Location #03: East Bound on I-40 - East of Radio Road and West of US 21
1 Soil Nail wall.
Wall ID: 480026
Constructed with shotcrete (with an architectural finish).
Constructed to minimize right-of-way and serve as right-of-way support.
Pilot Location #04: SR 2120 (Long Ferry Road) over I-85
2 Anchored walls
Wall ID: 790027 and 790028
Constructed with a cast-in-place concrete facing.
Pilot Location #05: 798 Brawley School Road, Mooresville, NC
1 Gravity wall.
Wall ID: 480029
Construction with segmental retaining wall units.
Constructed to minimize right-of-way and maximize or protect the parking areas below the wall.
Pilot Location #06: 5790 Poplar Tent Rd, Concord, NC 1 Gravity wall.
Wall ID: 120030
Construction with cast-in-place concrete.
Constructed to minimize right-of-way and maximize or protect the parking areas below the wall.
3.3.2 Eastern Region
![Table 2.4: FHWA-CFLHD Classification of Wall Types [Brutus and Tauber, 2009]](https://thumb-us.123doks.com/thumbv2/123dok_us/1420357.1174586/40.612.84.550.171.615/table-fhwa-cflhd-classification-wall-types-brutus-tauber.webp)
![Table 2.5: Continued [Brutus and Tauber, 2009]](https://thumb-us.123doks.com/thumbv2/123dok_us/1420357.1174586/43.612.83.550.150.393/table-continued-brutus-tauber.webp)
![Table 2.6: Primary/Secondary Wall Elements [DeMarco, et. al. 2010b]](https://thumb-us.123doks.com/thumbv2/123dok_us/1420357.1174586/45.612.91.538.156.666/table-primary-secondary-wall-elements-demarco-et-al.webp)
![Table 2.7: Earth Retaining Structures Condition Checklist [Brutus, et. al. 2011]](https://thumb-us.123doks.com/thumbv2/123dok_us/1420357.1174586/46.612.141.493.153.475/table-earth-retaining-structures-condition-checklist-brutus-et.webp)
![Figure 2.1: FHWA-CFLHD’s Wall Assessment Procedure [DeMarco, et. at. 2009]](https://thumb-us.123doks.com/thumbv2/123dok_us/1420357.1174586/54.612.91.540.127.509/figure-fhwa-cflhd-s-wall-assessment-procedure-demarco.webp)