ABSTRACT
KOSKINIEMI, CRAIG BENJAMIN. Development of a 915 MHz Continuous Microwave Process for Pasteurization of Packaged Acidfied Vegetables. (Under the direction of Dr. Van-Den Truong.)
The development of packaged acidified vegetables such as broccoli, red bell pepper, and sweetpotato was studied in order to improve the levels of beneficial phytonutrients compared to traditional pickled cucumbers. In addition, the application of continuous microwave processing to acidified vegetable products could reduce energy usage and water consumption, and thereby improve the sustainability of acidified vegetable production. This research sought to provide a comprehensive examination of: (1) the dielectric properties of acidified vegetables, (2) methods to improve heating uniformity during continuous
microwave processing of packaged acidified vegetables, and (3) the microbial stability and changes in color and texture conferred by the pasteurization process over storage in acidified vegetable packs.
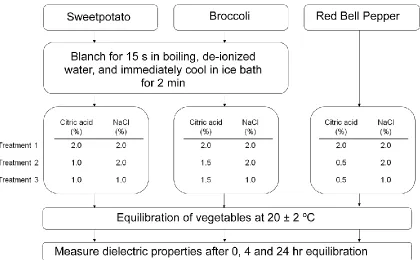
The effects of salt, acid, and equilibration time on the dielectric properties at 915 MHz of acidified broccoli, red bell pepper, and sweetpotato were studied in order to
understand and assist in the design of a continuous microwave heating process. The addition of salt significantly increased the loss factors ( ) among vegetables and was concentration dependent, but did not change the dielectric constants ( ). Citric acid (0.5 – 2.0% w/v) did not significantly influence nor .
placement into a 0% salt cover solution improved heating. Changes in product composition were not enough to overcome the challenge of heating the cold spot to temperatures greater than 74 C, the industry standard for pasteurization of pickled cucumbers. The design and implementation of a cup rotation apparatus improved the heating uniformity in the packages, and pasteurization temperatures greater than 77 C in the liquid and vegetable pieces were obtained during microwave processing.
In part 3, the quality of vegetable packs subjected to continuous microwave
pasteurization was evaluated. After processing, no significant changes were observed in the color of the vegetables, but tissue firmness decreased. Over a two-month storage period, no signs of microbial spoilage were observed. Broccoli, red bell pepper, and sweetpotato softened over storage, but to varying degrees. Broccoli color degraded due to chlorophyll degradation, but much of the brilliant red and orange color of red bell pepper and sweetpotato remained after storage.
Development of a 915 MHz Continuous Microwave Process for Pasteurization of Packaged Acidfied Vegetables
by
Craig Benjamin Koskiniemi
A thesis submitted to the Graduate Faculty of North Carolina State University
in partial fulfillment of the requirements for the degree of
Master of Science
Food Science
Raleigh, North Carolina 2010
APPROVED BY:
_______________________________ ______________________________
Van-Den Truong, Ph.D. Josip Simunovic, Ph.D.
Committee Chair
ii
DEDICATION
iii
BIOGRAPHY
Craig Benjamin Koskiniemi was born October 12, 1984 in Fort Wayne, Indiana to Robert and Shirley Koskiniemi. Craig spent his entire childhood in Fort Wayne growing up with his older brother, Barry. Summer and winter vacations were, and still are on occasion spent enjoying the beautiful Keweenaw Peninsula of Michigan with his family. In high school, Craig’s life was largely consumed by music, playing his beloved
saxophone in every musical ensemble possible. After graduating from Northrop High School in 2003, he attended Purdue University in West Lafayette, Indiana as a food science major from the very beginning.
It did not take long for Craig to realize that food science was the right career choice for him. During his undergraduate career, Craig interned with Cargill Corn Milling in Dayton, Ohio as a quality assurance chemist. While the internship was a great experience, it also served as a motivation to pursue a career more research-based. Craig more seriously considered continuing on to graduate school at the suggestion of one of his professors, Dr. Lisa Mauer. Craig was determined to further his education, but first committed to a six-month internship in product development with the Kellogg Company in Battle Creek, Michigan before beginning his graduate studies at North Carolina State University.
iv
v
ACKNOWLEDGMENTS
First, I would like to thank Dr. Truong for advising me the past two years. I have learned many things, and I have come out of this experience a better scientist, thanks in part to him. I also thank Dr. Josip Simunovic for his infectious enthusiasm for microwave processing. Talking with Josip always left me feeling reinvigorated and excited about my research, not to mention laughing many times. And I thank Dr. McFeeters for his helpful guidance with all things acidified.
I thank all my friends in the department, past and present, who have made my time here much more fun. A special thanks goes out to the dwellers of room 330 for keeping things interesting… you know who you are.
I thank all those who helped me with countless microwave trials in the pilot plant: Prabhat, Christine, Laurie, Leann, and Yvette. I could not have done all of the work by myself, so thank you.
vi
TABLE OF CONTENTS
LIST OF TABLES ... viii
LIST OF FIGURES ... ix
INTRODUCTION ...1
Objectives ...3
CHAPTER 1 – Literature Review ...4
1.1 Processing of acidified vegetables ...4
1.1.2 Pasteurization of acidified vegetables ...5
1.2 Microwave processing technology ...5
1.2.1 Components of a microwave heating system...5
1.2.1.1 Magnetron ...6
1.2.1.2 Waveguide ...7
1.2.1.3 Conveyor-type microwave applicator ...8
1.2.1.4 Choking tunnels ...8
1.2.2 Microwave heating of foods ...9
1.2.2.1 Non-uniform heating ...11
1.2.2.2 Focusing of microwaves ...14
1.3 Dielectric properties ...15
1.3.1 Fundamentals of electromagnetic waves ...15
1.3.2 Dielectric properties of food materials ...15
1.3.2.1 Dielectric constant and loss factor ...16
1.3.2.2 Dielectric heating mechanisms ...18
1.3.3 Factors affecting dielectric properties ...19
1.3.3.1 Frequency effects ...19
1.3.3.2 Temperature effects ...20
1.3.4 Dielectric properties of fruits and vegetables ...21
1.3.4.1 Water and ash content ... 23
1.3.4.2 Chemical composition ...23
1.3.5 Dielectric properties of organic acids ...24
1.3.6 Measurement of dielectric properties ...25
1.4 Color and texture in food quality ...26
vii
1.4.2 Color degradation of vegetables ...27
1.4.3 Texture of fruits and vegetables ...31
1.4.3.1 Tissue structure and components ...31
1.4.3.2 Thermal effects on vegetable texture ...33
REFERENCES ...36
CHAPTER 2 – Effects of Acid, Salt and Equilibration Time on the Dielectric Properties of Acidified Vegetables ...48
2.1 Abstract ...49
2.2 Introduction ...50
2.3 Materials and Methods ... 51
2.4 Results and Discussion ...54
2.5 Conclusions ...59
2.6 References ...60
CHAPTER 3 – Improvement of Heating Uniformity in Packaged Acidified Vegetables Pasteurized with a 915 MHz Continuous Microwave System...71
3.1 Abstract ...72
3.2 Introduction ...73
3.3 Materials and Methods ...76
3.4 Results and Discussion ...81
3.5 Conclusions ...92
3.6 References ...94
CHAPTER 4 – Quality Evaluation of Packaged Acidified Vegetables Subjected to Continuous Microwave Pasteurization... 112
4.1 Abstract ...113
4.2 Introduction ...114
4.3 Materials and Methods ...116
4.4 Results and Discussion ...122
4.5 Conclusions ...133
4.6 References ...135
APPENDICES... 146
Appendix A Dielectric properties of broccoli at 915 MHz... 147
Appendix B Dielectric properties of red bell pepper at 915 MHz... 148
Appendix C Dielectric properties of sweetpotato at 915 MHz... 149
Appendix D Dielectric properties of broccoli at 2450 MHz... 150
Appendix E Dielectric properties of red bell pepper at 2450 MHz... 151
viii
LIST OF TABLES
CHAPTER 2
Table 1 Cover solution compositions and vegetable:solution ratios ...62
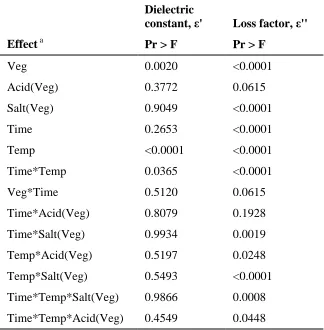
Table 2 Analysis of variance for ε and ε 63
CHAPTER 3
Table 1 Treatment key for acidified broccoli, red bell pepper, and sweetpotato ....96 Table 2 Maximum temperatures of vegetable particles and cover solutions at each measured location ...97 Table 3 Heating rates of vegetable particles and cover solutions at each
measured location ...98 Table 4 Effect of cup arrangement on microwave power efficiency during
Processing ... 99
CHAPTER 4
Table 1 Changes in acid, sugar, and ethanol concentrations in the cover
solutions of pasteurized vegetable packs over a 60 day storage period at 30°C... 137 Table 2 Color values of raw and acidified vegetables after each unit operation and
ix
LIST OF FIGURES
CHAPTER 1
Figure 1 Magnetron schematic. Top view (top) and side view (bottom)... 45 Figure 2 Simplified diagram of indicating the frequencies at which
dielectric loss mechanisms occur for moist materials. Effects of
temperature are also noted (adapted from Tang, 2005)... 46 Figure 3 Dielectric properties of free water as a function of frequency (Adapted
from Ryynanen, 1995)... 47
CHAPTER 2
Figure 1 Diagram of experimental procedure... 64 Figure 2 Dielectric constants (closed symbols) and loss factors
(open symbols) as a function of temperature for broccoli (BROC),
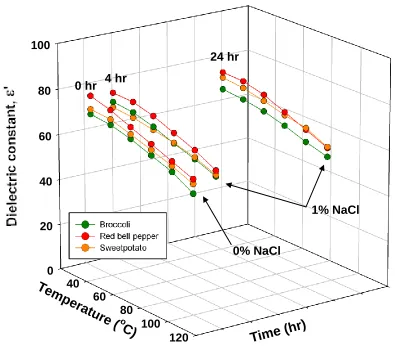
red bell pepper (RBP), and sweetpotato (SP)... 65 Figure 3 Dielectric constants ε of broccoli, red bell pepper and sweetpotato
measured at 915 MHz as functions of temperature and equilibration time (0, 4, and 24 hr) in a 2% NaCl (w/v), 2% citric acid (w/v)
solution... 66 Figure 4 Loss factors ε of broccoli, red bell pepper and sweetpotato measured
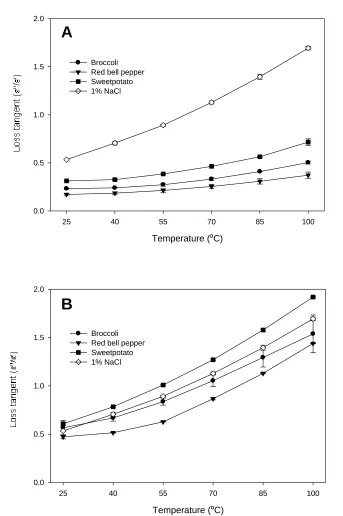
at 915 MHz as functions of temperature and equilibration time (0, 4, and 24 hr) in a 2% NaCl (w/v), 2% citric acid (w/v) solution... 67 Figure 5 Loss tangents of vegetables before (A) and after (B) equilibration
in a 2% NaCl, 2% citric acid cover solution for 24 hr. Loss tangent of 1% NaCl solution is included as a reference. Error bars represent one
standard deviation (n = 2)... 68 Figure 6 Dielectric loss factors ε of broccoli, red bell pepper, and sweetpotato
x
Figure 7 Dielectric loss factors ε of vegetables after 24 hr equilibration in a 2% w/v NaCl solution with varying citric acid concentrations (0.5, 1.0, 1.5,
and 2%)... 70
CHAPTER 3
Figure 1 Simplified schematic of 915 MHz, 5 kW continuous microwave
processing tunnel... 100 Figure 2 Schematic representation of fiber optic temperature probe placement (A),
and picture of fiber optic probe insertion (B). Microwave energy moves from left to right in (A)... 101 Figure 3 Penetration depth of 915 MHz microwaves as a function of temperature
for vegetables and cover solutions. Closed symbols represent unblanched vegetables; open symbols represent blanched, equilibrated vegetables to 1% w/v NaCl... 102 Figure 4 Time-temperature heating profiles (left) and maximum temperature
contour plots (right) during 915 MHz continuous microwave processing: (a) unblanched sweetpotato cubes in 0% NaCl cover solution, (b) unblanched cubes in 1% NaCl cover solution, and (c) blanched, 1% NaCl equilibrated cubes in 0% NaCl cover solution. Error bars represent 1 standard deviation (n = 2). Refer to Figure 2 for locations of A, B, C, D,
and E... 103 Figure 5 Time-temperature heating profiles (left) and maximum temperature
contour plots (right) during 915 MHz continuous microwave processing: (a) unblanched red bell pepper cubes in 0% NaCl cover solution, (b) unblanched cubes in 1% NaCl cover solution, and (c) blanched, 1% NaCl equilibrated cubes in 0% NaCl cover solution. Error bars represent 1 standard deviation (n = 2). Refer to Figure 2 for locations of A, B, C, D,
and E... 104 Figure 6 Time-temperature heating profiles (left) and maximum temperature
contour plots (right) during 915 MHz continuous microwave processing: (a) unblanched broccoli in 0% NaCl cover solution, (b) unblanched broccoli in 1% NaCl cover solution, and (c) blanched, 1% NaCl
equilibrated broccoli in 0% NaCl cover solution. Error bars represent 1 standard deviation (n = 2). Refer to Figure 2 for locations of A, B, C, D,
xi
Figure 7 Schematic of two-stage rotation apparatus: top view (top) and side view (bottom)... 106 Figure 8 Time-temperature heating profiles of bottom locations (D and E) and the
effect of rotation during 915 MHz continuous microwave processing of blanched, 1% NaCl equilibrated vegetables in 0% NaCl cover solution at 3.5 kW: (a) sweetpotato, (b) red bell pepper, and (c) broccoli. Error bars represent 1 standard deviation of at least two replicates. Refer to Figure 2
for locations of D and E... 107 Figure 9 Detailed time-temperature heating profiles of bottom locations (D and E)
during 915 MHz continuous microwave processing of blanched, 1% NaCl equilibrated vegetables in 0% NaCl cover solution at 3.5 kW: (a)
sweetpotato, (b) red bell pepper, and (c) broccoli. Rotation occurs between 1.2 and 1.5 minutes, reversing the initial locations of D and E as shown in Figure 2... 108 Figure 10 Infrared images of food simulant without (A) and with (B) rotation during
915 MHz continuous microwave processing. Microwaves move from left to right... 109 Figure 11 Time-temperature heating profile (left) and contour plot (right) of pre-
equilibrated red bell pepper to 1% NaCl in 0% NaCl cover solution. Error bars represent 1 standard deviation of at least 2 replicates. Refer to Figure 2 for locations of A, B, C, D, and E... 110 Figure 12 Reflected power during 4 kW processing with adjacent cups (top) and 3.5
kW processing with spaced cups and 180° rotation (bottom). Smoothed data is also shown... 111
CHAPTER 4
Figure 1 Infrared thermocouple temperature measurements at fixed points along the length of the microwave tunnel during continuous microwave processing
xii
Figure 2 (A) Fiber optic temperature sensor locations: side view (left) and top view (right). (B) Time-temperature heating profile of pre-equilibrated
sweetpotato to 1% NaCl in 0% NaCl cover solution. Product enters the microwave field at 0 m and exits at 3.3 m. Rotation occurs between 0.2
and 0.4 m (1.2 and 1.5 minutes), reversing the initial locations of D and E. Error bars represent 1 standard deviation of at least 2 replicates... 140 Figure 3 Average surface temperatures of vegetable packs after 915 MHz
continuous microwave processing at 3.5 kW and 180° cup rotation as measured by infrared imaging... 141 Figure 4 Mean temperature and standard deviation of sweetpotato (SP), red bell
pepper (RBP), and broccoli (BROC) packs during a 15 min hold period in an insulating mold after microwave processing (n = 8 for each
vegetable)... 142 Figure 5 Typical texture profiles of sweetpotato, red bell pepper, and broccoli
obtained from the cut test (above profiles are of vegetables 2 days after microwave processing)... 143 Figure 6 Peak forces obtained from the knife-cut test of sweetpotato, red bell
pepper, and broccoli cubes after each unit operation and 60 day storage at 30°C. Different letters within each vegetable denote significant
differences (p < 0.05); error bars represent one standard deviation
(n =10)... 144 Figure 7 Total work required cut through sweetpotato, red bell pepper, and broccoli
cubes after each unit operation and 60 day storage at 30°C. Different letters within each vegetable denote significant differences (p < 0.05);
error bars represent one standard deviation (n = 10)... 145
1
INTRODUCTION
In order to stay competitive in today‘s marketplace, the development of new products and sustainable processes must be explored. This is especially true for the pickle industry, which has not seen much change or growth over the past few decades. To this end, the development of packaged acidified vegetables such as broccoli, red bell pepper, and sweetpotato would improve the levels of beneficial phytonutrients compared to traditional pickled cucumbers, and may open new market opportunities for the pickle industry. Furthermore, the use of acidulants other than acetic acid (vinegar) would expand the possibilities for new products and move away from the ―pickled‖ image. Aside from new products, there is also a need for new pasteurization technologies that would reduce energy costs and water consumption. In contrast to steam pasteurization, which has been used by the pickle industry for over 50 years, microwave processing is a new technology that may provide energy and water savings, and possibly quality
improvements.
The application of microwave processing technology to acidified vegetables pairs one of the newest preservation technologies with one of the oldest. Fermentation of vegetables has been used as a preservation method for at least the past 3,000 years
2
shelf-stable product. This method of acidification which requires pasteurization has been used in the pickle industry since the 1940s.
Recently, the pickle industry has shown an interest in microwave processing technology due to its potential advantages over traditional pasteurization procedures. Some of the potential benefits include: improved product quality, faster processing times, reduced water usage, reduced energy consumption, and bulk storage capabilities. These advantages stem from the efficiency of energy conversion in the product resulting from rapid, volumetric heating. Traditional pasteurization methods require longer heating times since heat is transferred by conduction and convection from outside to inside the food product, oftentimes resulting in overcooked food near the periphery.
3
Objectives
The objectives of this research were:
1) to determine the effects of acid, salt, equilibration time, blanching and temperature on the dielectric properties of broccoli, red bell pepper, and sweetpotato,
2) to develop a continuous microwave pasteurization process for the pasteurization of packaged acidified vegetables through heating uniformity studies, and
4
CHAPTER 1
LITERATURE REVIEW
1.1 Processing of acidified vegetables
Acidified vegetables are classified as acidified foods by the United States Food and Drug Administration (FDA). According to the United States Code of Federal Regulations Title 21 (21CFR), part 114, acidified foods are defined as, ―any low-acid foods to which acid(s) or acid food(s) are added. […] They have a water activity (aW) greater than 0.85 and have a finished equilibrium pH of 4.6 or below‖ (United States Code of Federal Regulations, 2008). Additionally, 21CFR states that,
Acidified foods shall be thermally processed to an extent that is sufficient to destroy the vegetative cells of microorganisms of public health significance and those of nonhealth significance capable of reproducing in the food under the conditions in which the food is stored, distributed, retailed and held by the user. (United States Code of Federal Regulations, 2008)
5
1.1.2 Pasteurization of acidified vegetables
Pasteurization of acidified vegetables serves to destroy all vegetative pathogenic microorganisms, prevent spoilage by lactic acid bacteria and yeasts, and to improve overall keeping quality (Jones et al., 1941; Etchells and Jones, 1942). The majority of heat penetration studies of acidified vegetables have focused on pickled cucumbers (Etchells, 1938; Monroe et al., 1969). The work done in the early 20th century still serves as the industry standard for pasteurization processes. The standard pasteurization process for fresh-pack pickles involves heating the vegetables to 74°C and holding for 15
minutes. Currently, this process is accomplished through the use of steam to heat the product in glass jars by convection. This process consumes a lot of water and is both time and energy intensive. Microwave technology has the potential to heat products more rapidly due to volumetric heating, and thereby reduce processing times and save energy. The efficiency of energy conversion from electromagnetic energy into heat is highly beneficial to thermal processes.
1.2 Microwave processing technology
1.2.1 Components of a microwave heating system
6
1.2.1.1 Magnetron
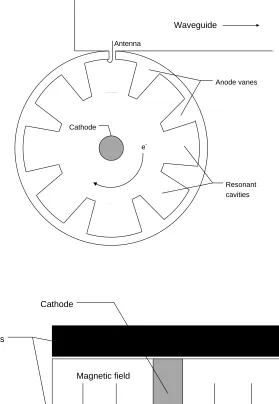
Magnetrons are the most economical, reliable and most widely used source of microwaves (Kitagawa and Kanuma, 1986). There are five main components which make up a magnetron: anode, cathode, resonant cavities, magnets, and an antenna (Figure 1); all of which are enclosed in a vacuum envelope. The cathode consists of a tungsten filament at the center of the anode. When a current is applied, the cathode is heated to a high temperature (~ 1300ºC) and loosely bound valence electrons are emitted from the cathode via thermionic emission (Meredith, 1998). As a result, a strong electric field is created between the cathode and the anode. Instead of a direct path from cathode to anode, the electrons follow a circular path due to the perpendicular magnetic field imposed by the magnets and an electron cloud is created. The resonant cavities serve to interrupt the flow of electrons and impose an oscillation in the electron cloud. The operating frequency of the microwave is determined by the size of the resonating cavities (Thostenson and Chou, 1999). It is of great importance to note that proper cooling of the anode during and after operation is essential to extend the life of the magnetron.
The power (watts) of a plane wave is the product of E (volts per meter)x H
(amperes per meter). In dimensional terms, this relationship is described as the power flux density p (watts per square meter), where E and H are vectors:
p = x watts per square meter (Meredith, 1998) Power output in continuous flow microwave operations is controlled by different
7
in low power (< 15 kW) magnetrons by adjusting the cathode current, whereas high power magnetrons (15 – 100 kW) rely on adjustment of the magnetic field of the magnetron through use of electromagnets (Meredith, 1998). The wave energy is then coupled to the waveguide by an antenna where it is transmitted to the microwave cavity or applicator.
1.2.1.2 Waveguide
Rectangular waveguides made of conducting materials such as aluminum are commonly used in continuous microwave processing due to their efficiency in conveying power with low loss (Meredith, 1998). Proper selection of waveguide dimensions is dependent on the free-space wavelength which is determined by the operating frequency. In order to achieve wave propagation in the TE10 (transverse electric) mode, the width of a rectangular waveguide must be at least half the free-space wavelength, and the resulting aspect ratio is always 2:1 (Meredith, 1998).
The waveguide and microwave applicator used in the work of this thesis was a longitudinal TE10 waveguide. TE mode means that there is no electric field in the direction of wave propagation; i.e. the electric field is perpendicular to the direction of propagation. Furthermore, since the conductivity of the waveguide walls is high, the electric field tangential to the surface Etan, equals 0 (Meredith, 1998). This means that
8
experimentally examined heating profiles of water and porous mediums at different locations in a rectangular waveguide.
1.2.1.3 Conveyor-type microwave applicator
Conveyor-type microwave applicators are typically used in drying,
heating/baking, polymerization, pasteurization, tempering, and thawing processes (Meredith, 1998). The direction of product flow may be concurrent or countercurrent, and is dependent on the type of material being processed. For example, drying operations use countercurrent flow to place the low-loss dry product in the highest field intensity (Meredith, 1998). Concurrent flow is typical for foods where the dielectric properties change with temperature, and the potential for thermal runaway would be increased if exposed to high field intensity at the exit of the conveyor.
When a workload is placed into the applicator, reflections occur and the
electromagnetic field behaves in an unpredictable fashion. In order to reduce reflection, impedances of the load must be matched to the impedance of the waveguide. This is usually accomplished by adjusting a three-stub tuner.
1.2.1.4 Choking tunnels
9
applicator to attenuate, or ―choke‖ the microwaves. Many techniques can be used to attenuate any microwaves that may not have been absorbed by the workload. Reactive or reflective choking is a simple, commonly used method that uses lossless cylindrical posts to create a high reflection coefficient and reflect waves back into the oven (Meredith, 1998). Other methods include lining the choke tunnel with a lossy dielectric, placing a dielectric diffuser to spread leakage over a wide area, using a diode to detect leakage levels and cut off the generator above a set threshold, or implementing a microwave fuse to shut off the generator when the current is interrupted (Meredith, 1998).
1.2.2 Microwave heating of foods
10
Continuous, tunnel-type microwave systems have received little attention with regards to their potential to pasteurize in-pack foods. Previous works (Burfoot et al., 1988) used a tunnel microwave system operating at 896 MHz to pasteurize in-pack spaghetti bolognaise, and to compare experimental heating profiles of mashed potatoes in trays to prediction models (Burfoot et al., 1996). Uniform heating of the spaghetti
bolognaise to at least 80ºC was achieved using 896 MHz, but not 2450 MHz microwaves (Burfoot et al., 1988).
Foods with high salt contents, such as acidified vegetables present difficulties in microwave heating due to dramatically reduced penetration depths. Fresh-pack acidified vegetables such as cucumbers and peppers are typically packed in salt brines to achieve equilibrated salt concentrations in the vegetable tissue at 2-5% (Potts et al., 1986; Daeschel et al., 1990; Passos et al., 2005). While industrial microwave processes utilize 915 MHz microwaves for their relatively high penetration depth, the addition of salt dramatically reduces the penetration depth. When the distance to the center of a material exceeds the penetration depth, the microwave energy is rapidly attenuated, and the food material will not heat volumetrically and surface heating will predominate (Datta and Anantheswaran, 2001).
11
heating time by 50% compared to heating in a water bath and the product had less textural degradation (Lau and Tang, 2002). However, the asparagus was hot-filled at 80 C brine and equilibrated to a temperature of 70 C in a water bath before further heating to 88 C by 915 MHz microwaves. It should also be noted that the study did not include dielectric property information of the asparagus or cover solution containing 1% NaCl. Omission of this information prohibits a thorough understanding of the
electromagnetic energy interactions with the food product.
In the case of food matrices containing solid and liquid phases, the differences in dielectric and thermophysical properties between these phases influence the heating characteristics. A study by Cha-um et al. (2009) examined microwave heating of a saturated porous medium consisting of 0.15 mm glass beads immersed in water.
Inclusion of low loss glass beads increased penetration of microwaves into the water and bead mixture, resulting in higher temperatures at the bottom of the sample. In addition, it was observed that conduction was the predominant mode of heat transfer in the saturated porous medium, while convection prevailed when no beads were in the sample (Cha-um et al., 2009). This research suggests that the pairing of high and low loss materials could produce desirable heating patterns.
1.2.2.1 Non-uniform heating
12
properties, and thermophysical properties are the main intrinsic properties of the food that determine its heating behavior. Dielectric properties of a food material are a principle factor in understanding microwave heating, as these properties characterize how microwave energy will interact with the food. Additionally, thermophysical properties (thermal conductivity, density, specific heat, and thermal diffusivity) of the food components determine how much energy is required to heat a material to a given
temperature, and how fast this phenomenon will occur. Variations in the electromagnetic field are also responsible for non-uniform heating. Kelen et al. (2006) attribute
electromagnetic field variations to cavity effects, which encompasses microwave design, and workload interactions such as the dielectric properties, thickness, shape, and size of the food.
13
added, and surface heating predominated when the salt concentration produced penetration depths less than the radius of the material, usually a cylinder or sphere. However, Zhang et al. (2001) showed that adding salt to ham at 1.6%, an intermediate concentration, could mitigate focusing and surface heating effects to improve heating uniformity during microwave sterilization to 121 ºC at 2450 MHz.
Aside from compositional modifications, the effect of physical movement of foods during microwave processing, such as rotation, to improve heating uniformity has received little attention despite its ubiquitous presence in domestic microwave ovens. A study by Geedipalli et al. (2007) has modeled the effect of rotation and experimentally quantified the improvement in heating uniformity contributed by rotation. The
researchers found that rotation improved heating uniformity by 37-43% when using the coefficient of variance as the quantifiable response. However, it was noted that
14
1.2.2.2 Focusing of microwaves
Focusing of microwaves in foods is responsible for volumetric heating and is largely dependent on their shape and dielectric properties, as well as the microwave frequency and wavelength in the food (Zhang and Datta, 2005a; Zhang and Datta, 2005b). Slabs, spheres, and cylinders have been studied most frequently due to their simplified shape and ability to model the heating behavior and electromagnetic field distributions. It has been shown that these shapes contribute their own geometric effects, which are also a function of their dielectric properties. For example, the corners of slabs are subject to overheating due to the convergence of microwaves from multiple directions (Zhang and Datta, 2001). In the case of spheres and cylinders, focusing can occur when the diameter is approximately 1.5 times the penetration depth (Buffler, 1993; Decareau, 1985).
Zhang and Datta (2005a) have shown the wavelength of microwaves and the penetration depth in the food to be major determinants in understanding the focusing effect in foods. Zhang and Datta (2005a) point out that for most foods, penetration depth is largely dependent on and wavelength of microwaves in the food is dependent on . Microwave focusing can be accurately predicted in spherical foods based on the
wavelength of microwaves in the food (based on dielectric properties) and the size, or radius of the sphere. Contrary to previous work, Zhang and Datta (2005a) found that maximum focusing occurs in spheres when r = 2*Dp., where r is the radius. Lastly, the
15
1.3 Dielectric properties
1.3.1 Fundamentals of electromagnetic waves
Electromagnetic waves are made up of two components, an electric and a magnetic component which are perpendicular to each other. ―Two fundamental
components are necessary for a propagating [electromagnetic] wave to exist: an electric field (E, volts per meter) and a magnetic field (H, amperes per meter)‖ (Meredith, 1998).
When an electromagnetic wave comes in contact with a dielectric material, parts of the wave will be reflected and others will be transmitted through the material. How the wave interacts with the material is dependent on the dielectric properties of the material as well as the angle of the incident waves (Coronel, 2005).
1.3.2 Dielectric properties of food materials
16
1.3.2.1 Dielectric constant and loss factor
The dielectric constant (ε ) describes the ability of a material to store
electromagnetic energy when placed in an electromagnetic field, whereas the dielectric loss factor (ε ), an imaginary quantity, is indicative of the conversion of electromagnetic energy into thermal energy. These two components make up the complex relative permittivity εr, where
εr =ε - jε
and j = 1 . The dielectric loss factor ε is proportional to the amount of thermal energy converted in the food, and seen as a rise in temperature (Schubert and Regier, 2005). The dielectric loss factor takes into account both dipolar rotation and ionic conductivity effects:
ε = ε d + ε = ε d+
0
where subscripts d and refer to contributions from dipolar rotation and ionic
conductivity, respectively. (S m-1) is the ionic conductivity, ε0 is the permittivity of free space (8.854 x 10⁻¹² F m-1), and (rad s-1) is the angular frequency (Tang, 2005). Dipolar rotation is important at high frequencies, whereas ionic conduction prevails at low frequencies (Ryynänen, 1995).
Two other often-used descriptive parameters are the loss tangent and penetration depth. The loss tangent (tan δ) is defined as
17
This parameter is useful in applications where the dielectric constant of a food may change as a function of temperature. In such a case, the loss tangent is a better estimate of power dissipation in the material as it accounts for the dielectric constant, as opposed to only examining the loss factor. A material with a higher loss tangent will heat faster than a material with a lower loss tangent when exposed to microwave radiation at the same frequency. However, to accurately compare heating rates, thermophysical properties (specific heat, density, thermal conductivity) of the materials must be taken into consideration (Gabriel et al., 1998).
Penetration depth (dp) is defined as the distance at which the power drops to 1/e (37%) of its value at the surface of the material, and can be written as
dp =
2 / 1 2 0 1 ' ' ' 1 ' 2 2
where λ0 is the free space wavelength and λ0 = c/f. c is the speed of light (3 x 10⁸ m/s) and f is the frequency of the microwave. From the equation, it is evident that penetration depth is dependent on the dielectric properties of the material as well as the frequency or wavelength of the incident microwave. It follows that increasing the frequency, and thereby decreasing wavelength results in reduced penetration depths.
18
Anantheswaran, 2001). At a distance greater than the penetration depth, conversion of electrical energy into thermal energy is negligible.
1.3.2.2 Dielectric heating mechanisms
Dipolar rotation
Dielectric properties of materials are determined largely by their chemical
composition. Water content is a major determinant of microwave heating. When placed in an oscillating microwave field, the positively and negatively charged regions of the dipole try to align with the changing electrical field. This changing alignment results in intermolecular friction that is dissipated as heat and is known as dipolar rotation or orientation polarization (Ryynänen, 1995). It is important to realize that this heating mechanism is not attributed to a single molecule; rather, it is a bulk phenomenon (Gabriel et al., 1998).
Ionic conduction
19
1.3.3 Factors affecting dielectric properties
Dielectric properties are influenced by both intrinsic properties of a material and extrinsic factors. Chemical composition and structural characteristics of foods are critical factors which influence dielectric properties; especially water and salt contents. Extrinsic factors to the food include frequency and temperature; these factors also influence
dielectric properties of the food, and thus its microwave heating properties.
1.3.3.1 Frequency effects
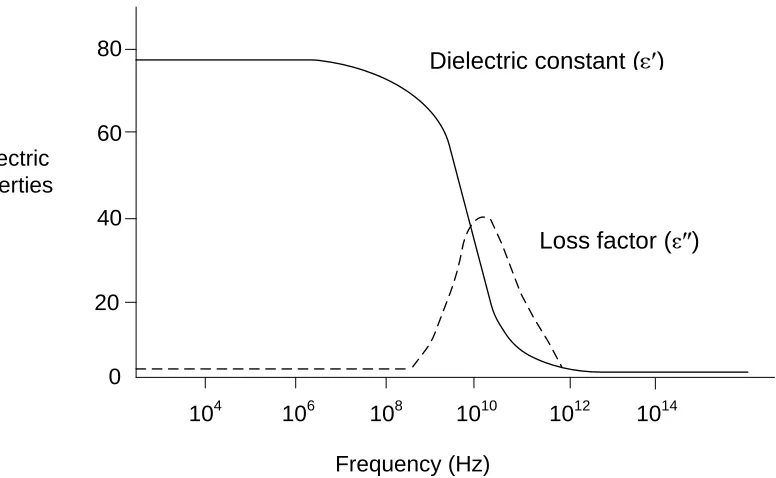
Dielectric properties of a given material change with frequency. Many studies have examined the effect of frequency on the dielectric properties of water and ionic solutions (Hasted et al., 1948; Haggis et al., 1952; Lyashchenko and Zasetsky, 1998), as well as agricultural commodities (Nelson, 2005). At the fundamental level, frequency determines which mechanism of heating predominates: ionic conduction or dipolar rotation (Figure 2). Below microwave frequencies (< 200 MHz), ionic conduction plays a major role. At normal microwave operating frequencies (915 and 2450 MHz), both ionic conduction and polarization mechanisms occur (Tang, 2005). At very high frequencies, the ability of molecules to orient with the rapidly changing field decreases, and therefore both and decrease.
The loss factor of a given molecule peaks when the critical frequency (fc) is reached, and is related to the relaxation time ( ) of the molecule by equation
20
An example is given for water in Figure 3. Generally, larger molecules have longer relaxation times since they are less mobile. Therefore, the critical frequency decreases with increasing molecular size. A major effect that influences dielectric properties of biological materials deals with the state of water. Free water is very mobile with a short relaxation time (0.0071 ns), whereas the mobility of bound water is reduced and
effectively increases the relaxation time, lowering the critical frequency. This becomes important when processing foods with low water activities (more bound water); lower frequencies would be more beneficial in heating.
1.3.3.2 Temperature effects
The effect of temperature on the dielectric properties of food materials is very important for thermal processing of foods and is largely dependent on the composition. The effect of temperature on dielectric properties has been studied for water and model systems such as aqueous solutions with varying salt contents (Hasted et al., 1948), as well as for food products (Tong et al., 1994; Sun et al., 1995; Nelson, 2003; Sipahioglu and Barringer, 2003; Guan et al., 2004; Brinley et al., 2008). Even though food systems are highly complex, the dielectric properties of foods still show good correlations with water, salt and/or ash contents.
21
of the solution ( ), the Boltzmann constant (k), and absolute temperature (T) by the following equation:
= V kT
3
From the equation, it can be seen that as the molecular size and viscosity increase, so does the relaxation time. Increasing the temperature reduces the relaxation time. Since temperature influences molecular relaxation times, temperature also influences the critical frequency (fc = 1/2 ). Increasing the temperature and the resultant reduction of the relaxation time would then shift the peak and critical frequency to a higher
frequency (Tang, 2005). When ions such as Na+ and Cl- are introduced into the system, a positive relationship between temperature and is observed at low frequencies due to the predominant role of ions (Roebuck and Goldblith, 1972). As a result, runaway heating often occurs in high salt foods.
1.3.4 Dielectric properties of fruits and vegetables
22
of fruits and vegetables as functions of temperature, moisture content, ash, density, plant constituents (e.g. starch, pectin, polysaccharides), and combinations thereof.
The dielectric properties of fruits and vegetables have been measured as functions of frequency, also known as dielectric spectroscopy (Nelson et al., 1994; Nelson, 2003; Guo et al. 2007; Nelson et al., 2007). Dielectric spectroscopy provides the advantage of understanding the underlying dielectric heating mechanisms of a material. Nelson (2003) found a low correlation between moisture content and dielectric properties of fruits and vegetables, although generally increased as moisture content increased. The
differences in dielectric properties were attributed to tissue structure, density, and the degree of water binding (Nelson, 2003). Further work by Nelson et al. (2007) which measured the dielectric properties of the external surface and inner tissue of watermelon supported the role of tissue structure. Ionic conduction was observed in the inner tissue, whereas dipolar relaxation predominated near the external surface. The authors
23
1.3.4.1 Water and ash content
Water, salt/ash content, and temperature play major roles in the dielectric
properties—and microwave heating characteristics—of fruits and vegetables. Sipahioglu and Barringer (2003) measured a variety of fruits and vegetables at 2450 MHz and found moisture content to be positively associated with both and . The dielectric constant decreased with temperature for all fruits and vegetables, whereas decreased then increased due to a transition from ionic to dipolar heating mechanisms (Sipahioglu and Barringer, 2003). Increased ash content was associated with higher values of . The findings of Sipahioglu and Barringer were consistent with those of Funebo and Ohlssen (1999), who used density in addition to temperature and moisture content to develop predictive models.
1.3.4.2 Chemical composition
24
theory of Roebuck and Goldblith (1972). Similar to the findings of Ndife were the findings of Brinley et al. (2008) which showed varying dielectric properties of sweet potato purees produced from different cultivars.
Soluble solids such as sugars have also been shown to increase due to their conductive properties. However, this property has not been shown to be a reliable predictor of dielectric properties, and vice versa (Funebo and Ohlssen, 1999; Guo et al., 2007). Pectic substances have been shown to bind water and reduce the dielectric properties of fruits, thereby masking the predicted effect due to sugars (Funebo and Ohlssen, 1999).
Dielectric property prediction models have been developed with varying degrees of success. Accurate models can be produced for specific products, as demonstrated by Brinley et al. (2008) who found moisture, sugar and starch to be the critical factors for dielectric property modeling of sweet potato purees. It is apparent that the complexity and variability of food matrices makes accurate modeling difficult. More dielectric property data are still needed in order to advance the utility of predictive models.
1.3.5 Dielectric properties of organic acids
25
vinegars, as other minor components did not mask the effect of acetic acid. This finding has enabled the use of dielectric spectroscopy to measure the acetic acid content of vinegars up to 10% w/v acetic acid. No data exists in the literature for citric acid, although Marcotte et al. (2000) found no significant contribution of citric acid to electrical conductivity during the ohmic heating of foods.
1.3.6 Measurement of dielectric properties
Open-ended coaxial probe technique
The open-ended coaxial probe technique is a simple and efficient method for dielectric properties measurement of food and other biological materials. This
measurement technique employs the use of a coaxial cable, which is put in contact with the material under test (MUT). The coaxial cable is connected to a network analyzer. When a measurement is triggered, a sine wave signal at a specified frequency is incident on the MUT. Once in contact with the MUT, the wave can be transmitted through the MUT, absorbed by the MUT, and/or reflected by the MUT. Dielectric properties of the material are determined by the phase and amplitude of the reflected signal read by the network analyzer (Venkatesh and Raghavan, 2005).
26
including commercial sterilization temperatures as high as 130 ºC (Guan et al., 2004; Kumar et al., 2007; Brinley et al., 2008).
1.4 Color and texture in food quality
1.4.1 Color measurement systems
Over the course of the 20th century, three tristimulus colorimetry systems have evolved: the CIE system (1931), the Hunter Lab system (1958), and most recently the CIE L*, a*, b* (CIELAB) system (1976). Today, the CIELAB system is most commonly used in the food industry for objective color measurements (MacDougall, 2002). The CIELAB system provides a uniform color space, where lightness is denoted by L*, red/green by a*(+/-), and yellow/blue by b*(+/-). Measurement of these three values produces a distinct coordinate in color space.
Two useful values can be derived from a* and b*: they are hue angle and chroma. Hue angle (H°) is defined as:
H° = tan-1 (b*/a*) when a* > 0 and b* ≥ 0
H° = 180° + tan-1 (b*/a*) when a* < 0
H° = 360° + tan-1 (b*/a*) when a* > 0 and b* < 0
Hue angle refers to the perceived color, whereas chroma (C*) is a measure of the color intensity, where
C* =
27 E =
All of the aforementioned color parameters continue to be useful for quality monitoring of fresh and processed foods.
1.4.2 Color degradation of vegetables
Broccoli
The green color of broccoli and other green vegetables is attributed to the presence of chlorophyll in chloroplasts. Chlorophyll can be degraded by heat, acid, and enzymatic activity (Heaton and Marangoni, 1996). Each of these mechanisms displaces the magnesium ion (Mg++) from the center of the porphyrin ring of chlorophyll, which is replaced by two hydrogen ions (H+), and produces olive-brown pigments called
pheophytins and pheophorbides. This process is generally referred to as
pheophytinization. Regardless of the type of green vegetable under study, green color degradation is related to processes that affect coloring compounds, such as chlorophyll and chlorophyllides (Tijskens et al., 2001a). It follows that an understanding of these processes related to chlorophyll degradation be understood.
28
temperatures with regards to the color of green beans and broccoli. It appeared that the green color described by the ratio of –a*/b* increased as blanching temperature increased from 40 ºC to 90 ºC. However, color increased only within the first minute of blanching and then decreased due to chemical decay and leaching into the blanch water (Tiljskens et al., 2001a). The reason for the increase in green color during the initial stages of
blanching is still controversial. Early work by Mackinney and Weast (1940) and Meyer (1960) postulated that the increase in green color was due to the elimination of
intracellular air and ingress of blanch water and cellular fluids as a result of cell disruption. While this mechanism is widely accepted, others suggest additional or alternative mechanisms such as the conversion of non-colored precursors during blanching as being responsible for brightening of the green color (Tijskens, 2001a).
29
hydrogen ions are available to replace Mg++. It should be noted that increasing the temperature and duration of acid treatment also increases the rate of color change.
The rate of color decay is not solely a function of acid concentration. Gunawan and Barringer (2000) found that the color degradation rate of blanched broccoli was also dependent on the polarity of the acidulant. Poorly soluble benzoic and phthalic acids degraded chlorophyll the fastest, whereas the polar acids consisting of acetic, citric and malic acids degraded the green color at a slower rate. It was postulated that the
hydrophobic nature of benzoic and phthalic acids imparted by their benzene ring components could easily diffuse through the lipid membrane and displace Mg++ with newly dissociated hydrogen ions (Gunawan and Barringer, 2000). It should be noted that diffusion rates of acid into the vegetable tissue were not examined in the study by
Gunawan and Barringer. While color change could be indicative of diffusion rates, equilibration time of the broccoli with the surrounding solution needs to be taken into account.
Red bell pepper
A wide variety of carotenoids are responsible for the color of red bell peppers; however, the major pigments include capsanthin (35%), -carotene (12%), and
30
light, as these promote oxidation of highly unsaturated carotenoids (Minguez-Mosquera and Hornero-Mendez, 1994). The impact of dehydration on peppers has been studied extensively, and the effects of thermal processing to a lesser extent. Interestingly, a recent study noted steady decreases in red color of red bell peppers after fermentation, heating at 85 C for 15 minutes, and subsequent storage for 30 days (Di Cagno et al., 2009).
Sweetpotato
The color of orange sweetpotatoes is attributed to their high -carotene content. Subjecting sweetpotatoes to processes such as heating causes changes in color.
Compared to the color of raw orange sweetpotato flesh, the color after cooking is observed to be a deeper, brighter orange color. The change in color stems from the disruption of chromoplasts during heating. When the cellular structure is damaged,
31
1.4.3 Texture of fruits and vegetables
Texture is a multi-dimensional aspect of foods, and has been defined by Szczesniak (2002) as ―the sensory and functional manifestation of the structural, mechanical, and surface properties of foods detected through the senses of vision, hearing, touch, and kinesthetics‖. With respect to fruits and vegetables, texture is one of the most important quality attributes (Waldron, 2004). Maintenance of acceptable texture is a veritable challenge in that texture is an ever-changing property during maturation, post-harvest handling, processing, and storage. In order to control changes in texture, it is important to understand the underlying processes and properties of fruits and
vegetables responsible for texture.
1.4.3.1 Tissue structure and components
Van Dijk and Tijskens (2000) attributed texture to the following processes and mechanisms:
1. turgor pressure inside intact living cells and the associated tissue tension, 2. special compounds inside cells possibly generating strength (e.g. starch), 3. cohesive forces within a cell: chemical properties of the cell wall,
4. adhesive forces between cells: chemical properties of the pectin, 5. overall structure and shape of separate cells,
6. overall structure and shape of tissue: strength and distribution of stronger shaped vascular tissue. (Van Dijk and Tijskens, 2000)
Changes in texture can result from changes to any of these physical or chemical
32
contain at least one vesicle responsible for turgor pressure, as well as cytoplasm, a plasma membrane, cell wall, and middle lamella (Van Buggenhout et al., 2009). It follows that the composition of parenchyma cells plays a major role in the perceived texture of fruits and vegetables.
The cell walls of parenchyma cells primarily consist of an inter-woven cellulose-hemicellulose matrix, with a small amount of pectin (~ 30% dry weight) (Van
Buggenhout et al., 2009). The middle lamella can be thought of as an extension of the cell wall and primarily consists of pectic material. Cross-linking of pectin between the middle lamellae of adjacent cells is responsible for cellular adhesion, and is a major contributor of tissue strength in addition to cell wall strength imparted by the cellulose-hemicellulose matrix (Van Dijk and Tijskens, 2000). The molecular structure of pectin is very complex. Pectin molecules may contain several domains, although
homogalacturonan (HG) and rhamnogalacturonan (RG) are the most predominate regions (Van Buggenhout et al., 2009). HG is the simplest and most useful pectin, which has been reflected by the amount of research focused on HG and its industrial use as a texturizing and/or gelling agent (Duvetter et al., 2009). HG is a linear chain polymer of
-1,4-linked D-galacturonans and up to 70 – 80% of carboxyl groups may be methyl-esterified (Van Buggenhout et al., 2009). It is in fact the degree of esterification (DE) of pectin molecules in the middle lamella that dictates the adhesive strength between cells.
33
endogenous to plants (Duvetter et al., 2009). PME functions by hydrolyzing methyl esters from O6 of galacturonic acid in HG, and releasing methanol and H3O+.
Oftentimes, the action of PME is beneficial to maintenance of vegetable texture. The demethoxylation process aids in the removal of bulky methyl ester groups, and thereby facilitates the association and crosslinking of HG chains. PME is heat labile, although its optimum activity range is usually between 50 and 65°C. This trait has been exploited by the use of low temperature blanching to increase tissue firmness of vegetables (Truong et al., 1998; Anthon et al., 2005; Ni et al., 2005; Abu-Ghannam and Crowley, 2006).
Contrary to the beneficial effects of PME on vegetable firmness, PG activity can be detrimental to vegetable texture. PG acts on HG by hydrolysis of the -1,4-D
galacturonan linkages, resulting in shorter HG chains. Reduction in the degree of polymerization breaks up the pectin network, reducing intercellular adhesion, and therefore increasing tissue softening.
1.4.3.2 Thermal effects on vegetable texture
The application of heat to vegetables is closely linked to the endogenous enzymatic activity.
Broccoli
34
were highest after 10 minutes of cooking. Cooking at 80 and 100ºC decreased the peak force, which decreased further as cooking time increased to 60 minutes. Precooking the broccoli at 50ºC for 10 minutes prior to cooking for 8 minutes in boiling water increased the relative peak force to 120% of its raw value. This phenomenon was likely due to the well-documented increased activity of pectin methylesterase (PME) at moderate
temperatures (45-60ºC) which de-esterifies pectin, leaving more carboxyl groups to be bridged by calcium ions, and increase tissue strength.
Red bell pepper
As it relates to acidified red bell peppers, there is limited information on the effects of pasteurization treatments on texture. The effect of pasteurization on the texture of brined cherry peppers and jalapeno peppers was previously studied by Fleming et al. (1993), but not for red bell peppers. Fleming et al. (1993) found that pepper firmness decreased after pasteurization; however, no decrease in firmness was observed after pasteurization when calcium chloride was added. In fact, more studies have focused on the effects of blanch pretreatments (Papageorge et al., 2003; Ni et al., 2005) and the effects of pH and chemical addition (Papageorge et al., 2003; McFeeters et al., 2004) on the texture of red bell pepper. Firmness was best retained when blanched at 75 C for 3 minutes and the final pH was in the range 3.4 -3.8. Below pH 3.4, firmness was
35
to accelerate softening, but was inhibited when sulfite was added (McFeeters et al., 2004).
Sweetpotato
36
REFERENCES
Abu-Ghannam, N., Crowley, H. 2006. The effect of low temperature blanching on the texture of whole processed new potatoes. Journal of Food Engineering, 74:335-344. Anthon, G.E., Blot, L., Barrett, D.M. 2005. Improved firmness in calcified diced tomatoes by temperature activation of pectin methylesterase. Journal of Food Science, 70(5):C342-C347.
Barrett, D.M., Garcia, E.L., Russell, G.F., Ramirez, E., Shirazi, A. 2000. Blanch time and cultivar effects on quality of frozen and stored corn and broccoli. Journal of Food Science, 65(3):534-540.
Bohigas, X., Tejada, J. 2009. Dielectric properties of acetic acid and vinegar in the microwave frequencies range 1-20 GHz. Journal of Food Engineering, 94:46-51.
Breidt Jr., F., Costilow, R.N. 2004. Processing and safety. In: Fleming HP, Costilow RN. Acidified Foods: Principles of Handling and Preservation. St. Charles, IL: Pickle
Packers International, Inc.
Brinley, T.A., Truong, V.D., Coronel, P., Simunovic, J., and Sandeep, K.P. 2008. Dielectric properties of sweet potato purees at 915 MHz as affected by temperature and composition. International Journal of Food Properties, 11:158-172.
Buffler, C.R. 1993. Microwave Cooking and Processing. New York, USA: Van Nostrand Reinhold.
Burfoot, D., Griffin, W.J., James, S.J. 1988. Microwave pasteurisation of prepared meals. Journal of Food Engineering 8:145-156.
Burfoot, D., Railton, C.J., Foster, A.M., Reavell SR. 1996. Modelling the pasteurisation of prepared meals with microwaves at 896 MHz. Journal of Food Engineering. 30:117-133.
Cha-um, W., Rattanadecho, P., and Pakdee, W. 2009. Experimental analysis of
microwave heating of dielectric materials using a rectangular waveguide (MODE: TE10) (Case study: Water layer and saturated porous medium). Experimental Thermal and Fluid Science 33:472-481.
37
Coronel, P. 2005. Continuous flow processing of foods using cylindrical applicator microwave systems operating at 915 MHz [PhD dissertation]. Raleigh, NC: North Carolina State University. 187 p.
Coronel, P., Truong, V.D., Simunovic, J., Sandeep, K.P., Cartwright, G.D. 2005. Aseptic processing of sweetpotato purees using a continuous flow microwave system. Journal of Food Science,70(9):531-536.
Costa, M.L., Civello, P.M., Chaves, A.R., Martinez, G.A. 2005. Effect of ethephon and 6-benzylaminopurine on chlorophyll degrading enzymes and a peroxidase-linked
chlorophyll bleaching during post-harvest senescence of broccoli (Brassica oleracea L.) at 20 ºC. Postharvest Biology and Technology, 35:191-199.
Curl, A.L. 1962. The carotenoids of red bell peppers. J. Agric. Food Chem., 10(6):504-509.
Daeschel, M.A., Fleming, H.P., Pharr, D.M. 1990. Acidification of brined cherry peppers. J Food Sci 55(1):186-192.
Datta, A. K., Anantheswaran, R. C. 2001. Handbook of microwave technology for food applications. New York, USA: Marcel Dekker.
Decareau, R.V. 1985. Microwaves in the Food Processing Industry. New York, USA: Academic Press, Inc.
Di Cagno, R., Surico, R.F., Minervini, G., De Angelis, M., Rizzello, C.G., Gobbetti, M. 2009. Use of autochthonous starters to ferment red and yellow peppers (Capsicum annuum L.) to be stored at room temperature. International Journal of Food Microbiology, 130:108-116.
Duvetter, T., Sila, D.N., Van Buggenhout, S., Jolie, R., Van Loey, A., Hendrickx, M. 2009. Pectins in processed fruit and vegetables: Part I-Stability and catalytic activity of pectinases. Comprehensive Reviews in Food Science and Food Safety, 8:75-85.
Etchells, J.L. 1938. Rate of heat penetration during the pasteurization of cucumber pickle. Fruit Products Journal, 18(3):68-70.
38
Fernández, P.P., Préstamo, G., Otero, L., Sanz, P.D. 2006. Assessment of cell damage in high-pressure-shift frozen broccoli: comparison with market samples. Eur Food Res Technol, 224:101-107.
Gabriel, C., Gabriel, S., Grant, E.H., Halsted, B.S.J., Mingos, D.M.P. 1998. Dielectric parameters relevant to microwave dielectric heating. Chemical Society Reviews. 27:213-223.
Geedipalli, S.S.R., Rakesh, V., Datta, A.K. 2007. Modeling the heating uniformity contributed by a rotating turntable in microwave ovens. Journal of Food Engineering 82:359-369.
Guan, D., Cheng, M., Wang, Y., and Tang, J. 2004. Dielectric properties of mashed potatoes relevant to microwave and radio-frequency pasteurization and sterilization processes. Journal of Food Science. 69(1):FEP30-FEP37.
Guo, W-C, Nelson, S.O., Trabelsi, S., Kays, S.J. 2007. 10-1800-MHz dielectric properties of fresh apples during storage. Journal of Food Engineering, 83:562-569. Haggis, G.H., Hasted, J.B., Buchanan, T.J. 1952. The dielectric properties of water in solutions. Journal of Chemical Physics, 20(9):1452-1465.
Hasted, J.B., Ritson, D.M., Collie, C.H. 1948. Dielectric properties of aqueous ionic solutions. Parts I and II. Journal of Chemical Physics, 16(1):1-21.
Heaton, J.W., Marangoni, A.G. 1996. Chlorophyll degradation in processed foods and senescent plant tissues. Trends in Food Science and Technology, 7:8-15.
Hutkins, R.W. 2006. Fermented Vegetables. In: Microbiology and Technology of Fermented Foods. Hutkins, R.W. (ed.) Ames, Iowa: Blackwell Publishing.
Jacobssen, A., Nielsen, T., Sjöholm, I. 2004. Effects of type of packaging material on shelf-life of fresh broccoli by means of changes in weight, color and texture. Eur Food Res Technol, 218:157-163.
Jones, I.D., Ethcells, J.L., Veldhuis, M.K., Veerhoff, O. 1941. Pasteurization of genuine dill pickles. Fruit Products Journal, 20(10):304-305,316,325.
39
Kelen, A., Ress, S., Nagy, T., Pallai, E., Pintye-Hodi, K. 2006. Mapping temperature distribution in pharmaceutical microwave vacuum drying. Powder Technology, 162(2):133-137.
Kitagawa, K., Kanuma, Y. 1986. The reliability of magnetrons for microwave ovens. Journal of Microwave Power, 21(13):149–158.
Kumar, P., Coronel, P., Simunovic, J., Truong, V.D., and Sandeep, K.P. 2007. Measurement of dielectric properties of pumpable food materials under
static and continuous flow conditions. Journal of Food Science. 72(4):E177-E183. Lau MH, Tang J. 2002. Pasteurization of pickled asparagus using 915 MHz microwaves. Journal of Food Engineering 51:283-290.
Lin, C-H., Chang, C-Y. 2005. Textural change and antioxidant properties of broccoli under different cooking treatments. Food Chemistry, 90:9-15.
Lobo, S., Datta, A.K. 1998. Characterization of spatial non-uniformity in microwave reheating of high loss foods. Journal of Microwave Power and Electromagnetic Energy 33(3):158-166.
Lu, R., Abbott, J.A. 2004. Force/deformation techniques for measuring texture. In: Kilcast, D. (editor). Texture in food Volume 2: Solid foods. Cambridge, England: Woodhead Publishing Limited.
Lyashchenko, A.K., Zasetsky, A.Y. 1998. Complex dielectric permittivity and relaxation parameters of concentrated aqueous electrolyte solutions in millimeter and centimeter wavelength ranges. Journal of Molecular Liquids, 77:61-75.
MacDougall, D.B. 2002. Colour measurement of food. In: MacDougall, D.B. (ed.). Colour in Food: Improving Quality. Boca Raton, FL: CRC Press, LLC.
Mackinney, G., Joslyn, M.A. 1940a. The conversion of chlorophyll to pheophytin. J. Am. Chem. Soc. 61(1):231-232.
Mackinney, G., Weast, C.A. 1940b. Color changes in green vegetables. Industrial and Engineering Chemistry. 32(3):392-395.
40
Matile, P., Hortensteiner, S. 1999. Chlorophyll degradation. Annu. Rev. Plant Physiol. Plant Mol. Biol. 50:67-95.
Meredith, R. 1998. Engineers‘ Handbook of Industrial Microwave Heating. Exeter, England: The Institution of Electrical Engineers, London. 363 p.
Metaxas, A. C., Meredith, R. J. 1993. Industrial microwave heating. IEE Power Engineering series 4. London, UK: Peter Peregrinus, LTD.
Miglio, C., Chiavaro, E., Visconti, A., Fogliano, V., Pellegrini, N. 2008. Effects of different cooking methods on nutritional and physicochemical characteristics of selected vegetables. Journal of Agricultural and Food Chemistry, 56:139-147.
Minguez-Mosquera, M.I. and Hornero-Mendez, D. 1994. Comparative study of the effect of paprika processing on the carotenoids in peppers (Capsicum annuum) of the
Bola and Agridulce varieties. J. Agric. Food Chem., 42:1555-1560.
Monroe, R.J., Ethcells, J.L., Pacilio, J.C., Borg, A.F., Wallace, D.H., Rogers, M.P., Turney, L.J., Schoene, E.S. 1969. Influence of various acidities and pasteurizing temperatures on the keeping quality of fresh-pack dill pickles. Food Technology, 23(1):71-77.
Ndife, M.K., Sumnu, G., Bayindirli, L. 1998. Dielectric properties of six different species of starch at 2450 MHz. Food Research International, 31(1):43-52.
Nelson, S.O., Forbus Jr., W., Lawrence, K. 1994. Permittivities of fresh fruits and vegetables at 0.2 to 20 GHz. Journal of Microwave Power and Electromagnetic Energy, 29(2):81-93.
Nelson, S.O. 2003. Frequency- and Temperature-dependent permittivities of fresh fruits and vegetables from 0.01 to 1.8 GHz. Transactions of the ASAE, 46(2):567-574.
Nelson, S.O., Guo, W-C, Trabelsi, S., Kays, S.J. 2007. Dielectric spectroscopy of watermelons for quality sensing. Measurement Science and Technology, 18:1887-1892. Ni, H., Datta, A.K., Parmeswar, R. 1999. Moisture loss as related to heating uniformity in microwave processing of solid foods. Journal of Food Process Engineering, 22:367-382.
41
Oliveria, M.E.C., Franca, A.S. 2002. Microwave heating of foodstuffs. Journal of Food Engineering, 53:347-359.
Potts, E.A., Fleming, H.P., McFeeters, R.F., Guinnup, D.E. 1986. Equilibration of solutes in nonfermenting, brining pickling cucumbers. J Food Sci 51(2):434-439. Purcell, A.E., Walter, Jr., W.M., Thompkins, W.T. 1969. Relationship of vegetable color to physical state of carotenes. J Agric. Food Chem., 17(1):41-42.
Rakesh, V., Datta, A.K., Amin, M.H.G., Hall, L.D. 2009. Heating uniformity and rates in a domestic combination microwave oven. Journal of Food Process Engineering 32(3):398-424.
Roebuck, B.D., Goldblith, S.A. 1972. Dielectric properties of carbohydrate-water mixtures at microwave frequencies. Journal of Food Science, 37:199-204.
Ryynänen, S. 1995. The electromagnetic properties of food materials: A review of the basic principles. Journal of Food Engineering. 24:409-429.
Ryynänen, S., Ohlsson, T. 1996. Microwave heating uniformity of ready meals as affected by placement, composition, and geometry. Journal of Food Science 61(3):620-624.
Sakai, N., Wang, C. 2004. An analysis of temperature distribution in microwave heating of foods with non-uniform dielectric properties. Journal of Chemical Engineering of Japan, 37(7):858-862.
Sarang, S., Sastry, S.K., Gaines, J., Yang, T.C.S., Dunne, P. 2007. Product formulation for ohmic heating: Blanching as a pretreatment method to improve uniformity in heating of solid-liquid food mixtures. Journal of Food Science, 72(5):227-234.
Serrano, M., Martinez-Romero, D., Guillen, F., Castillo, S., Valero, D. 2006.
Maintenance of broccoli quality and functional properties during cold storage as affected by modified atmosphere packaging. Postharvest Biology and Technology, 39(1):61-68. Shin, S., Bhowmik, S.R. 1994. Thermal kinetics of color changes in pea puree. Journal of Food Engineering, 24:77-86.
42
Sun, E., Datta, A., Lobo, S. 1995. Composition-based prediction of dielectric properties of foods. Journal of Microwave Power and Electromagnetic Energy, 30(4):205-212. Sun T, Tang J, Powers JR. 2007. Antioxidant activity and quality of asparagus as affected by microwave-circulated water combination and conventional sterilization. Journal of Food Chemistry 100:813-819.
Szczesniak, A., Humbaugh, P.R., Block, H.W. 1970. Behavior of different foods in the standard shear compression cell of the shear press and the effect of sample weight on peak area and maximum force. Journal of Texture Studies, 1:356-378.
Szczesniak, A.S. 2002. Texture is a sensory property. Food Quality and Preference, 13(4):215-225.
Tang, J. 2005. Dielectric Properties of Foods. In: Schubert, H., Regier, M (eds.). The microwave processing of foods. Boca Raton: CRC Press. p. 22-40.
Tijskens, L.M.M., Schijvens, E.P.H.M., Biekman, E.S.A. 2001a. Modelling the change in colour of broccoli and green beans during blanching. Innovative Food Science & Emerging Technologies, 2(4):303-313.
Tijskens, L.M.M., Barringer, S.A., Biekman, E.S.A. 2001b. Modelling the effect of pH on the colour degradation of blanched broccoli. Innovative Food Science & Emerging Technologies, 2:315-322.
Thostenson, E.T., Chou, T-W. 1999. Microwave processing: fundamentals and applications. Composites Part A, 30:1055-1071.
Tong, C.H., Lentz, R.R., Rossen, J.L. 1994. Dielectric properties of pea puree at 915 MHz and 2450 MHz as a function of temperature. Journal of Food Science, 59(1):121-122.
Truong, V.D., Walter, Jr., W.M., Blett, K.L. 1998. Textural properties and sensory quality of processed sweetpotatoes as affected by low temperature blanching. Journal of Food Science, 63(4):739-743.
Turkmen, N., Poyrazoglu, E.S., Sari, F., Velioglu, Y.S. 2006. Effects of cooking