University of Windsor University of Windsor
Scholarship at UWindsor
Scholarship at UWindsor
Electronic Theses and Dissertations Theses, Dissertations, and Major Papers
1-1-1963
Paramagnetic resonance in solids.
Paramagnetic resonance in solids.
John W. Carswell
University of Windsor
Follow this and additional works at: https://scholar.uwindsor.ca/etd
Recommended Citation Recommended Citation
Carswell, John W., "Paramagnetic resonance in solids." (1963). Electronic Theses and Dissertations. 6324.
https://scholar.uwindsor.ca/etd/6324
PARAMAGNETIC RESONANCE. IN SOLIDS
BY
JOHN W* CARSWELL
A Thesis
Submitted to the Faculty of Graduate Studies through the Department of Physics in Partial Fulfillment
of the Requirements for the Degree of Master of Science at Assumption
University of Windsor
Windsor, Ontario
UMI Number: EC52503
INFORMATION TO USERS
The quality of this reproduction is dependent upon the quality of the copy
submitted. Broken or indistinct print, colored or poor quality illustrations and
photographs, print bleed-through, substandard margins, and improper
alignment can adversely affect reproduction.
In the unlikely event that the author did not send a complete manuscript
and there are missing pages, these will be noted. Also, if unauthorized
copyright material had to be removed, a note will indicate the deletion.
®
UMI
UMI Microform EC52503Copyright 2008 by ProQuest LLC.
All rights reserved. This microform edition is protected against
unauthorized copying under Title 17, United States Code.
ProQuest LLC 789 E. Eisenhower Parkway
/ H Y
6r7l
Approved
Al
i l-U-J-g.
Dr.-N.E. ffedgecock
Dr N. Kalra
Dr. F.- HoluJ Dr. F., Holuj *
(Supervisor)
ABSTRACT
In this paper our study was twofold. One, we investig
ated the effect of x-rays on a single crystal of calcite
(CaCO^) by means of paramagnetic resonance techniques at
liquid air temperatures.. Two., we investigated the paramagnetic
impurities in a single crystal of spodumene ( L i A K S i O ^ J p ) *
In the investigation of calcite we irradiated the cal
cite with the most intense and the strongest x-rays avail
able for periods of at least 10 hours at room temperatures*.
We were looking for the creation of paramagnetic centers in
the single crystals of calcite. Our results for calcite
were negative; there \/as no observed spectrum produced by
x-ray irradiation. We have been able to state a number of
reasons for this negative result. First, there were no para
magnetic centers produced; hence there would not be any spec
tra observed. Second, if there were paramagnetic centers pro
duced it was possible that the relaxation time for the spin
system was not sufficiently long, consequently the resonance
line would be very broad and thus it would be obscured. Third,
it was possible that the Zeeman sublevels were not adequately
populated to give an observable effect.
The work done on spodumene has produced a number of re
sults. First, there was observed a spectrum and it was at
tributed to the Fe+^ ion. Second, one line of the spectrum
has been analyzed and it was thought to be due to the -1/2
to 1/2 transition. Third, the principal values of the g-fac-
tor for axial symmetry were found to be
gA = 3*619 and gw = 1.960
Fourth, there was also observed in the iron paramagnetic
spectrum a hyperfine structure produced by the interaction
of the nuclear magnetic moments of aluminium and lithium
ACKNOWLEDGMENTS
I would like to express my appreciation to Dr, F. Holuj
for tiie suggestion of the problem, for the helpful supervis
ion of my work and the aid offered me in the preparation of
the thesis. Also I am grateful to Mr. V/. Grewe for the con
struction of the precision goniometer and the liquid air cry-
TABLE OF CONTENTS
Page
ABSTRACT ii
ACKNOWLEDGEMENTS iv
Chapter
I. INTRODUCTION 1
II., THEORY 6
III *. ■ APPARATUS 17
IV. EXPERIMENTAL PROCEDURE AND RESULTS k3
V. CONCLUSIONS 56
BIBLIOGRAPHY 58
LIST OF TABLES
TcilDl©
1. DATA OF THE RESONANCE LINE FOR THE X, Y, AND Z ORIENTATIONS
LIST OF ILLUSTRATIONS
Page
Figure
1. SIXFOLD TETRAGONAL SYMMETRY (Chap, II) 11
2. THE SPLITTING OF THE GROUND STATE IN A CUBIC FIELD 13
3. SPLITTING IN A TETRAGONAL FIELD 13
1. ELECTRON SPIN SPECTROMETER (Chap. Ill) 18
2. 30 Mc/s AMPLIFIER M D DETECTOR 20
3* 200 c/s AMPLIFIER 22
b. LOCK-IN DETECTOR 23
5*- 30 Mc/s AMPLIFIER 25
6. PHASE DETECTOR 25
7. 10k c/s AMPLIFIER 26
8. PHASE DETECTOR 28
9. 10k c/s OSCILLATOR 29
10. KLYSTRON POWER SUPPLY 31
11. 200 c/s OSCILLATOR 33
12. POWER AMPLIFIER ?>b
13. ENVELOPE OF CRYOSTAT 36
lb. CRYOSTAT 37
15. CAVITIES 39
16. PROJECTION OF UNIT CELL OF SPODUMENE b Q
17. ANGULAR VARIATION OF A SINGLE RESONANCE LINE 51
I
INTRODUCTION
Paramagnetic resonance, also known as electron-spin
resonance, was first observed by Zavoisky in 19*+5» Using
a radio-frequency field at 2? meters, he induced magnetic
dipole transitions among electronic Zeeman levels in a
paramagnetic center. The line widths were $0 gauss or lar
ger, and consequently a resonance line was scarcely discern
ible at such a low frequency. This corresponded to a reson
ance peak at h gauss. In Zavoisky's second series of exper
iments he found a resonance line for the paramagnetic cop-
per ion, Cu , at 4-7.7 gauss by using a frequency of 133
Mc/s. The paramagnetic copper ion in CuC^* gave a g—
factor of two. Finally Zavoisky conducted experiments in
the microwave region and observed clearly resolved resonan
ce lines of 200 to 300 gauss in width, while using a steady
magnetic field of one kilogauss. In the U.S.A., R. L. Cum-
merow and D. Halliday observed well resolved resonance lines
of the paramagntic ion manganese in 173 grams of MnSO^* ^I^O*
They used a microwave resonance cavity excited at 2,930 Mc/s.
In 19*+7 at the Claredon Laboratory, Bagguley and Griffiths
observed the resonances of the paramagnetic ion of chromium
in a chrome alum crystal, KCr(S0q.)2" 12H20, at 3.18 cm.
aequently, much work was done in the field of paramagnetic
resonance* The experimental techniques and apparatus were
perfected by the Oxford group, headed by Bleaney and Grif
fiths, while the work of Pryce and his co-workers advanoed
the theoretical understanding of the subject*
There are a number of different instances wherein elec
tronic paramagnetism occurs. They are as follows! (1) in
all atoms having an odd number of electrons, such as in
atomic hydrogen) (2) in ions having partly filled inner
electronic shells as in the transition groups) (3) in mol-
eoules having an odd number of electrons, such as in NO)
(It) in a small number of molecules with an even number of
electrons but having a resultant orbital angular momentum,
as in Ogj (5) in free radicals, possessing an unpaired elec
tron, as in CH^* (6) Also unpaired eleotrons can be pro**
duoed in solutions or solids by irradiation with light,
x-rays, K-rays or with energetio particles*
The energy of a free paramagnetic ion placed in an ex
ternal magnetic field If and possessing a magnetic moment/T
and a resultant angular momentum T isi E e (1)
This formula expresses the energy due to the action of a
torque caused by H on the magnetic momentum vector*. Ac-
cording to quantum mechanics, the vector J acted on by a
strong magnetic field is quantized along the magnetic field
direction* The components of j along the magnetic field
We can also write down the magnetic moment:
(
2
)
Here g is called the g-factor and
ft
is the Bohr magneton*Substituting eqn., (2) into eqn. (1), we get
Since Jcos(J,H) is the projection of J on H and since J
has (2J+1) projections) we shall write Jcos(J,H) as Mj«
E ■ qSHHj where Mj : -J, -J+l,. • •,J-l,J Of)
The energy difference between adjacent Mj states is
If we place an oscillating magnetic field of frequency v*»
such that hv is equal to the energy difference AE, then
there occurs a magnetic dipole transition between two adja
cent Mj states* Those transitions that reach the higher
energy states absorb energy from the oscillating electro
magnetic field and those that reach the lower energy state
emit energy to the oscillating field* Relation (5) becomes
for paramagnetic resonance
Formula (6) expresses the resonance conditions.
The probabilities, for emission and absorption, in the
presence of an intense alternating electromagnetic field are
electrons in the lower energy state than there are in the
higher energy state* Consequently, there is observed i net
absorption of microwave energy*
E * g$J»H’ * gpjHcos(J,H) (3)
A E as g/eH(Mj2- Mj^) = gjfSH for A M j = ± l (5)
hws gpH
(
6
)
The literature on paramagnetic resonance is very exten
sive. Low's book (I960) on paramagnetic resonance in solids
gives the present state of the work being done in this field.
Most of the work has been done in a class of substances which
belong to the cubic symmetry group and in these cases, all of
the features of paramagnetic resonance can be explained theo
retically. It is when the symmetry of the site of the para
magnetic ion in question is not cubic that many of the unex
plained features appear. This is the result of the admixture
of the excited states with the ground state. Before these un
explained aspects are clarified much experimental work must
be done
At the outset of the present work, the task was to de
tect and study the excitation centers of x-ray irradiated
crystals by paramagnetic resonance techniques. The first
substance to be investigated was calcite (CaCO^) containing
manganese as a paramagnetic impurity. Although the x-rays
produced a strong luminescence in the calcite, it turned out
that the agency responsible for the effect either does not
involve free electrons and consequently is not paramagnetic,
or the temperature at which the experiment was performed is
not low enough.
With the facilities at hand, it was decided to carry out
research in crystals of symmetry lower than cubic. This is
because very little work has been done in this class of sub
stances and if the impurities happen to be of the iron trans
the experiment could be performed at temperatures higher
than that of liquid helium.
The measurement of the g-factor and the zero field
splitting constants would indicate the order of admixture
of the higher excited states of the paramagnetic ion for the
sites of such low symmetry. The class of substances that
were selected for study were the pyroxenes and in particular
spodumene (LiAKSiO-^^). Samples of spodumene at hand contain
ed a large number of impurities of which iron occurred in the
II
THEORY
The general Hamiltonian of a free ion placed in an
external magnetic field is given by
H =
V
VLS* VSS*V V V
VNH (1>When the free inn is placed in a crystalline field, we must
include the electrostatic interaction term, eVc . This
accounts for the interaction of the free ion with the
electric field of the neighbouring ions. The dipole-dipole
interaction between the nuclear moment and the magnetic
moments of the electrons VN , the Interaction of the quad-
rupOle moment Q of the nucleus with the electrostatic field
gradient Vq, and the interaction of the external magnetic
field H with the nucleus, are all aero. This is be
cause the paramagnetic ion of iron Fe*3 has no nuclear mag
netic moment. Also we shall not consider the spin-spin in
teraction Vgg at this time. Therefore the resultant Hamil
tonian is
(2)
Here Vp> is the coulomb interaction between the nucleus
and its surrounding electrons. It has the form:
vf = 2 1 [ p£/a>« *“Z e 2/vv |+ 2 1 e * / r hj (3)
k=i k >j * l 4
Is the magnitude of the positional vector from the center
of the nucleus to the kth electron* The running Index k in
cludes all of the electrons of the ion and $ is always dif
ferent from k but they both represent electrons* This in
teraction usually has the approximate magnitude 10^ cm-I,
The second most important interaction is the spin-orbit
coupling Viq between the spin and orbital momentum of the
electron. If we consider only states of definite L and S,
the spin-orbit interaction can be written as
Mnfje
(*+) Vj^g ■ L.S where ft is the spin-orbit
ston-stant for a given ion. Also L and S can be written as
L . I l „
B - X i J
C»
The crystalline field is regarded as a system of point
or dipole charges surrounding the paramagnetic ion. This
supposedly sets up- a static field \ihieh aots on the para
magnetic ion and changes the electronic orbits,, Usually
perturbation theory is used to calculate the effect of the
crystalline field. The crystalline field has been found
experimentally to fall into three types. Firstly there is
the strong field interaction, wherein Vc is of the order of
the energy caused by the electron repulsion term (101* ouf^) *
Secondly there is the medium field interaction in which the
energy intervals are of the same order as those of the mul
ti plets of the same electron configuration,, Here perturbat
ion theory is applied before calculating VLQ. Thirdly we
have the weak field interaction, wherein the energy inter
compar-ed to the spin-orbit energy level differences. The three
degrees of interaction are defined with respect to the rel
ative magnitude of the other terms of the Hamiltonian* The
point at which the crystalline field will be used as a per
turbation calculation depends on this relative magnitude con
sideration.
If we regard the point oharges, as not overlapping the
paramagnetic ion, the electrostatic potential is then a sol
ution of Laplace's equation
V 4v = o
(6)
The generalized Legendre polynominals are solutions b# this
equation. The potential can be written in the following forms
v • > «
Here k is summed over all the electrons and the normalized
harmonics y|J are defined as
V Z
)- C-i)*{ &
^
m
electron
The wavefunctions of the electrons can be expressed in har
monic functions ( where RCr^) refers to the
radial part of the wavefunction. Since the matrix elements
are of the form where
v : r = ^ A - r ~ ^ c e tt)< w ( »
then the matrix elements for n > 2 * are zero*. Also all terms
with odd n must vanish# This is because the product 't*
is unchanged by inversion symmetry, whereas the odd rank i
terms of the potential change sign# Even if there is no
center of symmetry the odd thrms are still zero but there
now may be terms from the admixture of higher levels* The
term n « 0 only adds a constant to the expansion and addls
nothing of significance* Since we are concerned with d
electrons, we need only consider the values, 2 and ^ for n*
Therefore
Let us now consider a particular sysmmetry for the
crystalline field. For spodumene we shall assume that it
has sixfold tetragonal co-ordination#. The symmetry in this
10
because the paramagnetic ion involved sees the same physical
situation for different orientations. In this case, it is
for rotations of ninety degrees about the tetragonal axis.
For example, if we consider the rhombic component of the
crystalline field and perform an operation of rotation by
ninety degrees, the crystalline potential must be the same.
Therefore we can write:
Va= 51
+ £ /C
z
a
* r-tij* +
Z A ^ ; 2
Here A§ ■ const.cos0^(eim<ta)
Now VR - Ct,.*VR. Here only the A*s are operated upon by
the C^. operator. Under the Ci* operation dnly the de
pendence is involved., Now we have
Also we do this for the axial, tetrahedral and the remain
ing terms of the crystalline potential and we obtain the
final form of the crystalline potential. It is
Equation (13) can also be written with respect to the dis
tances hetween the neighbouring ions, as shown in Fig. I 5
and has the form:
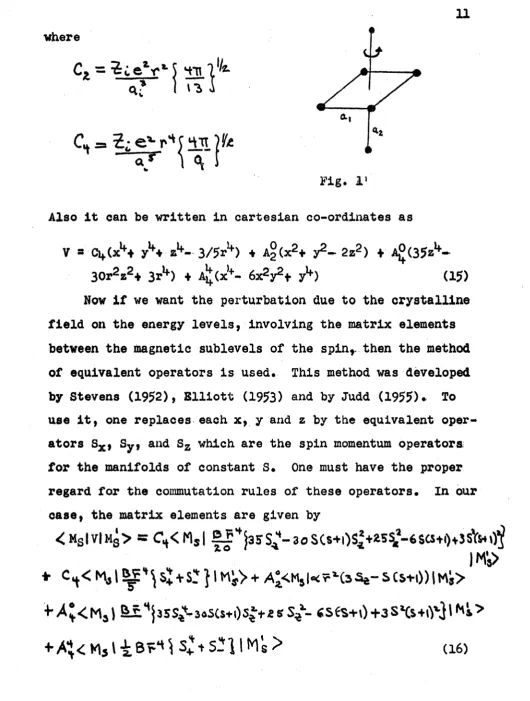
where
C* = •
feceV*‘
5 ^
<** i l l !
e y ^ ^ i U f c
Also It can be written in cartesian co-ordinates as
V » C^CxS
y V
a1*-- 3/5**) + A°(x2+ y2- 2z2) + Ag(35zlf-30r2z2+ 3r^) + A^(x>+- 6x2y2t y1*) (15)
Now If we want the perturbation due to the crystalline
field on the energy levels, Involving the matrix elements
between the magnetic sublevels of the spin,, then the method
of equivalent operators Is used. This method was developed
by Stevens (1952), Blliott (1953) and by Judd (1955). To
use it, one replaces each x, y and z by the equivalent oper
ators Sx , Sy, and Sz which are the spin momentum operators,
for the manifolds of constant S. One must have the proper
regard for the commutation rules of these operators. In our
case, the matrix elements are given by
<Ms|VlMg> = C
h< M s | | l Hj35S^-3oSCs+0S*+2S^-6SCStl)'V3SVn\)^
|M'j>
B x Hj35S^3aS(s+l)Sj + i s S ^ - «S t S+ 0 +3S*Cs+|^l^k>
+ A ; < M 5 > i 8 r ^ S ^ S ? ] I M s > (16)
11
Therefore the addition of the crystalline field potential
to the Hamiltonian is V** - 30SCStOS^-v-^r S£“
$SC$-n)+3S'L&+i)*l+ C+ StS+O] +A^ Er*£
3*5? -soSlS+OsiUsS^-tSte+rt+SSVs-HyJ
J
where (17)
R=r 3CM**-*sM(&2s)(j-*s+iV3U-fl(Jh*) •
gfaJUi-HS)
( a # - ( a J l + 3 ) ( a J l + s ) C i - H ) ( a . u - 3 ) f c f - i) f e f l+ 3 ) U i- - 0
and where the minus sign is used for less than half filled
shells and where the plus sign is used for more than half
filled shells* The above matrix elements for the crystalline
field are usually found in tables (Low I960).
To see in a qualitative way how the ground state of an
ion splits in a crystalline field, we can use group theor
etical methods* This method does not predict the order in
which the levels lie or the separation between them* We must
determine the matrix elements above for this information*.
Here we will only state the results of the group theoretic
al method for the paramagnetic ion Fe+3 whose ground state
is ^S* The complete results of the group theoretical treat
ment have been worked out by Bethe (1929) and they are list
ed toy Low (I960)
For the case of Fe+3 we consider the spin-orbit coupling
to be much stronger than the crystalline field effect*. The
ground state of Fe*3 is First we consider the sym
metry of the closest neighbours to be cubic. This results
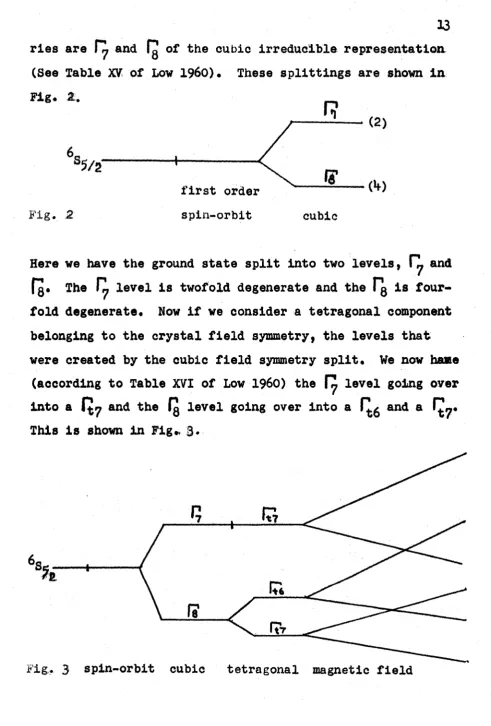
symmet-ries are and Q of the cubic irreducible representation
(See Table XV of Low I960)• These splittings are shown in
Fig.
St.
_6
first order
Fig. 2 spin-orbit cubic
(
2)Here we have the ground state split into two levels, and
fg. The r? level is twofold degenerate and the I"g is four
fold degenerate. Now if we consider a tetragonal component
belonging to the crystal field symmetry, the levels that
were created by the cubic field symmetry split. We now hame
(according to Table XVI of Low I960) the HJ level going over
into a Q y and the Q level going over into a and a f^.
This is shown in Fig.. 3*
We see that H) remains a twofold degenerate level, Whereas
fJJ splits into new levels which are both twofold degenerate,
fj6 and rj7y. If we apply a steady magnetic field as shown
in Fig* 3* the degeneracy is completely removed*.
Let us now return to the Hamiltonian, which is
H ■ Vpf- VLg* VH4eVc (18)
Consider only the perturbation part:
H = VH +eVe (19)
In paramagnetic resonance only transitions between the low?*
est energy levels are observed. These levels between which
transitions occur could be treated as isolated levels and
the higher lying levels ignored* If in the case of the free
ion, a state of quantum number S splits into 2S f 1 levels
in an external magnetic field and if only transitions between
2S*+ 1 levels are observed experimentally, then S' can be
defined as the fictitious spin of the system* Let us now
drop the prime on S'* Therefore the spin Hamiltonian can
be written}
Hs s /3 H*g#6 ♦ eVc (20)
Here is the Bohr magneton and g, a tensor, is the spectro
scopic g-factor. In our case we have axial symmetry and we
can write the spin Hamiltonian as
Hg = gM
(3
HZSZ * g± /3 (HXSX + HySy> f eVc (21)Here g(| is along the symmetry axis and g^ is normal to the
symmetry axis* Let us transform the Hamiltonian, by a rotat
15
axes having the Euler angles with respect to the
co
ordinate system of the crystal field. Also, the magnetic
field makes the angles (6,£,<p) with respect to the crystal
line field*. The transformation of fahe general Zeeman term,
gxSxHx 4 gySyHyf gzSzHz , is carried out in Low I960* The
transformation equations for the magnetic field components
are
Hx * Hsindsin£
Hy a -Hsin©cosS (22)
Hz ■ Hcos ©
The transformation equations for the spin components are
S2 ■ -abs| 4 (aa*- bb)Sz - a*b*Sl
8f = a2s| 4 2a ?S£ - 2si' (2J)
S. - a*2Si 4 2a*b S£ - H?S|
Therefore the Zeeman term becomes
S£(l/2(gx - gy)(Ab«Hf 4 a*bHj 4 l/2(gx 4 gyXa^H.f
a*bH+) 4 (aa* - bb*)gzHz) 4
sJ(lA(gx
- gy)a2H+ +lA(
gx 4 gy) (a2H. - b2H+) - abgzHz) 4
s!(lA(gx
- gy)(a*2H. - l?2Hf) 4
lA(gx
4 gy)(a*2H* - b*2H.) - a*b*gzH*).-S4' b2H„ j (2*0
where Hj. = ^
t
iHy, a - cos^oe**2^ ,b ■ i s i n i © * ^ ^If we only want the diagonal terms, the coefficients of S|
and Sj, must be zero. This leads to
sink's (gi/g)sin© gjj^ - gxsin2S +- g|cos2£
cosV- (g||/g)cosd g2 a g2cos20 4 g2sin2©
Sink's (gx/gJ.)sin£ g,j r gz
16
Since there Is axial symmetry present) the following three
relations are valid
£ * $ ' ( = <p' gx * gy (26)
The variation (angular) in the g-factor is, as a result of
equation (26)
g2 s g?,cos20 g?sin20
and 11
x
(27)g^ a const.
If a spectrum is taken such that the external magnetic
field rotates in a plane normal to the symmetry axis, then
by equation (27) we have 9
mlT/2
and g = gj^. Further if aspectrum is taken with the external magnetic field direction
along the symmetry axiS) then by equation (27) we have M O
and g * g||. Both of these situations were included in the
experiment and the results are set forth in chapter four.
Ill
APPARATUS
The electron-spin resonance spectrometer used was a
superheterodyne type, as described by Low (1961) and Feher
{195>6K The spectrometer operates at a 3,3 centimeter
wavelength and employs a 30 megacycle intermediate frequency.
The block diagram of the spectrometer is shown in Fig. 1.
In order to explain the function of the component parts
of the spectrometer, it is convienent to. consider the entire
system to be divided into three parts: (1) the signal micro
wave components, (2) the signal detection and amplication
system, and (3) the frequency control system.
1. The Signal Microwave Components
The power from the signal klystron, whose direction is
indicated by the arrow of the ferrite isolator, enters the
E-arm of the magic tee, T^*- Half of the microwave power is
transmitted down each side arm of the magic tee. There is
connected to one side arm a slide-screw tuner and a reson
ant cavity, and to the other side arm there is attached a
phase shifter, an attenuator and a line termination. These
elements, the phase shifter, the attenuator, the slide-screw
tuner, the characteristic impedance of the line and the
cavity, can be considered as components of a radio-frequency
R e p ro d u ce d w ith p e rm is sio n of the co p yr ig h t o w n e r. F u rth e r re p ro d u ct io n p ro h ib ite d w ith o u t p e rm is s io n . 30 Mc/s Amplifier
3 0 Me/s Oscillotor Phase
Detector
Signal
Oscillator EH
2 0 0 c/s T.T Ampl.
^ Phase Detector 30 Mc/s
Detector Recorder
Liquid A ir
Chamber 2 0 0 c/s
Oscillator Power
Amplifier
t\
A TableD.C. Amplifier lOkc/s Amplifier 10 kc/s Oscillator
x9
bridge and serve to tune out any reflected power that appears
in the H-arm, At resonance, the bridge becomes Unbalanced
and consequently microwave power appears in the H-arm and
is transmitted via the ferrite isolator to the E-arm of
the magic tee, T2 * The above isolator yerves to attenuate
any power reflected from Tg, which might appear in the H—
arm of the cavity bridge and thus unbalance it* The magic
tee, T2 , is essentially a balanced mixer. A pair of match
ed reversed diode detectors constitute the side arms of
this bridge, while the H-arm serves to Introduce the local
oscillator power, whose frequency is held accurately at 30
megacycles above (or below) that of the signal oscillator*
The power from both the signal oscillator and the local
oscillator divides equally between the side arms* The
power of the local oscillator divides in phase and that of
the signal oscillator out of phase. But since the diodes
are reversed, the signal power only appears at the output
of the mixer. This arrangement ensures a high conversion
gain and the cancellation of any noise from the local os
cillator appearing in the detection system*
2. The Signal Detection And Amplication System
The signal from the crystal mixer is fed into a 30
megacycle amplifier and detector. Its circuit diagram is
given in Fig.. 2. The detector is a diode* The sig
nal appearing at the output of the IN31* diode is fed into
20 O to in o E i
o
3 t> r- 25
o o ^ o
K io
, K ) —1 4
-S -S r -S ' -S . c
2 Q -J H
2* ^
2 S S
io ^ «o to on t t dc a :
£ *S
o w * O O N ® p O ^ to
o in o a: a:ca
(\| V V
s-o £
3
3
in o o
z . O CVJ
W O N W
21
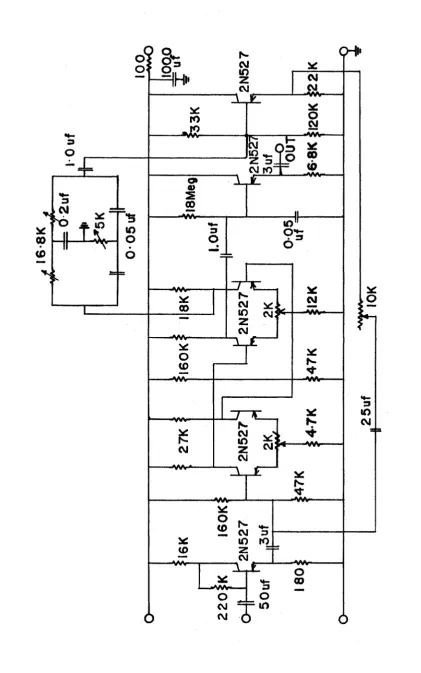
10 kc/s amplifier is part of the frequency control system and
is described below. The 200 c/s amplifier, as shown in
Fig. 3, is a narrow bandwith amplifier and is tuned for
200 c/s by means of the twin-tee network. From the 200 c/s
amplifier, the signal is fed into a lock-in detector. Its
circuit is shown in Fig. k. This signal from the 200 c/s
amplifier has a frequency of 200 c/s and it must have the
same phase as the 200 c/s reference signal mentioned below.
The reference signal is also a 200 c/s signal of fixed am
plitude, that is provided by the same 200 c/s oscillator
that supplies power ta the modulation coils. The function
of the phase detector is to convert the 200 c/s signal in
the two 1N3*+ diode rectifier systems into a d-c. voltage..
The polarity of the d-c. voltage depends on the phase relat
ionship of the signal input to the reference input. Finally,
the d-c. signal of the phase detector is recorded on a Var-
ian Associates strip recorder.
3. The Frequency Control System
There are two frequency control loops; one regulates
the frequency of the signal oscillator and one regulates the
frequency of the local oscillator.
Referring to Fig. 1, it can be seen that a fraction of
the power of each oscillator is sampled out by directional
couplers, and one is fed into the E-arm and one is fed into
2 2
CHi'
O CL
>:' 0.7 • — — IH1’
oj to o»
cm:
in to
— — in
g
.
3
20
0
c/
s
A
m
p
l
if
i
“
2
0
V
23
o 3
< x > -O -OQ
in
-wv—U m ry
i
g
.
4
L
o
c
k
-i
n
D
e
t
e
c
t
o
2k
in the diode which is attached to one side arm of the magic
tee, while the other side arm is terminated by its character
istic impedance. The beat signal appearing at the output of
the crystal detector is fed into a 30 Mc/s tuned amplifier.
The circuit of the amplifier is shown in Fig. Th© amplif
ied beat signal is then fed into a phase detector and compar
ed to a 30 Mc/s signal provided by a crystal controlled oscil
lator. Fig. 6 gives the circuit of the phase detector. The
phase relationship between the signal and the reference wave
forms determines the polarity of the d-c. signal returned to
the reflector of the local oscillator. The polarity of this
signal determines the direction of the shift in the frequency
of the local oscillator. By this means, the local oscillator
is kept 30 Mc/s above (or below) the signal klystron frequency.
The stabilization of the signal klystron is accomplished
in the following manner. The reflector of the signal klystron
is modulated by a very small 10 kc/s signal. Suppose that the
signal klystron is tuned to the frequency of the sample cavity,
then any tendency of the klystron to drift results in an error
signal at the modulation frequency appearing at the output of
the balanced mixer. Consequently the reflected power from the
cavity is modulated by the 10 kc/s and is detected in the same
manner as the resonance signal. The signal appearing at the
lW3lf diode of the 30 megacycle amplifier and detector is fed
into the 10 kc/s amplifier. The 10 kc/s amplifier is shown
25
w o O O
O M
r o o
•Hi'
I
x j
YYYW wrrvv
O O
Q.
4HI—
^
Q
r ^ i10 N ‘Ill O Q m
11 11 t
M
CLw
<0 <» S o 10 0 c 9 0 w O u:of
< <
26
o o
9— IN"
T o
in
.
7
l
O
k
/
c
A
m
p
l
i
f
i
e
27
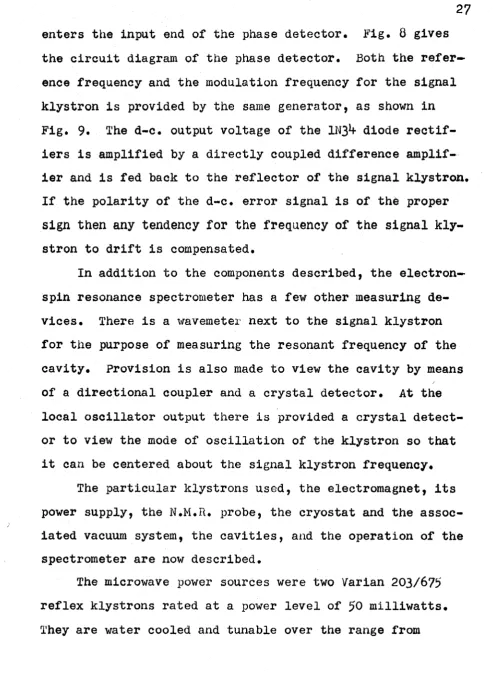
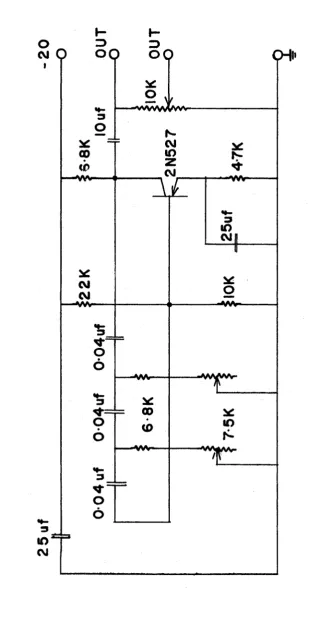
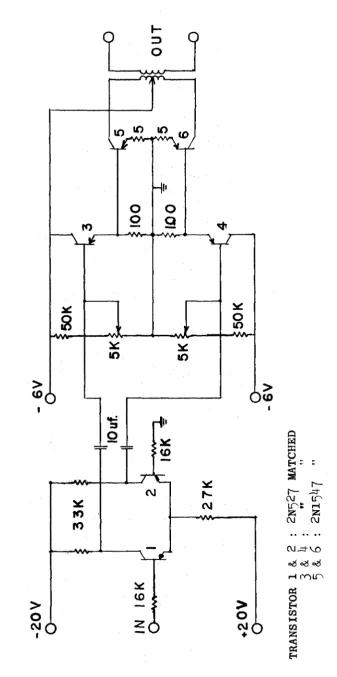
enters the input end of the phase detector. Fig. 8 gives
the circuit diagram of the phase detector. Both the refer
ence frequency and the modulation frequency for the signal
klystron is provided by the same generator, as shown in
Fig. 9. The d-c. output voltage of the 1N3^ diode rectif
iers is amplified by a directly coupled difference amplif
ier and is fed back to the reflector of the signal klystron.
If the polarity of the d-c. error signal is of the proper
sign then any tendency for the frequency of the signal kly
stron to drift is compensated.
In addition to the components described, the electron—
spin resonance spectrometer has a few other measuring de
vices. There is a t<ravemeter next to the signal klystron
for the purpose of measuring the resonant frequency of the
cavity. Provision is also made to view the cavity by means
of a directional coupler and a crystal detector. At the
local oscillator output there is provided a crystal detect
or to view the mode of oscillation of the klystron so that
it can be centered about the signal klystron frequency.
The particular klystrons used, the electromagnet, its
power supply, the N.M.Ft. probe, the cryostat and the assoc
iated vacuum system, the cavities, and the operation of the
spectrometer are now described.
The microwave power sources were two Varian 203/675
reflex klystrons rated at a power level of 50 milliwatts.
2 8
to CM
«►*
CM
in
H-CHi* coO
.
8
P
h
a
s
e
D
e
t
ec
t
o
-20
O
29
co 9 ~ L
*4— i d
=4=3 <M
C0 CNJ — -w v *
■Vw
CHI*
CM
O 3
cmO
i
g
.
9
l
O
k
/
c
O
s
c
i
l
l
a
t
o
8.5 Gc/s to 9-6 Gc/s. The beam current used was approximate
ly 30 milllamperes and it was supplied by a Lambda regulated
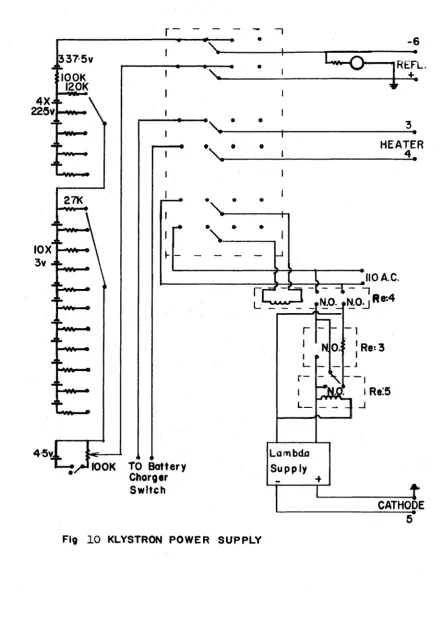
power supply, model 25* Six volt storage batteries suppl
ied the 0.*f - 0*5 amperes heater currents. The voltage on
the reflectors of the klystrons was provided by a shielded
battery bank of various sized dry cells. The battery bank
for the reflex klystron is shown in Fig.. 10. The voltage
on the reflectors can be increased or decreased In steps of
22.5 volts or 3 volts, from a fixed voltage of -337*5 volts
or -37*5 volts with respect to the ground or to the cathode,
respectively. Also on the battery banks there is suppl
ied a voltage that can be varied continuously over a *+.5
voltage range for a particular step voltage setting. tl
The magnet Used was a Newport 7 electromagnet, type
£• The gapi between the pole faces is adjustable and the
poles carry universal screw shims. We used a gap width of
6 centimeters and a magnetic field range of 0.5 kilogauss
to 5 kilogauss.. The universal screw shims were set approx
imately 0.16 centimeters out from the pole faces to ensure
a better homogeneity in the magnetic field. The magnetic
field variation over the paramagnetic specimen was no more
than one gauss in 10^ gauss for a field of 5 kilogauss.
'fhe stability of the magnet power supply as quoted by the
manufacturer was one part in 10,+ on the low current range
(0.5 - 12 amp.) for a mains input variation not exceeding
The field ripple was 0.5 gauss, peak to peak. We var
31
-6
REFL.
IOOK I20K
HEATER
27K
IOX h-wsr
,___ ,___,110 A.C. ~ "1“ 1_ . N.O._f N .O j Re:4
r
-i__
Lambda
S u p p ly 45v.
IOOK TO Battery Charger Switch
CATHODE
5
electromotive force to the sweep input of the power supply.
This was done by tapping the voltage across a rheostat by
means of a synchronous motor driven slide wire. The sweep*
rate was approximately 2
,$
gauss/sec. The steady magneticfield modulation is provided by coils wound in the same
plane as that of the pole faces of the magnet. They are
mounted side by side with the coils of the steady magnetic
field* The modulation coils are powered by a 200 c/s oscil
lator, as shown in Fig. 11, driving a power amplifier, Fig.
12, and they provided a modulation field of 10 gauss.
To measure the steady magnetic field we used a proton
resonance probe. The sample was held in a 7 mm. diameter tube.
It (the sample) was water with a small amount of copper sul
fate or ferric nitrate in order to shorten the relaxation
time of the resonance line. It is the proton of hydrogen
in the water which is responsible for the resonance line..
The probe proper consists of a calibrated marginal oscillator
and a detector amplifier system. The modulation colls of
the probe were supplied with the output of the 60 c/s sweep
circuit whose maximum output was three volts peak to peak.
Since the tunable frequency range of the oscillator with
the probe supplied was only from 8 to 22 Mc/s, it was now re
quired to construct another probe head in order to cover the
range below 8 Mc/s. Our probe was able to cover the range
3.5 Mc/s to 9 Mc/s.
The relationship between the proton resonance frequency
25
uf
-2
0
33
oo
oo
QHi*
in
CM
i
g
.
11
20
0
c
/
s
O
s
c
i
l
l
a
t
o
3^
Q i O
Q m tn o H ~ r— OJ LOS S3 OJ r— -if to H S3 OJ OJ_=tVO e$ o& o&
H C O L O
equation:
h V » < H Cl)
Since <K and h are well known and since W is the proton re
sonance frequency which was pre-set with the aid of a refer
ence oscillator, then the magnetic field is from eqn. (1)
H a h W (2)
or H(kgauss) - -- -— H (Mc/s).
^.2577
The reference oscillator used was a unit/time/frequency
calibrator manufactured by the General Radio Company. The
output frequencies of the reference oscillator covered the
range from 10 kc/s upward in steps of 10 kc/s. The above
frequencies were derived from a 5 megacycle quartz crystal
oscillator whose frequency drift with temperature variation
was -Ixl0~7/C to 2x10**7/5 for the ambivalent range
20*-The experiment was performed at temperatures close to
that of liquid air. The liquid air cryostat is shown in
Figs. 13 and l*t. The cryostat sits on the table and pro
trudes through an opening in the table and is centered care
fully between the pole faces of the magnet as shown in Fig. 1.
The liquid air trap consisted of a cylindrical brass contain
er with a brass tubing extension. The waveguide terminating
in the cavity was passed through the liquid air trap and the
temperature of the cavity was within a few degrees of that of
liquid air. To break the thermal contact between the liquid
air trap and the outer chamber of the cryostat, there was in
6 :1 0 - 3 2 HOLES ON A _ 6 -7 5 0 " C IR C LE
COVAR GLASS SEAL
GROUND GLAS-S J O IN T
INCHES
Fig. 13 Envelope of Cryostat
TO PUMPS
XZZZZZZZZZZZA
O-RING FLANGE
4 8 -3 2 THREADED-P L A S T IC . GUIDE
2 T
•/7//S////////777
tin////////////.
INCHES
' / / / / / A
6 1 0 -3 2
CLEARANCE HOLES -ON A 6 -7 8 DIA.
-GERMAN SILVER TUBE
7ZZE?
LIOUID AIR CHAMBER
ezzzzzzzzzzz
-BRASS TUBING
-COPPER GUIDE
WAVEGUIDE FLANGE
4 - 4 0 THREADED
38
side. Liquid air was introduced through a german silver tube
as shown in the above figures.
To improve the thermal isolation, the cryostat was
evacuated via a one half inch copper tubing which was equip-
ed with a air admittance valve and a Plrani gauge head and
was terminated by a small Consolidated Vacuum Corp. diffusion
pump, model VMF-5. The diffusion pump was backed by a Welch
Duo Seal mechanical pump.
All of the cavities that were used with this spectrom
eter were operated in the T E-^ rectangular mode. The cav
ities were made from commerical X-band waveguide material.
The cavities that were used to obtain the experimental re
sults are shown in Fig. 1$>. With the crystal mounted the
Q of the cavity was not less than 3x10^. The cavities were
coupled to the waveguide of the cryostat through a coupling _p
plate made of 10 inch thick copper plate and it had a
coupling hole of approximately 1/8 of an inch in diameter.
The cavity used in the experiment on calcite had a
section of its E-plane wall removed and its place was taken
by a carefully machined copper plate H, which fitted snugly
into this removed section. A calcite crystal that was un
der investigation was glued to this plate. In this way the
crystal could oe removed and mounted on the x-ray machine
for irradiation without disturbing the crystal orientation
or the coupling between the waveguide and the cavity.
The cavity used in the experiment on spodumene was
*+0
orient the crystal accurately with respect to the cavity
walls. The goniometer C, was fastened, to the E-plane wall
by means of a brass bracket composed of the parts A and D..
The graduated plate C, of the goniometer could be rotated
through 360 degrees about an axis normal to the E-plane of
the cavity B*. A semi-circular track K was soldered to the
graduated plate of the goniometer with its axis of rotation
parallel to it. The track bore a brass runner which is com
posed of the parts E and F. A nylon pin M, to which the
crystal is glued is mounted in this brass runner. This run
ner allows the crystal to be aligned so that there was no
translation of the axis of rotation for the magnetic field
when it was rotated.
To put the spectrometer into operation, one has to tune
mechanically the signal and local klystrons to give maximum
power outputs at the desired frequency. The signal klystron
/
r
-was modulated by a variable 60 c/s signal on its reflector
plate and the reflected power from the cavity was viewed by
means of a power take-off through a directional coupler. By
adjusting the klystron cavity tuner and the reflector vol
tage the frequency of the cavity was centered in a maximum
power mode. When the approximate frequency of the cavity
was noted by means of the wavemeter, the modulation was re--
moved from the signal klystron. In a similar manner the
local klystron was tuned. The 30 Hc/s beat frequency from
the detector next to the local klystron was easily detectable
h i
Next, the balanced crystal mixer was balanced. As before
the signal klystron was modulated and the output of each de
tector of the mixer was compared until the outputs balanced
each other. This was accomplished by the adjustment of the
matching stub in each side arm of the magic tee, T2. Again
the signal klystron was returned to normal operation but this
time the signal frequency control loop was closed* The sig
nal klystron was stabilized by Varying the ^-.5 volt continuous
voltage dial on the battery bank until the frequency control
locked on. Similarly the local klystron was stabilized.
The cavity was matched by tuning the slide-screw tuner and
the other devices in the bridge until a minimum was obtain
ed in the d-c. output of the 1N3^ diode of the 30 Mc/s amp
lifier and detector. The modulation of the signal klystron
was kept as low as possible to ensure a better signal to
noise ratio. Before any measurements were taken the equip
ment was allowed to stand approximately one to two hours
and any fine adjustments were made that were needed. This
allowed the temperature of the crystal to reach its minimum
value.
The N.M.R. probe was placed as close as possible to the
glass vessel containing the cavity and locked into position.
The first frequency measurement was set on the marginal os
cillator by beating with the one megacycle output of the re
ference oscillator. In this way as the magnetic field was
swept each succeeding one megacycle marker was set on the
k
2
on the strip recorder by shorting the terminals of the re
corder by means of a crude telegrapher’s key. The point of
coincidence between the marginal oscillator frequency and
the Value of the steady magnetic field is noted by viewing
the resonance line on the oscilloscope which uses a 60 c/s
external modulation.
Since the steady magnetic field is modulated at a small
fraction of the line width, then for resonance the first de
rivative of the absorption signal is obtained and it is this
that is recorded on the strip recorder.
The amplifiers and oscillators of the detection and mod
IV )
EXPERIMENTAL PROCEDURE AND RESULTS
In the investigation of calcite, one was interested
in the effect of intense x-rays on the structure of the
crystal lattice and whether the effect could be detected by
paramagnetic resonance techniques. The changes in the di
electric and optical properties of calcite produced by the
x-ray irradiation at normal temperatures has been studied by
K. V. Rao (1961). He has reported that upon irradiation by
x-rays calcite exhibited optical absorption in the ultra
violet region beyond **00 m/t. Also the dielectric loss of
calcite increased considerably upon irradiation and there
was a very strong thermoluminescence peak at 85 *C with minor
ones at higher temperatures. When heated after irradiation
the dielectric loss of calcite gave a maximum in the temper
ature range 70°- 120°C and beyond 230°C it behaved in a sim
ilar manner to that of non-irradiated calcite. Rao concluded
that the changes in the dielectric loss and the first glow
peak were possibly due to the thermal release of the trapped
electrons. It was presumed that the trapped electrons were
thermally raised to the conduction band and produced thermo-
luminescence in the process of recombination with the holes
initially created by the x-rays. These holes in the conduct
M+
studied by paramagnetic resonance techniques.
In the chemical analysis of the crystals of calcite
both manganese Mn+2 and iron Fe+2 were found as paramagnetic
impurities. It was expected that the spectrum of Mn+2 would
be observed at near liquid air temperatures but not that of
Fe*2 because of its excessively short relaxation time. It
would be necessary to cool the crystal down to liquid helium
temperatures before the spectrum of Fe*2 would be observed.
The investigation of the paramagnetic spectrum of calcite due
to the presence of the Mn*2 ion has been thoroughly investi
gated by Hurd, Sachs and Hershberger (195^)* They reported
that the spectrum of this particular manganese ion consisted
of thirty well resolved resonance lines, approximately 3*5
gauss in width and extended over a steady magnetic field
range of 1100 gauss beginning at approximately 2500 gauss.
A microwave frequency of 9300 Mc/s was used. Since the Mn^2
ion had a ground state S5/2 and a nuclear spin I =5/2,
then the total number of levels were (2S + 1)(21 + 1) = 3 6.
Since the selection rules gave = 1 and = 0, then there
were allowed thirty transitions. The g-factor was found to
be essentially isotropic; the hyperfine structure factors
A1 and B1 were found nearly equal and the fine structure con
stants D1 and d* were determined. The values found were:
g„ = 2.002 gL = 2 . 0 0 1 k A' = 8.782xlO“3 cnT1
D' = 3.75x10-3 cm*1 d' = >+.00x10”6 cm"1
The crystals of calcite investigated came from three
different parent samples. They differed in their colouring
and in their transparency. All of the calcite samples were
prepared by cleaving them along the natural rhomdehedral
cleavage planes. The dimensions of all the sample crystals
were approximately 5*5x2 millimeters. They were all, except
for one, mounted in the same orientation. This one crystal
was mounted wijth its crystallographic axis parallel to the
axis of rotation of the magnetic field. This particular
mounting was determined by a crystal goniometer. Each cal#
cite crystal was irradiated at room temperature and in the
dark. The orystals were irradiated for not less than 10
hours with the most energetic and most intense x-rays avail
able (at 50 kilovolts and 20 mllllamperes). The mounting
for x-ray irradiation of the oalcite crystals was flush
against the exit slit of the x-ray tube. All irradiated
crystals were mounted on the cavity plate while in the datk
and under a red safe light. Then they were immediately in
serted in the spectrometer and their spectra taken. Spec
tra were taken at both room temperature and a near liquid
air temperatures. All resonance spectra for calcite were
taken as the steady magnetic field was swept at a rate of
0.5 gauss/sec. and at a modulation frequency of 200 c/s with a peak to peak amplitude of 8 gauss.
One watched for a change in the resonance spectra of Mn
in calcite. Unfortunately the observed spectra showed no
*+6
A strong luminescence as reported by Rao in 1961 was observed
and also the resonance spectrum for the manganese ion as re
ported by Hurd, Sachs and Hershberger in 195*+ was observed.
All the sample crystals of calcite gave similar spectra.
It could be concluded that if there were paramagnetic
entities present that it was possible that the temperature
(liquid air temperature) at which the experiment was per
formed did not permit the Zeeman levels to be adequately
populated to give an observable effect. An experiment at
liquid helium temperatures would cefctainly correct this con
dition. Also it was thought that the relaxation time of the
spin system may be insufficiently long and thus the resonance
line would be broadened and obscured. Also an experiment at
liquid helium temperatures would make possible the observat
ion of resonance. Finally, it was thought that there may not
be any paramagnetic entities produced by the irradiation of
calcite.
In the investigation of spodumene the interest was in
the paramagnetic features of the impurities in the single
crystal. Spodumene has previously been thoroughly investi
gated by the nuclear electric quadrupole resonance method.
Volkoff, Petch and Smellie (1952) have performed experiments
) 7
on the splitting of the Li' nuclear absorption lines in, a
single crystal of LiAKSiO^)^. They found that one of the
principal axes of the field gradient tensor 7 E at the site
of the lithium nucleus has been found to coincide with the
*+7
in the plane of a and e.
The spodumene crystal (LiAl(SiOOp) is a monoclinic
pyroxene with diopside structure. Its space group is C^.
By the data of Warren and Biscoe (1931) and also Wykoff
(1957) the unit cell has four molecules. The projection
of the crystal structure on the (010) plane is shown in
Fig. 16. The dimensions of the unit cell are:
a s 9.50 A, b = 8.30 A, c = 5.2tf A and f t * 69°^0'..
The atomic co-ordinates with respect to the crystallographic
axes expressed as fractions of the unit cell dimens
ions are:
Li(.00, -.31,.25), Al(.00,.09,.25), Si(.21,Al,.25)>
01(.39, 02(.13,.25,.35), O^.l^f, A9,.00).
There is a twofold rotation axis parallel to the b crystal
lographic axis and passing through the Li and A1 positions
at ! * .0, 725. Symmetry centers are located at
| s .0, ±.5, « .0, ±.5, -.0, i.5 and also at $= -.2?,
T^» ±.2 5, J a.O, -.5.
The spodumene crystal Investigated was taken from a sam
ple which was optically transparent but had a yellowish col
ouration. The crystal which was analyzed by the N.K.C. lab
oratories was found to have a number of paramagnetic impurities
belonging to the iron transition group,. They were manganese,
iron and titanium, however there was only a 0.05 % concen
tration of manganese and a lesser concentration of titanium.
The most abundant paramagnetic ion (with a concentration of
li-kQ
+ Sy m m e t r y c e n t e r s a t ^ -o,±.5 X Sy m m e t r y c e n t e r s a t ^-±.23 • Rota t i o n a x e s
xv Sc r e w a x e s
At .09
.09
[.09
Fig* 16 Projection of a unit cell of monoclinic spodumene on the (010) plane.
quid air temperatures. A crystal of spodumene was taken from
the sample in the form of a rectangular prism whose sides
were formed by (110) cleavage planes. The intersection of
the (110) planes defined the c crystallographic axis. The b
crystallographic axis was taken to be in a plane normal to
the intersection of the (110) planes. This obtuse angle as,
measured experimentally was 96°, whereas the calculated value
was 9^5. This angle was measured by optical means, '^'he
method involved the measurement of the angles between the beam
In order to mount the crystal on the nylon pin of the
goniometer, it was necessary to punch two very small holes
in the crystal faces. The holes, approximately one milli
meter in depth, were punched in the crystal by means of an
ultrasonic drill; one was punched parallel to the b axis
and the other was punched parallel to the c axis. To mount
the crystal for the rotation of the magnetic field about the
b axis, it was glued to the nylon pin in approximately the
right orientation by the use of the hole parallel to the c
axis. For the fine adjustment of the crystal so that its c
axis was normal to the goniometer face the runner and the
dial on the goniometer face was used. When the epoxy glue
had dried the crystal was adjusted by moving the runner first.
Following this operation the goniometer was assembled in the
cavity. There now remained only the alignment of the b cry
stallographic axis with the axis of rotation of the magnetic
field. To do this the cavity was placed under a microscope
and a light was placed above the cavity. By means of reflect
ions off the (110) planes, it could be ascertained when the
angles between the (110) planes and the cavity walls were
equal. When these angles became equal the goniometer face
was locked by means of the set screws. For the rotation of
the steady magnetic field about the bxc axis the graduated
dial was rotated by ninety degrees in the E-plane from the
position it held for the rotation of the field about the b
axis and locked into position by means of the set screws.
50
crystallographic axis it was necessary to remount the crystal.
In this case the crystal was glued to the nylon pin by the
use of the hole punched parallel to the b axis. The plane
of rotation of the runner at the time of glueing was made
parallel to the H-\/all of the cavity. After the glue had
dried the cavity was placed under the microscope and any pre
cession of the c axis in the H-plane was eliminated by adjust
ing the runner. In this way c was made parallel to the E-wall
of the cavity. Finally any rotation of c found in the E-wall
of the cavity was compensated for by the rotation of the grad
uated dial and in this way c was set parallel to the H-plane.
These adjustments were made while the cavity was viewed with
a microscope.
If bxc, b and c, the axes about which the magnetic field
was rotated, are denoted by x, y and z then the data can be
given in a right handed co-ordinate system. The spectrum with
respect to each orientation was taken at 15° intervals and
at a steady magnetic field sweep rate of 2.5 gauss/sec. The
modulation frequency of the steady magnetic field was set at
200 c/s and the amplitude was set at 8 gauss peak to peak.
*
All the spectra were taken at temperatures very near (within
at least 5°) that of liquid air. The data for the three sep
arate rotations is tabulated in Table 1.
The angular variation of a single resonance line for the
one half to minus one half transition is graphically present
ed in Fig. 17. The spectra for the three different orientat
ANGULAR V A R IA T IO N OF A S IN G L E RESONANCE L IN E
3.65
-3.M5 —
2.05
-1.65
60 80 160
0 20 100 120
ROTATION OF MAGNETIC F IE L D (DEGREES)
TABLE I. DATA OF THE RESONANCE LINE FOR THE X Y AND Z
ORIENTATIONS ____________
e X Y Z Units
0 1.716
7*308 13.6673 *210 1.7117.286
Kgauss Mc/s
15 1*931
8.225
3.085
13.136 1.6897.193
30 2*315
9*856
2A 66 10.500
1.752 7 A 62
*♦5 2.831 12.053 2.080 8.859 1.861 7.923 60 3*376
l*f.3 72
1*725
7.3^6 1.87M- 7..980
75 3^33
1**.820
1.680 7.151*
1.831* 7.807
90 **.138
17*618
I.883
8.000 1.739
7.W+
105 2.317
9.866 1.7297-36**
120 3.151
13 15
2.826 12.03*f
1.831 7.61*3
135 2.6 57
11.315 3.19^ 13.600 1.888 8.0**0 150 2.203
9.381
i l : &
1.888 8.0^0
165 1.8*f9
7.876 1^.0313.295
steady magnetic field about the c crystallographic axis a
straight line graph would be expected. This is because 0 is
equal to ninety degrees and g becomes g^. But by the graph
there is present a small sinusoidal variation about the hori
zontal 1.8 kilogauss line. For the remaining two rotations
of the steady magnetic field it is expected that the angular
variation in the resonance line would follow the equation
g2 - g2Cos2© + g2sin20. The graphs of these two crystal or- 11
ientations do follow the same form as the above equation.
From these two graphs it is possible to calculate the values
of gjj and gj^.. This has been done and the results are list
ed in Table 2. Any angular variation in the g-factor caused,
by the crystal field has been ignored and only the relation
h H * g/#H for £M » 1 (1) has been considered. From equation
(1) the value of g can be determined. Here h = 6.6252xlO“2^
erg/sec, P = 8,9^2x10^ c/s, = 9.2732xl0“21 erg/gauss and
the value of H is taken from the graphs. The values found
for the two principal g directions are:
g|j = 1.960 and gj_ = 3.619.
There are also present in the spectra taken a number of other
fairly strong lines that are part of the Fe*3 spectrum. Fur
ther the spectra exhibits a number of equally spaced and equal
ly intense lines. This indicates a hyperfine interaction
given by the interaction of the spin of the iron ion with
that of the nuclear spins of both aluminium and lithium. Alum
inium has a nuclear spin of 5/2 and lithium has a spin of 3/2.
5^
TABLE 2 DATA FOR THE CALCULATION OF g AND g
Run Axis of Rotation Magnetic Field Value For g (ligauss) g
D X 1.716 3.500
E I 1.883 3.210
F Z 1.600
Average 1.799 3.355
expressed as: o \ t ,
H
f*AX if
L» Fe A u, )where N is summed over the nearest neighbours of A1 and Li#
•u7
The spectrum for Fe is shown in Fig. 18.
Future plans include the theoretical calculation of the
spectrum for Fe4^ with the crystalline field and the hyper-
fine structure included. Also the study of other diopside
crystals will be undertaken.
V
CONCLUSIONS
For this twofold study, we have reached a number of con
clusions. V/e have summarized them below.
(1) Calcite
The results for calcite were negative. There was no ob
served spectra that could be attributed to the effects of
x-ray irradiation# This result suggests a number of pos
sibilities.
(a.) there were no paramagnetic entities present;
(b) if there were paramagnetic entities present, then
it is possible that the Zeeman sublevels were not
populous enough to give an observable effect at
liquid air temperatures;
(c) also, if there were paramagnetic entities present,
then it is possible that the relaxation time of the
spin systems was much too short and consequently the
resonance line would be very broad and not easily de
tectable in the spectrum of Mn+^.
The conclusions (b) and (c) could be very easily tested.
Instead of doing the experiment at liquid air temperatures
one could do it at liquid helium temperatures. The relaxat
between the Zeeman sublevels would be increased. The results,
of this experiment at liquid helium temperatures would either
verify conclusion (a) or disprove it. Liquid helium was not
available to us, therefore we were unable to carry out this
experiment•
(2) Spodumene
The paramagnetic resonance spectrometer recorded a spec
trum for spodumene and we were able to draw a number of con
clusions from it.
(a) The paramagnetic spectrum can be associated with
the Fe^ ion.
(b) The crystal field splitting is small because there
is a number of resonance lines detected and not only
the one that we analyzed.
(c) The analysis on the single resonance line gave the
values --3.i>19 and gj| = 1.960 for the principal
g values in a crystal of axial symmetry.
(d) There is also present a hyperfine structure caused
by the interaction of the nuclear spins of aluminium
BIBLIOGRAPHY
BAGGULEY, D. M. S. and GRIFFITHS, J. H. E.. 19^7 Nature l60_, 532.
BETHE, H. A. 1929 Ann. Physik 5 3? 133.
CUMMERQW, R. L. and HALLIDAY, D. 19^6 Phys. Rev., 70,
^33-ELLIOTT, R. J., and STEVENS, K. W.,H. 1953 Proc. Roy. Soc. A218,
553-FEHER, G.. 1957 B. S. T. J. 3 6, ^50.
HURD, F. K., SACHS, M., and HERSHBERGER, W. D. 195^ Phys. Rev.. 93 , 373.
JUDD, B., R.. 1955 Proc. Roy. Soc.. A227, 552.
LOW, W. i960. Solid State Physics Suppl., 2 Academic Press N.Y.
RAO, K. V. 1961 J. Phys. Chem. Solids., 20, 193*
VOLKOFF, G. M.,, PETCH H. E., and SEMLLIE, D. E. L. 1952 Can. J.. Phys 30, 270.
VITA AUCTOKIS
I was born in Windsor Ontario on February 25, 1937» I
attended the Hon. J. C, Patterson Collegiate in Windsor and
graduated from there in the spring of 1957* Then I took one
year of engineering at Queens University, Kingston, Ontario..
In the fall of 1958 I entered Assumption University and regis
tered in the honours physics programme. I graduated from the
university in the spring of 1962.. In the fall of 1962 I re
gistered in the graduate programme for physics. During my
studies at the university I have held a bursary from the
I. 0. D. E., and one from the Independent Insurance Agents