ABSTRACT
WANG, LING. Influencing the Anaerobic Microbiome through Substrate Selection and Overloading Stresses to Achieve High-Performance Co-Digestion of Grease Interceptor Waste (Under the direction of Dr. Francis Lajara de los Reyes III).
Anaerobic co-digestion of grease interceptor waste (GIW) integrates waste management and resource recovery to improve economics and sustainability. There have been many attempts to improve the performance and stability of digester microbiome, but a universal approach regardless of the GIW origins that can enhance community resistance and resilience and avoid GIW overload and inhibition of methanogenesis is still lacking. In this dissertation, I conducted, for the first time for GIW co-digestion, a series of common garden experiments to directly investigate the causality between microbial community composition and
presented the first comprehensive time-series investigation of long-term (>200 days) microbial community and functional dynamics of GIW co-digesters with different loading stress histories. I evaluated the relationships between community composition, function, the environment under different levels of stress and stress history, and identities and ecological potentials of core populations within different metabolic networks. This dissertation
represents the first complete demonstration on exact approaches using substrate selection and overloading stresses to pre-select for more stress-tolerant members across anaerobic
Influencing the Anaerobic Microbiome through Substrate Selection and Overloading Stresses to Achieve High-Performance Co-Digestion of Grease Interceptor Waste
by Ling Wang
A dissertation submitted to the Graduate Faculty of North Carolina State University
in partial fulfillment of the requirements for the Degree of
Doctor of Philosophy
Civil Engineering
Raleigh, North Carolina 2018
APPROVED BY:
_______________________________ _______________________________ Dr. Francis L. de los Reyes III Dr. Joel J. Ducoste
Committee Chair
DEDICATION
This dissertation is dedicated to God my heavenly Father, for His mercy and grace that have given me new birth through the resurrection of His son, Jesus Christ; for His blessing and deliverance that restore my soul and spirit; for His comfort and guidance that lead me in paths of righteousness; for He is my rock, my shield, my strength, my hope, and the source of all my joys; for He listens my prayers and sees my affliction and distress; for He is my
BIOGRAPHY
ACKNOWLEDGMENTS
I would like to express my deepest gratitude to my advisor, Dr. Francis de los Reyes III, for his guidance during the past six years. He has shown great patience even when deadlines are approaching, never hesitated to support and encourage me to attend local and
international conferences (11 domestic and 2 international conferences and workshops), and most importantly, always tried to make time to meet and guide me through research
challenges and inspired me to reach higher goals. Additionally, this dissertation would not have been possible without Dr. Joel Ducoste who meets with us weekly and gives great advice and encouragement, Dr. Tarek Aziz who is always supportive and never hesitant to share his knowledge, Dr. Morton Barlaz who provides many research and collaboration opportunities and always gives insightful comments, and Dr. Robert Kelly whose comments and advice from a different perspective of discipline helped greatly in the completion of this research.
I wish to extend my sincere appreciation to the Department of Civil, Construction, and Environmental Engineering, for the high-quality research programs and facilities, and to the wonderful office staff, Ms. Barbara Simerson, Ms. Bonny Downing, Ms. Jodie Gregoritsch, Ms. Renee Howard, Ms. Brittane' Jarrell, Ms. Ginger McGlamery, Ms. Annette Maynard and Ms. Toni Pascucci, who always give warm greetings and have helped me through the
so helpful and patient. I also would like to thank the plant supervisor of South Durham Water Reclamation Facility, Mr. Charles Cocker, and the manager of Nuclear Services at the
department of Nuclear Engineering, for their kind assistance in helping me collect and process samples for the research.
This dissertation would not have been completed without the encouragement of my dearest friends in the US, Yi-Chun Lai, Chien-Ting Tang, Samaneh Babaee, and Catalina Lopez Velandia, as well as the love and friendship for over 14 years from Yi-Yun Wu, Li Taco, and Shin-Yu Huang. I sincerely appreciate all the love and support from my mentors in Christ, Joann and Howard Su, who have been amazing blessings in my life and I am forever grateful for their friendship and guidance through the path of righteousness.
TABLE OF CONTENTS
LIST OF TABLES ... viii
LIST OF FIGURES ... ix
Chapter 1 Introduction ... 1
Chapter 2 Anaerobic co-digestion of grease interceptor waste ... 3
2.1 Overview... 3
2.2 Challenges of GIW co-digestion ... 5
2.3 Microbial adaptation in GIW bioreactors ... 7
2.4 Microbial ecology in GIW digesters ... 9
Chapter 3 Research goals ... 12
Chapter 4 Common garden experiment identifies approaches to achieve resilient and resistant anaerobic co-digestion of grease interceptor waste ... 14
4.1 Abstract ... 14
4.2 Importance ... 15
4.3 Introduction ... 16
4.4 Materials and methods ... 19
4.5 Results ... 23
4.6 Discussion ... 35
4.7 Conclusions ... 40
4.8 Supporting information ... 41
Chapter 5 Common garden experiment identifies causality between key microbial populations and resilient and resistant anaerobic co-digestion of grease interceptor waste ... 46
5.1 Abstract ... 46
5.2 Importance ... 48
5.3 Introduction ... 48
5.4 Materials and methods ... 50
5.5 Results ... 56
5.6 Discussion ... 68
5.7 Conclusions ... 72
5.8 Supporting information ... 73
Chapter 6 Step and pulse feedings increase community resistance in anaerobic digesters treating grease interceptor waste ... 92
6.1 Abstract ... 92
6.2 Introduction ... 93
6.6 Conclusions ... 123
Chapter 7 Microbial community assembly and dynamics in anaerobic bioreactors with different loading stress histories ... 124
7.1 Abstract ... 124
7.2 Importance ... 125
7.3 Introduction ... 125
7.4 Materials and methods ... 128
7.5 Results ... 131
7.6 Discussion ... 139
7.7 Supporting information ... 152
Chapter 8 Conclusions ... 164
Chapter 9 Future work ... 168
REFERENCES ... 171
LIST OF TABLES
Table 4-1 Substrate characteristics. ... 24 Table 4-2 Substrate composition, total organic loading rate (OLR) and OLR of substrate
during cultivation (A) and disturbance periods (B). ... 24 Table 4-3 Low stress experiment: average methane yield and methane content ... 28 Table 4-4 Mid- and high-GIW dose experiment: average methane yield and methane
content ... 31
Table 5-S1 Substrate characteristics. ... 73 Table 5-S2 Substrate composition, total organic loading rate (OLR) and OLR of substrate
during cultivation (A) and disturbance periods (B). ... 73 Table 5-S3 Co-occurring taxa within each consortium. Highlight indicates taxa that were
more abundantly found in each group. ... 74 Table 5-S4 Shared taxa between all consortia. Highlight indicates taxa that were more
abundantly shared. ... 75 Table 5-S5 Shared taxa between all consortia excluding protein consortia. Highlight
indicates taxa that were more abundantly shared. ... 76
Table 6-1 Characterization of raw substrates and co-substrates used in experiment II. ... 99 Table 6-2 Characterization of prepared feedstock used in experiment II. ... 100 Table 6-3 GIW content, total organic loading rate (OLR), OLR of GIW, and average
biogas production, methane yield, and methane content of control and treated digesters in step and pulse feeding experiments. ... 105 Table 6-4 Previous studies performing anaerobic co-digestion by single-level, step, or
LIST OF FIGURES
Figure 2-1 Metabolic pathways and corresponding microbial communities of anaerobic
digestion ... 4
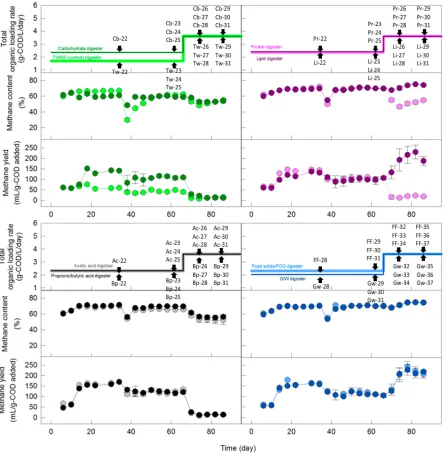
Figure 4-1 Low stress experiment: methane yield and methane content during cultivation and disturbance periods... 27
Figure 4-2 Mid- and high-GIW dose experiment: methane yield and methane content during cultivation and disturbance periods. ... 30
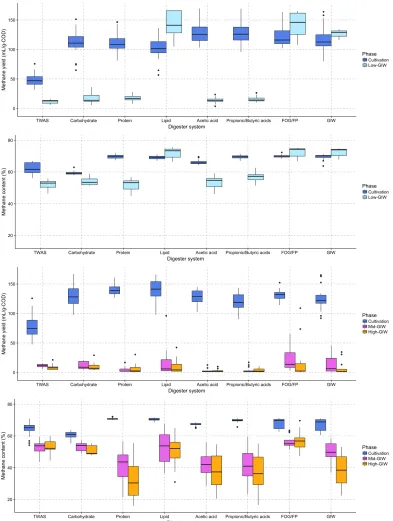
Figure 4-3 Average methane yield and methane content during low-, mid- and high-GIW dose experiments. ... 33
Figure 4-4 Effluent volatile fatty acids (VFAs) during low stress experiment ... 34
Figure 4-5 Methane yields at various OLRs of FOG-based wastes categorized into four zones. OLR of FOG-based wastes is calculated by multiplying FOG waste content (% w/w of VS added) and OLR of total substrate. White symbols represent methane yields without step feeding treatment. Black symbols represent methane yields with step feeding treatment. Methane yields at zero represent the occurrence of process failure when data of stable methane yield was unavailable. ... 36
Figure 4-S1 Total solids (TS) and volatile solids (VS) concentrations at low GIW dose. ... 41
Figure 4-S2 pH and alkalinity at low GIW dose. ... Error! Bookmark not defined. Figure 4-S3 Total solids (TS) and volatile solids (VS) concentrations at mid and high GIW doses. ... 42
Figure 4-S4 pH and alkalinity at mid and high GIW doses. ... 43
Figure 4-S5 Platform shaking tables with wooden grid frame. ... 44
Figure 4-S6 Digester column design. ... 44
Figure 4-S7 Experimental design of one set of mother-daughter system that consisted of three mother (Task 1A) and six daughter (Task 1B) replicate digesters. There are a total of eight mother-daughter systems cultivated with (1) TWAS (control) , (2) carbohydrate-, (3) protein-, (4) lipid-, (5) acetic acid-, (6) propionic and butyric acids, (7) Food particles and FOG, and (8) GIW-based substrates. ... 45 Figure 5-1 NMDS statistics applying Bray-Curtis similarity index on taxa abundance
Tw-26 to 28) and Day 86 (e.g. Tw-29 to 31) were analyzed during disturbance period (Days 66-86). Sampling days are listed in Figure 5-S1 in more details. ... 58 Figure 5-2 Community relative abundance of taxa from triplicate microbiomes cultivated
by TWAS (Tw), carbohydrate (Cb), protein (Pr), lipid (Li), acetic acid (Ac), butyric/propionic acids (Bp), FOG/Food solids (FF), and grease interceptor waste (Gw) on Day 62 during cultivation period (Days 0-66). Bacterial and archaeal taxa with more than 8% relative abundance in at least one sample are listed. Taxa with less than 8% relative abundance across all samples are grouped into one bar. Bars without labels represent less than 3% relative
abundance. p_: phylum, c_: class, o_: order, f_: family, g_: genus. ... 61 Figure 5-3 Community relative abundance of taxa from triplicate microbiomes cultivated
by TWAS (Tw), carbohydrate (Cb), protein (Pr), lipid (Li), acetic acid (Ac), butyric/propionic acids (Bp), FOG/Food solids (FF), and grease interceptor waste (Gw) on Day 86 during cultivation period (Days 66-86). Bacterial and archaeal taxa with more than 8% relative abundance in at least one sample are listed. Taxa with less than 8% relative abundance across all samples are grouped into one bar. Bars without labels represent less than 3% relative
abundance. p_: phylum, c_: class, o_: order, f_: family, g_: genus. ... 62 Figure 5-4 Co-occurrence network of digester microbiomes on Day 62 during cultivation
period visualized using clusters of “nodes” (OTU-nodes and sample-nodes) connected by “edges” (lines connecting shared OTUs between nodes). Closer clustering implies more shared OTUs (i.e. more shared taxa) are found between two samples. The relationship between nodes and edges is weighted according to the number of sequences within an OTU based on the microbial abundance profile. Larger nodes represent more connections; vice versa. ... 67 Figure 5-S1 Total organic loading rate (OLR), DNA sampling points, methane content and
methane yield during cultivation (Day 0-66) and disturbance periods (Day 66-86) in low-GIW dose experiment. During cultivation period, one microbiome sample from Day 34 (e.g. microbiome Tw-22) and triplicate samples from Day 62 (e.g. Tw-23 to 25) were analyzed. During disturbance period, triplicate samples from Day 74 (e.g. Tw-26 to 28) and Day 86 (e.g.
Tw-29 to 31) were analyzed. ... 77 Figure 5-S2 Community relative abundance of taxa from microbiomes cultivated by
labels represent less than 10% relative abundance. p_: phylum, c_: class, o_: order, f_: family, g_: genus. ... 78 Figure 5-S3 Community relative abundance of taxa from microbiomes cultivated by
protein (Pr) and lipid (Li) during cultivation (Days 34 and 62) and disturbance periods (Days 74 and 86). During cultivation period, one microbiome sample from Day 34 (e.g. microbiome Tw-22) and triplicate samples from Day 62 (e.g. Tw-23 to 25) were analyzed. During disturbance period, triplicate samples from Day 74 (e.g. Tw-26 to 28) and Day 86 (e.g. Tw-29 to 31) were analyzed. Bacterial and archaeal taxa with more than 8% relative abundance in at least one sample are listed. Taxa with less than 8% relative abundance across all samples are grouped into one bar. Bars without labels represent less than 10% relative abundance. p_: phylum, c_: class, o_: order, f_: family, g_: genus. ... 79 Figure 5-S4 Community relative abundance of taxa from microbiomes cultivated by
acetic acid (Ac) and butyric/propionic acids (Bp) during cultivation (Days 34 and 62) and disturbance periods (Days 74 and 86). During cultivation period, one microbiome sample from Day 34 (e.g. microbiome Tw-22) and triplicate samples from Day 62 (e.g. Tw-23 to 25) were analyzed. During disturbance period, triplicate samples from Day 74 (e.g. Tw-26 to 28) and Day 86 (e.g. Tw-29 to 31) were analyzed. Bacterial and archaeal taxa with more than 8% relative abundance in at least one sample are listed. Taxa with less than 8% relative abundance across all samples are grouped into one bar. Bars without labels represent less than 10% relative abundance. p_: phylum, c_: class, o_: order, f_: family, g_: genus. ... 80 Figure 5-S5 Community relative abundance of taxa from microbiomes cultivated by food
solids/FOG (FF) and GIW (Gw) during cultivation (Days 34 and 62) and disturbance periods (Days 74 and 86). During cultivation period, one microbiome sample from Day 34 (e.g. microbiome Tw-22) and triplicate samples from Day 62 (e.g. Tw-23 to 25) were analyzed. During disturbance period, triplicate samples from Day 74 (e.g. Tw-26 to 28) and Day 86 (e.g. Tw-29 to 31) were analyzed. Bacterial and archaeal taxa with more than 8% relative abundance in at least one sample are listed. Taxa with less than 8% relative abundance across all samples are grouped into one bar. Bars without labels represent less than 10% relative abundance. p_: phylum, c_: class, o_: order, f_: family, g_: genus. ... 81 Figure 5-S6 Total organic loading rate (OLR), DNA sampling points, methane content and
methane yield during cultivation and disturbance periods in mid- and high-GIW dose experiments. During cultivation period, we analyzed triplicate
Non-Figure 5-S7 NMDS statistics applying Bray-Curtis similarity index on taxa abundance profiles of bacterial and archaeal 16S rRNA amplicon sequences obtained from the mid- and high-GIW dose experiments, including samples of the digester systems enriched with TWAS (T), carbohydrate (C), protein (P), lipid (L), acetic acid (A), butyric/propionic acids (B), FOG/Food solids (F), and grease interceptor waste (G). Arrows indicate the order of sampling. Triplicate samples from each sampling day were merged and normalized.
Sampling days are listed in Figure 5-S6 in more details. ... 83 Figure 5-S8 Community relative abundance of taxa from microbiomes cultivated by
TWAS (Tw) during cultivation and disturbance periods. Bacterial and archaeal taxa with more than 10% relative abundance in at least one sample are listed. Taxa with less than 10% relative abundance across all samples are grouped into one bar. Bars without labels represent less than 3% relative abundance.
p_: phylum, c_: class, o_: order, f_: family, g_: genus... 84 Figure 5-S9 Community relative abundance of taxa from microbiomes cultivated by
carbohydrate (Cb) during cultivation and disturbance periods. Bacterial and archaeal taxa with more than 10% relative abundance in at least one sample are listed. Taxa with less than 10% relative abundance across all samples are grouped into one bar. Bars without labels represent less than 3% relative
abundance. p_: phylum, c_: class, o_: order, f_: family, g_: genus. ... 85 Figure 5-S10 Community relative abundance of taxa from microbiomes cultivated by
protein (Pr) during cultivation and disturbance periods. Bacterial and archaea l taxa with more than 10% relative abundance in at least one sample are listed. Taxa with less than 10% relative abundance across all samples are grouped into one bar. Bars without labels represent less than 3% relative abundance. p_: phylum, c_: class, o_: order, f_: family, g_: genus. ... 86 Figure 5-S11 Community relative abundance of taxa from microbiomes cultivated by
lipid (Li) during cultivation and disturbance periods. Bacterial and archaeal taxa with more than 10% relative abundance in at least one sample are listed. Taxa with less than 10% relative abundance across all samples are grouped into one bar. Bars without labels represent less than 3% relative abundance. p_: phylum, c_: class, o_: order, f_: family, g_: genus... 87 Figure 5-S12 Community relative abundance of taxa from microbiomes cultivated by
acetic acid (Ac) during cultivation and disturbance periods. Bacterial and archaeal taxa with more than 10% relative abundance in at least one sample are listed. Taxa with less than 10% relative abundance across all samples are grouped into one bar. Bars without labels represent less than 3% relative
abundance. p_: phylum, c_: class, o_: order, f_: family, g_: genus. ... 88 Figure 5-S13 Community relative abundance of taxa from microbiomes cultivated by
samples are grouped into one bar. Bars without labels represent less than 3% relative abundance. p_: phylum, c_: class, o_: order, f_: family, g_: genus. ... 89 Figure 5-S14 Community relative abundance of taxa from microbiomes cultivated by
food solids/FOG (FF) during cultivation and disturbance periods. Bacterial and archaeal taxa with more than 10% relative abundance in at least one
sample are listed. Taxa with less than 10% relative abundance across all samples are grouped into one bar. Bars without labels represent less than 3% relative abundance. p_: phylum, c_: class, o_: order, f_: family, g_: genus. ... 90 Figure 5-S15 Community relative abundance of taxa from microbiomes cultivated by GIW
(Gw) during cultivation and disturbance periods. Bacterial and archaeal taxa with more than 10% relative abundance in at least one sample are listed. Taxa with less than 10% relative abundance across all samples are grouped into one bar. Bars without labels represent less than 3% relative abundance. p_: phylum, c_: class, o_: order, f_: family, g_: genus. ... 91
Figure 6-1 Organic loading rate (OLR) and biogas characteristics over time in previous (Wang et al., 2013) and current experiments (experiment I). (a) OLR: black line is for control digester and grey line is for treated digester; (b) methane
yield; (c) biogas production; (d) methane content. ... 104 Figure 6-2 Effluent characteristics over time in control (l) and treated (¡) digesters
during phase 5 (Wang et al., 2013) and perturbation test (current study, experiment I). (a) VS concentration; (b) VS reduction rate; (c) COD concentration; (d) COD reduction rate; (e) pH; (f) alkalinity; (g) total
volatile acid; (h) ratio of total volatile acid and alkalinity. ... 106 Figure 6-3 Organic loading rate (OLR) and biogas characteristics over time in
experiment II. (a) OLR; (b) methane yield; (c) biogas production; (d) methane content. ... 110 Figure 6-4 Effluent characteristics over time in experiment II. (a) OLR; (b) VS
concentration; (c) VS reduction rate; (d) pH; (e) alkalinity. ... 111 Figure 6-5 Organic loading rate (OLR) and effluent characteristics over time in
control (l) and treated (¡) digesters during perturbation test at 70% (w/w) GIW loading rate in experiment II. Gray arrows indicate that both digesters were fed every other day. (a) OLR: black line is for control digester and grey line is for treated digester; (b) acetate; (c) propionate; (d) butyrate; (e) valerate.112 Figure 6-6 Organic loading rate (OLR) and effluent characteristics over time in control
(l) and treated (¡) digesters during perturbation and recovery tests in experiment II. (a) OLR: black line is for control digester and grey line is for treated digester; (b) acetate; (c) propionate; (d) butyrate; (e) valerate. ... 113 Figure 6-7 Methane yields at various OLRs of FOG-based wastes categorized into four
feeding. White symbols represent methane yields of non-step feeding (i.e. those methane yields of startup periods prior to step feeding of GIW). Methane yields at zero represent the occurrence of process failure when data of stable methane yield was unavailable. ... 122
Figure 7-1 Experiment I: Community relative abundance (A) and functional (B)
dynamics of startup (S1, S14, S15), developing (S2-S6), overloaded (S7, S16), recovering (S17), recovered (S8, S18), and developed (S9-S13, S19-S20) microbiomes. Each microbiome was sampled and sequenced in triplicate. Sampling points are labeled with pink circles. Bacterial and archaeal taxa with more than 8% relative abundance in at least one sample are listed. Taxa with less than 8% relative abundance across all samples are grouped into one bar. Bars without labels represent less than 10% relative abundance. p_: phylum, c_: class, o_: order, f_: family, g_: genus... 134 Figure 7-2 Experiment II: Community relative abundance (A) and functional (B)
dynamics of startup (P1, P2), developing (P3-P12), overloaded (P13, P14), and recovering (P15-P20) microbiomes. Each microbiome was sampled and sequenced in triplicate. Sampling points are labeled with yellow circles. Bacterial and archaeal taxa with more than 8% relative abundance in at least one sample are listed. Taxa with less than 8% relative abundance across all samples are grouped into one bar. Bars without labels represent less than 10% relative abundance. p_: phylum, c_: class, o_: order, f_: family, g_: genus. ... 135 Figure 7-3 NMDS statistics linking environmental conditions (arrow size representing
stress level), microbial community dissimilarity (circles representing microbiome composition) and whole community function (environmental contours representing methane yield). NMDS statistics were constructed applying Bray-Curtis similarity index on taxa abundance profiles of bacterial and archaeal 16S rRNA amplicon sequences obtained from experiments I (A) and II (B). Environmental contours were calculated using methane yield data shown in Figures 1 and 2. Arrows indicate the order of sampling. The size of the arrow increases with stress level (% GIW loading). ... 137 Figure 7-4 Metabolic network of anaerobic digestion mapped with associated functional
profiles of selected bacterial (>8% relative abundance) and all archaeal taxa identified in the step feeding experiment. Changes in the individual taxa
abundance are presented as percent increase or decrease in relative abundance by comparing microbiomes S6 with S1 (small arrow) or S17 with S15
Figure 7-5 The relationship between community function and diversity of microbiomes in Experiments I and II at different stress levels. Diversity was calculated from 10 rarefactions of 24,000 sequences each. Higher rarefaction depths showed similar results. Methane yield of each sample (shown in Figures 1 and 2) is plotted against (A) community richness (observed OTU counts), (B)
Shannon index, (C) Simpson’s evenness index, and (D) Gini coefficient. ... 151
Figure 7-S1 Step fed microbiome: organic loading rate (OLR) and effluent characteristics (volatile solids (VS) and COD concentrations, and VS and COD reduction
rates). ... 159 Figure 7-S2 Step fed microbiome: organic loading rate (OLR) and effluent characteristics
(pH, alkalinity, total volatile acids, and total volatile acids/alkalinity ratio). ... 160 Figure 7-S3 Pulse fed microbiome: organic loading rate (OLR) and effluent
characteristics (volatile solids (VS) concentration, VS reduction rate, pH, and alkalinity). ... 161 Figure 7-S4 Pulse fed microbiome: organic loading rate (OLR) and effluent
characteristics (acetate, propionate, butyrate, and valerate). ... 162 Figure 7-S5 Abundance dynamics of archaeal community in Experiments I (S1-20) and
II (P1-20). Each microbiome was sampled and sequenced in triplicate. Bars without labels represent less than 2% relative abundance. p_: phylum,
Chapter 1 Introduction
Anaerobic digestion, including hydrolysis, acidogenesis (fermentation), acetogenesis, and methanogenesis, is carried out by different consortia of microbes occupying distinct ecological preferences. To improve economics and sustainability, anaerobic co-digestion of grease interceptor waste (GIW) has shown great potential to substantially increase biogas production and methane content. Despite its potential, studies have shown inhibition of microbial community during degradation of lipid-rich materials and a threshold of GIW addition that led to inhibited and unstable methanogenesis and process failure. Indeed, a long-standing question in bioreactor engineering is what ecological patterns and processes determine the performance and functional stability of methanogenic biosystems and how this complex microbial network can be improved. The major questions that remain unanswered and continue to limit broader and more cost-effective applications of this biotechnology include: (1) identification of the maximum allowable GIW loading rate and the
corresponding maximum methane yield achieved before inhibition, (2) core microbial
populations across metabolic networks that play important roles in reducing substrate toxicity and enhancing functional resilience and resistance, and (3) a universal approach regardless of the GIW origins that can “push the limit” of GIW co-digestion and achieve high-yield yet stable operation.
digester microbiomes that had different niche preferences, (3) 16S metagenomic surveys using high-throughput DNA sequencing, and (4) novel microbial co-occurrence network analysis to statistically assess key microbiome members to high-performance GIW co-digestion. In chapter 2, I presented a literature review on anaerobic co-digestion of GIW-related substrates, major biological and operational challenges, microbial adaptation and community ecology of digester microbiomes in GIW-disturbed environments. In chapter 3, I presented the experimental objectives of this dissertation.
Chapters 4 to 7 are composed of four manuscripts for future journal paper submission. In chapter 4, I focused on the common garden experiments which allowed direct
identification of the impacts of substrate history (feed selection and intensity of historical pre-conditioning) and overloading GIW stresses on digester performance and stability. In chapter 5, I evaluated the causality between microbial community composition and
Chapter 2 Anaerobic co-digestion of grease
interceptor waste
2.1
Overview
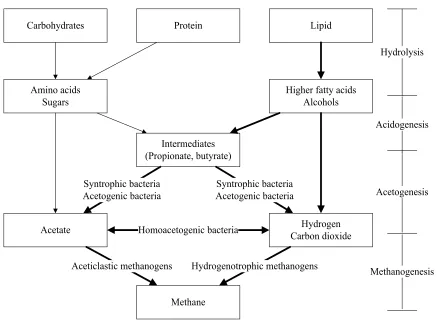
The major metabolic processes in anaerobic digestion include hydrolysis, acidogenesis (fermentation), acetogenesis, and methanogenesis (Figure 2-1). These processes are carried out by different groups of microbes occupying distinct ecological niches. During hydrolysis and acidogenesis, larger polymers (carbohydrates, proteins, and lipids) are broken down into smaller organic compounds (amino acids, sugars, long chain fatty acids (LCFAs), and alcohols) that are further degraded into short chain fatty acids (e.g propionate and butyrate), acetate, hydrogen, and carbon dioxide. During acetogenesis and methanogenesis, syntrophic bacteria degrade short chain fatty acids into acetate, hydrogen, and carbon dioxide and subsequently methanogenic archaea convert acetate, hydrogen, and carbon dioxide into methane (McCarty, 1964; Parkin and Owen, 1986; Speece, 1996; Stuckey et al., 2011).
wastewater treatment facilities. GIW is one of the most abundant waste-based organic substrates in the U.S. with high energy potential but limited disposal options (Austic, 2010; Dayton, 2010; Long et al., 2012; Skaggs et al., 2018). GIW typically comprises three major components: fat, oil, and grease (FOG), food particles, and associated wastewater generated from food service establishments (Chapin, 2008; Aziz et al., 2011; Gallimore et al., 2011; Long et al., 2012). Similar FOG-based wastes include: animal fats and waste oils from food or processing plants, the edible oil industry, the dairy products industry, and slaughterhouses; mixed FOG wastes from receiving or dewatering facilities, and trapped grease wastes from wastewater treatment facilities (EPA, 2004; Appels et al., 2011; Long et al., 2012).
Carbohydrates Protein Lipid
Amino acids Sugars
Higher fatty acids Alcohols
Intermediates (Propionate, butyrate)
Acetate Carbon dioxideHydrogen
Methane Homoacetogenic bacteria Syntrophic bacteria
Acetogenic bacteria
Syntrophic bacteria Acetogenic bacteria
Aceticlastic methanogens Hydrogenotrophic methanogens
Hydrolysis
Acidogenesis
Acetogenesis
Co-processing FOG-rich materials with sewage sludge increased methane production by 9% to 317% (compared to the base case with no co-digestion), depending on the source of startup substrate and co-substrate, total organic loading rate (OLR), OLR of co-substrate, solid retention time (SRT), mixing intensity, and feeding strategy and frequency (Davidsson et al., 2008; Kabouris et al., 2009; Luostarinen et al., 2009; Wan et al., 2011; Wang et al., 2013). Successful applications of anaerobic co-digestion with FOG wastes have been reported worldwide in lab scale (Kabouris et al., 2009; Luostarinen et al., 2009; Wan et al., 2011; Wang et al., 2013; Ziels et al., 2016), pilot scale (Davidsson et al., 2008), and full scale (Bailey, 2007; Gabel et al., 2009; York and Magner, 2009; Cesca et al., 2010; Downey, 2010; Muller et al., 2010; Johnson et al., 2011). Lipid-rich wastes from different origins have been extensively tested, including raw (un-dewatered) FOG from a receiving facility (Wan et al., 2011), dewatered FOG from grease traps (Kabouris et al., 2009), GIW from a meat processing plant (Luostarinen et al., 2009), GIW from a restaurant (un-dewatered) (Wang et al., 2013), grease trap sludge (Davidsson et al., 2008), and trapped FOG wastes from wastewater treatment facilities (Martín-González et al., 2011; Silvestre et al., 2011;
Noutsopoulos et al., 2013), waste cooking oil (Ziels et al., 2016), and food waste and FOG (Amha et al., 2017).
2.2
Challenges of GIW co-digestion
imbalance of the major metabolic steps, and consequently, process inhibition. The inhibition and toxicity of LCFAs to digester microbiomes, including limitations in substrate and
product transport, damage to cell membrane, increased lag phase of methane production, loss of methanogenic activity, and sludge flotation and washout, have been documented in many studies conducted with synthetic LCFAs (Hanaki et al., 1981; Koster and Cramer, 1987; Angelidaki and Ahring, 1995; Hwu et al., 1998; Palatsi et al., 2010; Rinzema et al., 2013), and reviewed (Chen et al., 2008; Alves et al., 2009; Long et al., 2012).
Although co-processing FOG-rich materials with sewage sludge has been reported to increase methane production, the performance profiles can differ markedly in terms of (1) the maximum methane yield that can be achieved and (2) the corresponding maximum allowable substrate loading rate before process failure which can be observed by drops in pH, alkalinity, and methane yield. For microbial communities, this threshold may be considered as the maximum degree of tolerance a digester microbiome has against GIW inhibitory effects based on their ecological roles and interaction networks (or “combined efforts”). Indeed, different consortia of microbes may be affected by and respond to the same abiotic manipulation differently, both in terms of their community composition and
2.3
Microbial adaptation in GIW bioreactors
Challenging the microbial community with GIW to enhance methane production increases the risk of substrate overdose and LCFA inhibition, but also creates an opportunity for microbial adaptation of methanogenic archaeal and LCFA-degrading bacterial
communities. Exposures to inhibitors such as ammonia, sulfide, sodium, insoluble organic compounds, and LCFAs at various concentrations have been reported to lead to adaptation of microorganisms to various degrees (Chen et al., 2008). Biomass adaptation and digester recovery from LCFA inhibition were observed in microbial communities treated with synthetic LCFAs (Alves et al., 2001; Cavaleiro et al., 2001, 2008, 2009, Palatsi et al., 2009, 2010), and real FOG-based wastes (Nadais et al., 2006; Silvestre et al., 2011; Wang et al., 2013; Ziels et al., 2016). The adaptation may be the result of population adaptation when the microbial population shifts towards the better-adapted microbiome members (Zeeman et al., 1985; Chen et al., 2008; Palatsi et al., 2010; Kougias et al., 2016). Although the exact microbiome assembly mechanisms and related functional dynamics are still not clear, it is believed that adaptation of microorganisms may decrease the inhibitory effect of toxicity shock and increase the biodegradability of undesired substrates (Wu et al., 1993; Chen et al., 2008; Silvestre et al., 2011; Stuckey et al., 2011).
L-substrates available when co-processing sewage sludge with GIW and to the step feeding of GIW with intermittent feeding patterns (every-other-day) that showed positive effects on the development of better microbial adaptation and reduction in inhibition of methanogenesis. Indeed, some studies have documented that during FOG co-digestion microbial adaptation correlated to reduced inhibition and improved digester performance (Silvestre et al., 2011; Ziels et al., 2016; Amha et al., 2017).
Positive effects of integrating intermittent and step feedings on digester performance were observed in previous studies. Compared to daily-fed communities, De Vrieze et al. (2013) observed higher degrees of bacterial dynamics and tolerance to ammonium loading shock in anaerobic communities treated with every-two-day feeding (without co-processing FOG-rich materials), although no difference in methane production and methanogenic community composition was found. Cavaleiro et al. (2009) showed that five pulse-feed cycles followed by step feeding of synthetic dairy wastewater with sodium oleate promoted sludge acclimation and more efficient degradation of LCFA-rich wastewater in an up-flow anaerobic column reactor. This feeding pattern also contributed to higher methane production. Biomass adaptation and increases in methane yield have been reported in a lab-scale
adaptation, allowing more efficient degradation of LCFAs and reduction of LCFA inhibition (Silvestre et al., 2011).
Additionally, several researchers have used pulse feeds of synthetic LCFAs and other waste-based materials along with batch methanogenic activity and toxicity tests to evaluate LCFA inhibition (Cavaleiro et al., 2001, 2008, 2009; Neves et al., 2009; Palatsi et al., 2009, 2010). These studies demonstrate the possibility of using a pulse feeding strategy to induce tolerance and adaptation in methanogenic archaeal and syntrophic acidogenic populations.
2.4
Microbial ecology in GIW digesters
Recent advances in microbial community ecology have sought to identify and explain patterns and processes of community assembly that govern natural ecological systems such as soil (Zhou et al., 2010; Barberán et al., 2012), ocean (Steele et al., 2011; Gilbert et al., 2012), as well as the human microbiomes of individuals (Fierer et al., 2008; Nasidze et al., 2009; Turnbaugh et al., 2009) or across body habitats (Costello et al., 2012; Human
Microbiome Project Consortium, 2012). Microbial community assembly has been considered historically as a deterministic process in which interspecies interactions (e.g.
of community members (Bell, 2001; Harpole, 2010). Others recognize the attributes of combined deterministic and stochastic processes in shaping the microbial community (Ofiteru et al., 2010). A conceptual synthesis of these theories has been proposed to include evolutionary forces, and concentrate these community assembly processes into four
categories: diversification (generation of new genetic variation), dispersal (movement of species across space), selection (deterministic structuring via abiotic factors) and drift (stochastic changes in species abundance) (Vellend, 2010; Nemergut et al., 2013).
Along with the recognized practical significance of microbial resource management (Read et al., 2011; Koch et al., 2014; Carballa et al., 2015; Sales and Lee, 2015), it is believed that theories and patterns of community ecology can be applied to study and better manage the complex community assembly and interaction webs of reactor microbiota in engineered environments. Specifically, there is a need to understand the degree to which reactor microbiome is structured by ecological processes, and the relationships and interactions between individual taxa and the environmental factors (Curtis et al., 2003; Rittmann et al., 2006; Faust and Raes, 2012; Pholchan et al., 2013; Gude, 2015; Rodríguez et al., 2015).
factors and community function. More recent studies actively manipulated community assembly in lab scale reactors to examine potential patterns and processes guiding the population and functional dynamics, such as deterministic niche and stochastic neutral theories and divergence and convergence patterns (Pholchan et al., 2013; Zhou et al., 2013; Vanwonterghem et al., 2014). Additionally, to identify ecological roles of core populations in microbiome assembly and functional dynamics, co-occurrence or microbial network
inference analysis has been applied to soil (Barberán et al., 2012), wastewater treatment
plants (Ju et al., 2014; Ju and Zhang, 2015), and household biogas digesters (Rui et al., 2015). Reactor microbiomes are optimally engineered and structured for the metabolic
Chapter 3 Research goals
The overall objective of this dissertation is to understand the ecological patterns and processes that determine the performance and functional stability of methanogenic
biosystems and how the digester microbiome can be improved to achieve high-performance GIW co-digestion.
Through a series of common garden experiments, in chapter 4, I evaluated (1) whether pre-disturbance experience matters (do they really need to be step-fed to achieve higher methane yield); (2) if substrate selection matters, which substrate leads to better performance; (4) comparing mixed FOG and food solids with GIW, does dewatering matter; and ultimately (5) how can we used this knowledge to build a “map” to high-performance, resilient and resistant co-digestion of GIW. In chapter 5, I assessed (1) the causal relationship between microbial community, function, and environment, (2) impacts of substrate history (feed selection and the intensity of preshocks) on community survivability to GIW stresses, (3) the microbial co-occurrence/interaction network of key digester populations that play important role in reducing GIW inhibition, and (4) approaches to improve community performance and stability.
challenging the anaerobic co-digester with periodic pulse feeds can result in more robust microbial communities. In chapter 7, I analyzed (1) how different levels of GIW disturbance direct community assembly and related functional dynamics; (2) how stress history links to community survivability and function; and (3) how ecological roles and niche characteristics of key digester microbiome members relate to their responses to different adaptation
Chapter 4 Common garden experiment
identifies approaches to achieve resilient
and resistant anaerobic co-digestion of
grease interceptor waste
4.1
Abstract
Anaerobic co-digestion of grease interceptor waste (GIW) has shown great potential to substantially improve biogas production. However, its application and bioenergy potential are still limited due to a lack of understanding of approaches to improve digester
performance and stability and to avoid substrate overload and inhibition of methanogenesis. In this study, we conducted, for the first time for GIW co-digestion, a series of common garden experiments to directly identify substrate history and operating strategies that can lead to resilient and resistant digester function. Eight sets of digesters in triplicates were seeded with the inoculum from a full-scale digester and further enriched at the same organic loading rate (OLR) using different substrates, including: (1) thickened waste activated sludge
(methane production and other parameters associated with effluent quality) and stability (ecological resilience and resistance) were monitored to directly attribute performance to community difference. Despite identical inoculum, operating conditions (e.g. substrate loading rate, digester system setup, solid retention time) and performance (methane
production and effluent quality) during the pre-disturbance stage, we observed feed-driven heterogeneity in response to GIW perturbations of increased intensity. Specifically,
functional resistance and resilience were enhanced, resulting in a substantial enhancement of methane yield only when the substrate history (feed selection and intensity of preshocks) was favorable. The highest GIW loading rate achieved without inhibition was 42 % (v/v), 63% COD, or 58% (w/w) of volatile solids (VS) added, with a total OLR of 1.74, or OLR of substrate of 1.01 g-VS/L/day. Methane content was increased from 62.3% to 74.1%, and the highest methane yield achieved was 453 VS added, or 218.6 mL-methane/g-COD (450% increase) compared to the control digester. Combined, this study advances our understandings of the impacts of substrate selection and overloading stresses on
methanogenesis and demonstrates specific operating approaches to enhance digester performance and susceptibility to different GIW loading rates.
4.2
Importance
4.3
Introduction
Anaerobic digesters are engineered under specific environmental conditions to allow the metabolic cooperation of specialized consortia of microbes for biosolids degradation and energy recovery from wastewater streams. To improve energy production and waste-to-energy management, co-digestion of sewage sludge with lipid-rich wastes that are high in biological methane potential has been widely studied using wastes from different origins such as raw (un-dewatered) fats, oils, and greases (FOG) from a receiving facility (Wan et al., 2011) (Wan et al., 2011), dewatered FOG from grease traps (Kabouris et al., 2009), grease interceptor waste (GIW) from a meat processing plant (Luostarinen et al., 2009), GIW from a restaurant (un-dewatered) (Wang et al., 2013), grease trap sludge (Davidsson et al., 2008), and trapped FOG wastes from wastewater treatment facilities (Martín-González et al., 2011; Silvestre et al., 2011; Noutsopoulos et al., 2013), waste cooking oil (Ziels et al., 2016), and food waste and FOG (Amha et al., 2017).
The major metabolic processes in anaerobic digestion, including hydrolysis,
1987; Angelidaki and Ahring, 1995; Hwu et al., 1998; Palatsi et al., 2010; Rinzema et al., 2013), and reviewed (Chen et al., 2008; Alves et al., 2009; Long et al., 2012). (Martín-González et al., 2011; Silvestre et al., 2011; Noutsopoulos et al., 2013)
To avoid FOG overload and inhibition of methanogenesis, it is crucial to determine the maximum allowable FOG loading rate and the corresponding maximum methane yield achieved before inhibition. Different organic loading rates (OLRs) have been widely tested, ranging from 0.05 (4% (w/w) VS of FOG added) to 3.40 g-VS/L/day (75%(w/w) VS of FOG added), but yielded inconsistent results (Davidsson et al., 2008; Kabouris et al., 2009;
Luostarinen et al., 2009; Martín-González et al., 2011; Silvestre et al., 2011; Wan et al., 2011; Noutsopoulos et al., 2013; Wang et al., 2013; Ziels et al., 2016). Many encountered inhibitions at low doses and yielded low biogas production. Others achieved higher methane yields, but the performance profiles differed markedly even at the same OLR or % FOG added. Co-digestion of FOG wastes appears to be dependent on many factors, including the source of startup substrate and co-substrate, total OLR, OLR of GIW, operating conditions (e.g. temperature, solid retention time, mixing intensity, and feeding strategy and frequency). Additionally, the characteristics of FOG materials are source-specific and can have VS ranging from 17% to 93% (w/w), chemical oxygen demand (COD) up to 1211 kg/m3 and other chemical compounds such as detergents or polymers used for dewatering (Davidsson et al., 2008; Kabouris et al., 2009; Luostarinen et al., 2009; Wan et al., 2011; Long et al., 2012; Wang et al., 2013).
(Wang et al., 2013). The threshold input of GIW without digester failure was determined to be in the range of 66% to 84%. A narrower range was identified from 66% to 71% (w/w) of VS added if combined with results from other studies using various GIW sources (Davidsson et al., 2008; Kabouris et al., 2009; Luostarinen et al., 2009; Wan et al., 2011; Wang et al., 2013). Under the same GIW addition, non-step-fed digester experience inhibition and
process failure, while the step-fed digester showed improved performance. Step feeding from 44% to 66% achieved the highest methane yield reported to date for co-digestion of GIW, increasing methane yield by 318% from 0.180 to 0.752 L-methane/g-VS added, biogas production from 2.2 to 21.6 L/day, and methane content from 60.2% to 68.6%. Compared to other single-level studies, step feeding of GIW achieved higher methane yield at the same GIW OLR and higher GIW OLR without digester inhibition. Indeed, previous studies have documented that microbial adaptation through step feeding or other acclimation strategies correlated to reduced inhibition of methanogenesis and improved performance in bioreactors treated with LCFAs (Cavaleiro et al., 2009; Kougias et al., 2016; Ziels et al., 2017), FOG-based wastes (Silvestre et al., 2011; Ziels et al., 2016), or other waste streams (Nadais et al., 2006; Goux et al., 2015). However, specifically how the adaptation mechanism can be initiated and to what degree this mechanism needs to be developed according to fluctuating stresses remain unclear.
(1) thickened waste activated sludge (control), (2) carbohydrate, (3) protein, (4) lipid, (5) acetic acid, (6) propionic and butyric acids, (7) mixed FOG and food solids, (8) GIW composed of FOG, food solids and associated wastewater, to selectively cultivate eight sets of digesters in triplicates at the same OLR. When exposed to a common disturbance at low-, mid- and high-GIW OLRs, we monitored digester function (methane production and effluent quality) and stability (ecological resilience and resistance) to directly identify the impacts of substrate history and operating approaches to achieve digester resilience and resistance. Specifically, through this unique approach we ask: (1) whether pre-disturbance experience matters (do they really need to be step-fed to achieve higher methane yield), (2) if substrate selection matters, which substrate leads to better performance, (4) comparing mixed FOG and food solids with GIW, does dewatering matter, and ultimately (5) how can we use this knowledge to build a “map” to high-performance, resilient and resistant co-digestion of GIW.
4.4
Materials and methods
establishment (FSE) in Cary, North Carolina was used as co-substrate. The three primary components of GIW, i.e. FOG, food particles, and wastewater, were collected separately at the FSE and stored at 4°C immediately after collection. GIW was sterilized prior to use using ionizing radiation (Cobalt-60 gamma irradiation) at 22 Gray/hr for a 24-hours exposure at the research facility of the Department of Nuclear Engineering, North Carolina State University, NC. The carbohydrate substrate was composed of glucose (50% COD) and starch (50% COD). The protein substrate was whey-based protein powder containing 20g protein, 4g carbohydrate and <0.5g fat per 28.2g of powder. Lipid substrate was 100% pure rice bran oil containing 3.5g saturated, 6g polyunsaturated and 4.5g monounsaturated fats, and 0% protein and carbohydrate. Substrate characterizations are shown in Table 4-1. The control reactor was fed with 100% TWAS and the treated reactors were fed with selective substrate (28-30% COD added from substrate) mixed with TWAS at similar OLR of substrate (Table 4-2).
into three 0.4L daughter digesters and continued to be cultivated at the same OLR with the same substrate type from Days 38 to 66. During disturbance period (Days 66-86), each triplicated daughter digester system was exposed to a low GIW disturbance (63% COD added from GIW) for a total of five feeding cycles (Table 4-2). To evaluate digester function and stability, we continuously monitored methane yield, methane content (Figure 4-1), effluent concentration and reduction rate of volatile solids, pH, and alkalinity after the disturbance (Figures 4-S1 to 4-S4).
without causing a process failure, and preparing microbial communities for higher level disturbances, according to our previous studies (Wang et al., 2013).
Digester design and environment. Special columns were constructed to allow easier sampling and subsequent dividing of the biomass (Figures 4-S5 and 4-S6). Each digester consisted of a polypropylene screw lid container with a unique grip lug and a leak proof seal ring. The lid was inserted with a nylon straight barbed connector with a silicon washer to keep the reactor airtight. A high-performance precision tygon tubing was connected the barbed connector to a PVDF 3-way stopcock for biogas sampling and subsequently to a flex-foil gas bag fitted with a hose valve for biogas collection. Another PVDF 3-way stopcock was fitted on the bottom side of the digester chamber serving as a feed and decant port.
All digesters were placed on a platform shaking table operated for mixing in a
temperature-controlled room to maintain mesophilic conditions (37°C). All digesters were fed every four days in a draw-and-fill semi-continuous mode with a solids retention time (SRT) of 20 (during cultivation period) and 14.7 days (during disturbance period). Effluent was collected, and an equal amount of feedstock was introduced into the digesters.
Digester function. Chemical and physical characteristics of the sludge and biogas were analyzed to evaluate digester microbiome function. Every four days before decanting and feeding the digesters, biogas production was recorded and normalized to standard
Association (APHA), 2005). Concentrations of individual volatile fatty acids (VFA; e.g., acetic, propionic, butyric, and valeric acids) were determined using a GC (GC-2014 Shimadzu) equipped with a flame ionization detector according to Method 5560 D in Standard Methods.
4.5
Results
Eight sets of digesters in triplicate were inoculated with the inoculum from a full-scale digester and cultivated using different feed sources including: (1) TWAS (control), (2) carbohydrate, (3) protein, (4) lipid, (5) acetic acid, (6) mixed propionic and butyric acids, (7) mixed FOG and food solids, (8) GIW composed of FOG, food solids and associated
Table 4-1 Substrate characteristics.
Anaerobic sludge TWAS (base substrate)
Lipid GIW
(inoculum) (rice bran oil) Wastewater FP and FOG layer TS (g/kg-wet sample) 25.9 ± 0.05 24.4 ± 1.45 1005 ± 5.97 2.70 ± 0.10 352 ± 7.14 VS (g/kg-wet sample) 16.0 ± 0.05 17.0 ± 1.22 1004 ± 6.03 2.39 ± 0.05 349 ± 6.33
VS/TS (%) 61.8 69.8 100 88.6 99.3
COD (g/L) 28.7 ± 3.20 33.8 ± 5.81 3032 ± 565 5.65 ± 0.67 744 ± 229 a Total solid concentration
b Volatile solid concentration
c Chemical oxygen demand concentration
Table 4-2 Substrate composition, total organic loading rate (OLR) and OLR of substrate during cultivation (A) and disturbance periods (B).
Reactor microbiome
Substrate concentration Total OLR OLR of substrate %vol %VSc %CODd g-VS/L/day g-COD/L/day g-VS/L/day g-COD/L/day
(A) Cultivation period
TWAS 100 100 100 0.90 1.69 - -
Carbohydrate - 45.2 28.0 1.54 2.35 0.69 0.66
Protein - 43.2 28.1 1.48 2.35 0.64 0.66
Lipid 0.5 19.3 30.2 1.05 2.41 0.20 0.73
Acetic acid 1.2 - 28.1 0.84 2.32 - 0.65
Propionic and butyric acids 4.1 - 28.2 0.85 2.33 - 0.66
Food particles and FOG 1.8 24.1 28.2 1.11 2.31 0.27 0.65
GIW 15 24.9 29.3 1.00 2.03 0.25 0.60
(B)
Disturbance period
Low GIW dose 42 57.7 63.0 1.74 3.61 1.01 2.28
Mid GIW dose 60 73.8 77.9 2.03 4.17 1.50 3.25
Low-GIW dose experiment. During the cultivation period (Days 1-66), different
functional communities were developed by selective addition of substrates at similar organic
loading rates (OLR) (Table 4-2). From Days 1 to 38, eight 1.2L mother digesters were
selectively enriched using the different substrate types (Figure 4-1), and on day 38, each
mother digester was equally distributed into three 0.4L daughter digesters (Figure 4-1). To
maintain anaerobic conditions, nitrogen was supplied during distribution, which led to a
quick drop in methane content and methane yield on Day 38 (Figure 4-1). Methane content
recovered after one to two feeding cycles as the biogas filled up the reactor chamber. After
this transition, each daughter digester continued to be cultivated at the same OLR with the
same substrate type from Days 38 to 66. The average methane content during cultivation was
62.2% for TWAS reactor, 59.3% for carbohydrate reactor, and approximately 66-69% for
protein, lipid, acetic acid, mixed propionic and butyric acids, mixed food solids and FOG,
and GIW reactors (Table 4-3). The average methane yield during cultivation was 48.9
mL/g-COD for the control reactor (TWAS) and approximately 100-130 mL/g-mL/g-COD for the treated
reactors.
During the disturbance period (Days 66-86), each triplicated daughter digester system
was exposed to a low GIW disturbance (63% COD added from GIW) for a total of five
feeding cycles (Table 4-1 and Figure 4-1). Overloading was observed immediately after the
end of the first feeding cycle (from Days 66-70) in five types of digester cultivated by TWAS,
carbohydrate, protein, acetic acid, and mixed propionic and butyric acids, according to the
mL/g-COD (Day 86), and average methane content from 62.2% to 55.2% (Day 86). The
average methane yield of carbohydrate reactor decreased from 112 to 11.0 mL/g-COD, and
average methane content from 59.3% to 53.8% (Day 86). The average methane yield of
protein reactor decreased from 111 to 17.9 mL/g-COD, and average methane content from
69.7% to 54.7% (Day 86). The average methane yield of acetic acid reactor decreased from
129 to 14.1 mL/g-COD, and average methane content from 66.3% to 52.1% (Day 86). The
average methane yield of propionic/butyric acids reactor decreased from 128 to 13.1
mL/g-COD, and average methane content from 69.4% to 56.3% (Day 86).
On the other hand, lipid, food solids/FOG, and GIW digesters showed improved
performance since Day 66 (Figure 4-1 and Table 4-3). Comparing the average methane yield
before and after the disturbance, the methane yield of lipid reactor increased from 102 to 206
mL/g-COD added, and methane content from 69.1% to 73.2%. The methane yield of food
solids/FOG reactor increased from 126 to 218 mL/g-COD added, and methane content from
69.9% to 73.8%. The methane yield of GIW reactor increased from 118 to 216 mL/g-COD
Table 4-3Low stress experiment: average methane yield and methane content
Reactor microbiome Methane yield Methane content
(mL/g-COD) (%)
Cultivation period
TWAS 48.9 62.2
Carbohydrate 112 59.3
Protein 111 69.7
Lipid 102 69.1
Acetic acid 129 66.3
Propionic and butyric acids 128 69.4
Food particles and FOG 126 69.9
GIW 118 69.5
Disturbance period
TWAS 11.7 52.0
Carbohydrate 17.1 54.0
Protein 17.4 51.9
Lipid 206 73.2
Acetic acid 13.8 53.5
Propionic and butyric acids 16.0 57.0
Food particles and FOG 218 73.8
Mid- and high-GIW dose experiments. Four digester systems were set up to perform
mid and high GIW dose experiments simultaneously using two types of substrate at a time
(Figure 4-2). Similarly, a quick decrease and recovery pattern of methane content and
methane yield were observed during the transition of mother and daughter digesters, after
which all digester systems continued to be cultivated at the same OLR with the same
substrate type until challenged in the disturbance experiment. The average methane content
during cultivation was 64.9% for TWAS reactor, 60.4% for carbohydrate reactor, and
approximately 67-70% for protein, lipid, acetic acid, mixed propionic and butyric acids,
mixed food solids and FOG, and GIW reactors (Table 4-4). The average methane yield
during cultivation was 76.8 mL/g-COD for the control reactor (TWAS) and approximately
120-140 mL/g-COD for the treated reactors. The small difference in methane yield during
cultivation period between low-GIW dose and mid- and high-GIW dose experiments was
likely due to the differences in system setup, working volume, and duration of operation
before disturbance experiments were performed.
During the disturbance period, a daughter digester system (in triplicate) was exposed to
a mid-GIW dose disturbance (77.9% COD added from GIW) and another system (in
triplicate) to a high-GIW dose disturbance (95.5% COD added from GIW) for a total of five
feeding cycles (Table 4-1 and Figure 4-2). After the first disturbance, all eight digester
systems showed decreases in methane content and methane yield (Figure 4-2). Other effluent
parameters also indicated digester overloading consistently across all digester types (Figures
Table 4-4Mid- and high-GIW dose experiment: average methane yield and methane content Reactor microbiome Methane yield Methane content
(mL/g-COD) (%)
Cultivation period
TWAS 76.8 64.9
Carbohydrate 130 60.4
Protein 141 70.9
Lipid 139 70.5
Acetic acid 129 67.3
Propionic and butyric acids 120 69.8
Food particles and FOG 134 68.2
GIW 127 67.3
Disturbanc e period
Mid-GIW dose
TWAS 11.7 52.5
Carbohydrate 11.4 53.1
Protein 4.41 41.6
Lipid 17.2 52.9
Acetic acid 3.31 42.5
Propionic and butyric acids 3.81 41.4
Food particles and FOG 24.1 56.4
GIW 14.6 49.6
High-GIW dose
TWAS 9.15 52.8
Carbohydrate 10.5 50.6
Protein 6.29 31.4
Lipid 10.0 50.5
Acetic acid 2.79 37.0
Propionic and butyric acids 3.48 37.0
Food particles and FOG 16.9 56.4
Comparison of digester performance. Before the low-GIW dose disturbance, all 7
treated digester systems were cultivated under the same environmental conditions (digester
system setup, total OLR, OLR of substrate, SRT) and generated the same level of methane
yield at approximately 125 mL/g-COD. After the low-GIW dose disturbance, 5 digesters
including the control encountered inhibition that significantly reduced their methane
production and effluent quality. Only digesters cultivated by lipid, food solids/FOG, and
GIW survived and achieved approximately 100% increase in methane yield (Figures 4-1 and
4-3). Specifically, comparing the methane yield before (Day 66) and after five feeding cycles
of disturbance (Day 86), the methane yield of lipid reactor increased from 106 mL/g-COD to
187 mL/g-COD (76% increase), and methane content from 69.8% to 73.9%. The methane
yield of food solids/FOG reactor increased from 105 mL/g-COD to 205 mL/g-COD (95%
increase), and methane content from 69.6% to 74.5%. The methane yield of GIW reactor
increased from 104 mL/g-COD to 219 mL/g-COD (110% increase), and methane content
from 70.4% to 74.1%. Compared to the controlled digester system on Day 66, the addition of
lipid, food solids/FOG, and GIW at low-GIW dose increased the methane yield by
Digester stability assessment. The influence of a disturbance on digester function was
assessed using ecological parameters of functional stability, including resistance (the
maximum accumulation of key intermediate product), resilience (the time it takes for the
accumulated product to return to its original state) (Botton et al., 2006; Werner et al., 2011).
We monitored individual VFA concentrations under regular and disturbed environments for
one feeding cycle with one feeding/disturbance event. An increase in concentrations of acetic,
propionic, butyric and valeric acids was observed in all triplicated digester systems that were
previously cultivated by lipid, food solids/FOG and GIW on Day 67, 12 hours after the
low-GIW dose disturbance (Figure 4-4). The concentration of acetic acid increased from less than
30 mg/L to 200 mg/L and continued to increase on Day 69. However, no occurrence of
methanogenic inhibition was identified by the measured biogas production, methane content,
effluent VS concentration, pH, and alkalinity. The concentrations of propionic, butyric and
valeric acids also increased on Day 67 but subsequently decreased.
4.6
Discussion
To compare performance of step feeding with previous studies, we adopted the idea of
Noutsopoulos et al. (2013) to plot biogas yield versus OLR of FOG wastes (calculated by
FOG waste content (% w/w of VS added) times total OLR) and replaced biogas yield with
methane yield to obtain a more accurate result that includes the contribution of methane
content in biogas (Figure 4-5).
Methane yields at various OLRs of FOG-based wastes were categorized into four zones.
Zone 1 ranges from 0 to ~1.03 g-VS/L/day where both non-step-fed (white symbols) and
step-fed digesters (black symbols) were able to function without process failure, with average
methane yields ranging from 0.1 to 0.5 L-methane/g-VS added. Within this range, methane
yield is proportional to the OLR of FOG wastes; i.e. the more biodegradable VS added, the
more methane produced within zone 1.
The threshold for FOG waste addition resulting in an inhibited digestion process is
identified to be at approximately 1.03 g-VS/L/day where Zone 2 starts, ranging from 1.3 to
~2.0 g-VS/L/day. Within Zone 2, the degree of digester tolerance against LCFA inhibition
varied. Process failures indicated by zero methane production were observed in both step-fed
(Martín-González et al., 2011) and non-step-fed (Wang et al., 2013) digesters at ~1.4
g-VS/L/day. On the other hand, stable results were found in both step-fed (Luostarinen et al.,
2009; Wang et al., 2012; Wang et al., 2013) and non- step-fed (Kabouris et al., 2009;
Noutsopoulos et al., 2013; Wan et al., 2011) digesters, producing methane yields of 0.45 to
Favorable substrate history (feed selection and intensity of pre-conditioning)
enhances resilience and resistance of GIW co-digestion. From our previous study (Wang
2013), step feeding at 46% (w/w) of VS added (0.73 g-VS/L/day OLR of GIW) first
increased methane yield from 0.18 to 0.50 L-methane/g-VS added, and at 66% (w/w) of VS
added (1.43 g-VS/L/day OLR of GIW) methane yield was increased to 0.75 L-methane/g-VS
added (318% increase). As shown in Figure 4-5, this production enhancement is the highest
reported to date for co-digestion of GIW.
In this study, we used a common garden approach and further demonstrated that
substrate history (in terms of selection and dosage) during pre-disturbance cultivation phase
played an importance role in reducing GIW toxicity and the risk of overloading. In Figures
4-1, 4-3 and 4-4, despite identical inoculum, environmental conditions (operation and OLR of
substrate), and digester function (methane production and effluent quality) during the
pre-disturbance cultivation period, only digester systems cultivated using lipid, FOG/food solids
and GIW at 0.20 to 0.27 VS/L/day survived a more intense GIW perturbation at 1.01
g-VS/L/day. The process failure observed in digesters cultivated by TWAS (control),
carbohydrate, protein, acetic acid, and propionic/butyric acids indicated the importance of
substrate selection. Our results showed that the stress response of anaerobic digesters was
feed-specific, and only step feeding using similar substrates (i.e. lipid, FOG/food solids and
GIW) improved digester resistance and resilience to an elevated stress condition. The
pre-conditioning of lipid was conducted using rice bran oil (Table 4-1), which showed a similar
To demonstrate the importance of a “preshock” cultivation period (the step feeding
approach), we mapped the methane yields from this study during low- (1.01 g-VS/L/day),
mid- (1.50 g-VS/L/day) and high-GIW disturbances (2.42 g-VS/L/day) in Figure 4-5. When
using lipid, FOG/food solids and GIW at 0.20 to 0.27 g-VS/L/day to step-feed during
cultivation, methane content was increased from 62.3% to 74.1%, and the highest methane
yield achieved was 453 mL-methane/g-VS added, or 218.6 mL-methane/g-COD (450%
increase), compared to the control digester (TWAS). Without a pre-conditioning treatment,
the control digester (TWAS) encountered process failure.
The process failure of all digester systems (including lipid, FOG/food solids and GIW
digesters) at mid- (1.50 g-VS/L/day) and high-GIW disturbances (2.42 g-VS/L/day)
demonstrated that step feeding at 0.20 to 0.27 g-VS/L/day was not sufficient to reduce the
inhibition at mid- and high-GIW doses. To “properly enter Zone 2” and overcome GIW
toxicity at 1.0 g-VS/L/day, pre-conditioning the digester at around 0.20 to 0.27 g-VS/L/day
achieved resilient and resistant operation at 1.01 g-VS/L/day. To overcome higher level of
disturbance, such as at 1.43 g-VS/L/day OLR of GIW from Wang et al. (2013), a
pre-conditioning treatment at 0.73 g-VS/L/day OLR of GIW was required. These two
observations from two independent studies using different GIW origins consistently revealed
that in order to allow better adapted digesters, it is recommended not to “jump too far” after
the cultivation period. A cultivation at 0.20 to 0.27 g-VS/L/day only allowed a “jump” of
0.7-0.8 VS/L/day OLR to achieve resilient and resistant GIW co-digestion at 1.01
g-substrate allowed development of microbial adaptation when the community shifts towards
the better adapted microorganisms (Zeeman et al., 1985; Chen et al., 2008; Palatsi et al.,
2010; Kougias et al., 2016) and reduction of substrate inhibition (Cavaleiro et al., 2009;
Kougias et al., 2016; Ziels et al., 2017). Our results indicated that a cultivation period for at
least one SRT cycle of 20 days and a “jump” of 0.7-0.8 g-VS/L/day OLR for each step
feeding is beneficial to increase community tolerance to GIW inhibitory effects and reduce
risks of overloading. Combined, our results showed that the differences in digester response
to an elevated GIW loading rates were determined by substrate selection (type of feed) and
pre-disturbance experience (intensity of preshocks).
Approaches to achieve resilient and resistant GIW co-digestion. Here we propose,
for the first time for GIW co-digestion, a “map” to achieve better performance and
robustness to GIW toxicity (Figure 4-5). First of all, the most convenient and widely
practiced measure to characterize GIW is biodegradable VS, compared to COD that is
relatively difficult to measure due to the nature of FOG. This map is created based on
performance data of VS basis. Second, comparing methane production and OLR of GIW
from different FOG sources, our results demonstrated the feasibility of this map as a
universal guidance suitable for different types of GIW origins. Third, our common garden
approach directly identified the importance of feed selection and the beneficial effect of
pre-disturbance experience using step feeding at the right dosing window to ensure resilient and
resistant GIW co-digestion. Fourth, we examined the difference of cultivation using