Galant: A Graph Algorithm Animation Tool
∗
Matthias Stallmann
†Jason Cockrell
Tynan Devries
‡Alexander McCabe
§Michael Owoc
¶June 13, 2014
Abstract
A host of algorithm animation programs have been developed over the years. Primarily these have been designed for classroom use and involve considerable overhead for the creator of the animations (an instructor or developer) — students are passive observers. We distinguish three primary roles: the observer, who simply watches an animation; the explorer, who is able to manipulate problem instances; and the animator, who designs an animation. A key feature of Galant1 is that it simplifies the role of the animator so that students can create their own animations by adding a few visualization directives to pseudocode-like implementations of algorithms. The focus on graph algorithms has two key advantages: (i) the objects manipulated in an animation all have the same type; and (ii) graphs are ubiquitous and therefore provide a framework for animations in domains beyond classic graph algorithms. Examples include search trees, automata, and even sorting.
Galant is also distinguished in that it is a tool rather than a closed system. In other words, it is designed to interact easily with other software such as text editors, other graph editors, other algorithm animation tools, graph generators, Java API’s, format translation filters and graph drawing programs. This interactivity significantly expands the range of Galant’s applications, including, for example, as a research tool for exploring graph algorithms.
1
Background
Algorithm animation has a long history, dating back at least as far as the work of Brown and Sedgewick [9,10] and that of Bentley and Kernighan [6] in the 1980’s. The BALSA software, devel-oped by Brown and Sedgewick, is a sophisticated system that provides several elaborate examples of animations, including various balanced search trees, Huffman trees, depth-first search, Dijkstra’s algorithm and transitive closure. The Bentley-Kernighan approach is simpler: an implementation of an algorithm is annotated with output directives that trace its execution. These directives are later processed by an interpreter that converts each directive into a still picture (or modification of a previous picture). These pictures are then composed into a sequence that can be navigated by the user.
In discussing algorithm animation software, we distinguish three primary roles: the observer, who
∗This work is the result of a senior design project at North Carolina State University, Department of Computer Science. The first author conceived and guided the project while the others provided the implementation details. We thank Dr. Robert Fornaro and Margaret Heil, the instructors, for coordinating the project(s) and providing instruction in communication skills, respectively. Ignacio Dominguez provided valuable technical support. An alpha testing version of the software is available on request.
†Matthias Stallmann, Department of Computer Science, North Carolina State University, Raleigh NC, 29695-8206. email: [email protected]
‡SAS Institute, Cary NC.
§Elsinore Technologies, Raleigh NC. ¶IBM, Durham NC.
1Aside from being an acronym, Galant is a term for a musical style that featured a return to classical simplicity after the complexity of the late Baroque era. We hope to achieve the same in our approach to algorithm animation.
simply watches an animation; theexplorer, who interacts with an animation by, for example, chang-ing the problem instance; and the animator, who designs an animation. The latter may also be referred to as adeveloper if the process of creating animations is integrated with that of implement-ing the animation system. An explorer is also an observer and an animator is both of the others. R¨ossling and Freisleben [23] articulate a similar classification of roles.
We also define an algorithm animation tool as animation software specifically designed to interact easily with other programs such as text editors, other graph editors, other algorithm animation tools, graph generators, Java API’s, format translation filters and graph drawing programs. A hypothesis, at least partially validated (using student attitude surveys [31]) posits that, while students acting as observers or explorers of animations may gain some benefit, a student who takes on the role of animator has a much richer learning experience. This hypothesis has become Galant’s major motivating factor — that it should simplify the task of the animator as much as possible while enhancing the ability to produce compelling animations.
2
Related work
There is a large variety of algorithm animations available. Here we focus solely on those that offer significant mechanisms for creating new animations. These differ primarily in (i) whether the user acts primarily as an observer; and (ii) the challenges imposed on the animator. Almost all of these are systems rather than tools. For a comprehensive survey of graph algorithm animation and graph drawing used as educational tools see Bridgeman [8].
Observer-oriented (passive) systems. One general purpose animation program is ANIMAL [23,
24]; it provides the animator with a rich menu of elements common to many algorithms. Steps in the animation are linked to steps in the pseudocode. Though there are many options for creating interesting animations, it appears that these are passive.
Galles [14] is an animation tool with very sophisticated creation options. Primarily designed to be passive, it could conceivably, with a parser for a graph input format and a mechanism that allows the user to view and manipulate the input graph, be made interactive. In that sense it would also be a tool. It suffers, however, from the fact that the animator must navigate a complex Java-based interface.
Although secondary to its main purpose as a library of data structures and algorithms, LEDA [22] offers a graph window facility that can be used to create animations of graph algorithms. The documentation gives several examples and illustrates the rich functionality of the drawing and visu-alization capability of graph windows. Since LEDA is a general purpose, C++-based, programming language for algorithms and data structures, it is easily augmented with extensions that are inte-grated seamlessly with the core API; in this case, graph windows work in concert with core graph functions and macros. Unfortunately LEDA is a commercial product with non-trivial licensing cost.
Explorer-oriented (interactive) systems. Several online applets feature graph algorithm an-imation. Of these, Javenga [32] stands out. It is highly interactive. The drawing and editing of graphs is simple and intuitive, and graphs can be viewed in all three major representations (draw-ing, adjacency matrix and adjacency list). The variety of graph algorithms available is impressive: breadth-first and depth-first search, topological sort, strongly connected components, four shortest path algorithms, two minimum spanning tree algorithms, and a network flow algorithm. Anima-tions can be run one step at a time with the option of moving backwards or continuously with an adjustable number of milliseconds per step. Javenga’s main drawback is that the explorer is unable to save graphs for future sessions.
only drawback is that there is no readily available mechanism for outsiders to create new animations. New animations are developer-created and released periodically.
Libraries. AlgoViz [1] is a large catalog of algorithm animations, continually updated by contribu-tors who either submit new animations or comment on existing ones. Like any large repository with many contributors, AlgoViz is difficult to monitor and maintain. The OpenDSA project [26,25,13] aims to create a textbook compilation of a variety of visualizations, mostly designed for observers.
Early work. Earlier animation tools/systems include GDR [29], John Stasko’s Tango [30], Xtango, and SAMBA,2 and, of course, the work of Brown and Sedgewick [9, 10] and that of Bentley and
Kernighan [6]. SAMBA, and to a lesser extent GDR, is especially notable for emphasis on simplifying the creation of animations so that students can easily accomplish them. Both are also tools by our definition. All of these suffer, however, from using old technology, and, except for GDR, they require off-line creation of problem instances and have no graph-algorithm specific implementations or graph creation interfaces to offer.
3
Galant features
Galant is based on GDR, which we discuss in Section 3.1. We then give an overview of Galant – Section 3.2. The most important aspect of Galant is the ability to create animations easily, as discussed in Section3.3. Then we give a brief overview of the user interface – Section 3.4; a more detailed description is given in AppendixB.
3.1 GDR: Galant’s predecessor
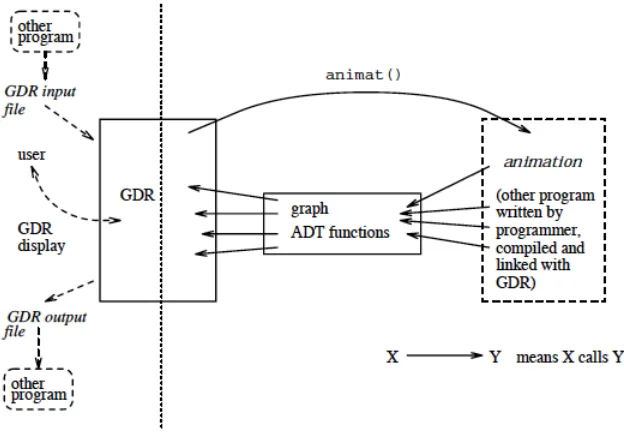
Galant is a successor to GDR [28,29] and has much of the same functionality. The design of GDR is illustrated in Fig. 1. To the left of the dotted line are the interactions with external entities, as supported by GDR. The GDR user, when running a specific animation created and compiled externally, acts as both the editor of problem instances and as initiator of an algorithm animation with which (s)he may then interact, i.e., plays the role of explorer and of observer. Input and output take the form of a simple text-based file format that can be manipulated outside of GDR via text filters, graph editors, graph drawing applications, etc. It is this external manipulation capability that makes GDR a tool rather than a closed system.
The animation creator writes a C program that interacts with a graph ADT whose functions access and/or modify both the internal representation of the graph and the user’s view of it. The ADT functions can be classified into one of three categories depending on the graph attributes accessed: (i)logical attributes — labels (and identities) of nodes and labels and endpoints of edges; (ii) geo-metricattributes — the positions of nodes and labels and inflection points of edges; and (iii)display
attributes — highlighting of nodes and edges, making labels visible/invisible, etc.
While GDR has much to recommend it when compared with other algorithm animation software, it suffers from some serious drawbacks:
• Each animation is a separate C program that interacts with an X11 window server. Therefore GDR is not portable.
• The user interface is crude. Aside from being black and white it has no file browser, no rubber-banding of moves, non-standard keyboard shortcuts and an unappealing look and feel.
Figure 1: GDR design.
Animations
(Java-like
pseudocode)
Graphs
(GraphML
or visual)
editing
(explorer)
viewing
(observer)
instance
generation,
e.g., random
graph
drawing
editing
(developer)
analysis/
visualization
printing
3.2 Galant overview
Fig.2gives an overview of Galant functionality. A graphical user interface (GUI) allows the user to edit both graphs and algorithm animations, either loaded as already existing files or newly created. At any point, the user can apply a selected animation to a selected graph for viewing. The animation program runs to completion and compiles a sequence of states (steps), each essentially a snapshot at a developer-defined break point. The user can then navigate the animation forward or backward one step at a time.
When editing a graph the user can create vertices and edges by clicking and/or moving the mouse, and can move vertices by dragging the mouse. There is also an interface for specifying labels, weights and colors for both edges and vertices. A preferences panel allows the user to select font size for labels and a variety of other options. Any changes to a graph are also reflected in a text (GraphML) representation of the graph, which can also be edited directly. Naturally the GraphML representation can also be created or edited externally: by a random or structured graph generator, by translation from another format, by directly editing the GraphML or by invoking a separate graph editor. Galant has a built-in force-directed drawing program (the one reported by Hu [20]) to position nodes automatically if so desired. Other drawing programs, such as those provided by GraphViz [18] and the huge body of research carried on by the graph drawing community [16], Another potential option for accessing graphs externally is to do the kind of detailed analysis performed by Gephi [15] and similar software.
Editing/compiling an algorithm animation is just like performing the same operations on a Java program. The compiler is essentially a Java compiler that compiles the algorithm code along with imported modules and a macro translator; the latter converts traversals of incidence lists and other lists of nodes or edges into the corresponding, more obscure, Java code. Because the functionality of the Galant editor is limited, it is usually more convenient to use an external program editor, reserving the Galant editor to make minor changes in response to compile-time or runtime errors. We use GraphML [17] as our graph representation because it is flexible, it can easily be extended, and parsers, viewers and translation tools are becoming more common. Because GraphML is specialized XML, parsers for the latter, based on the Document Object Model (DOM) can be used. These are available for many programming languages. Translators to other formats are also available or can easily be constructed. For example, the GraphViz [18] download provides one; unfortunately it preserves only the connectivity information. However, there is straightforward mapping between the GraphML attributes we use (positions of nodes and colors, etc., of nodes and edges) and the corresponding ones in GraphViz format. Translators to and from other formats are also available or can easily be constructed. We have written conversion scripts among the following formats: GraphML, gml [19], sgf, and dot (GraphViz [18]). The sgf (simple graph) format was devised by the first author as a lingua franca specific to layered graphs. It is similar to thegrformat used in the 9th DIMACS implementation challenge [12] except that layer and position are used instead of x- and y-coordinates and there are no weights on the edges. For historical reasons dot files are supplemented with ord files that give layer and position information for nodes – see Stallmann et al. [27]. The relevant scripts (some are in Python, others are shell scripts that invoke awk) are sgf2graphml.py, dot+ord2graphml (invokes a dot and ord to sgf C program as an intermediate step), graphml2dot, graphml2sgf, and sgf2dot+ord.
3.3 For the creator
Here Galant offers the most significant advantages over GDR and, a fortiori, over other algorithm animation software. Among these are:
• The API interface is simpler, due, in part, to the fact that the underlying language is Java rather than C.
• Each node and edge has both a weight and a label. Conversion of a weight to a number is automatic while labels are kept as text. The programmer can choose the appropriate attribute, which makes the implementation more transparent and devoid of explicit conversions.
• Most data structures are built in: stacks, queues, lists and priority queues of both edges and vertices. Priority queues implicitly use the weight attribute of the node/edge in question. The weight attribute is also used for sorting.
• An algorithm initially designed for directed graphs can usually be applied to undirected graphs (and get the desired interpretation) with no change in the implementation. This is useful, for example, when implementing Dijkstra’s algorithm or depth-first search.
• The interface that allows an explorer to edit graph instances can also be used to edit, compile, and run algorithm implementations. While initial creation and major edits are usually more convenient via a standard program editor offline, an algorithm window in Galant can be used to view the algorithm and make corrections in response to compile or runtime errors.
The philosophy behind the API design is that it should be usable by someone familiar with graph algorithms but only a rudimentary knowledge of Java (or any other programming language). The fact that Galant code resembles the pseudocode used in one of the most popular algorithm design and analysis texts, that of Cormen et al. [11], attests to the fact that we have succeeded.
A key advantage of the API design, not present in, for example, BALSA, is that it sits directly on top of Java. This allows the creator to develop arbitrarily complex algorithms using other Java class API’s and ones devised by the creator. More importantly, it allows Galant to offer significant new functionality provided by developers with only a modicum of Java training: sets of nodes and edges (in addition to the stacks and queues already built in) or significant infrastructure for algorithms in a specific domain.
3.4 The Galant user interface
Two windows appear when Galant is started: agraph window shows the current graph and atext window shows editable text. Depending on the currently selected tab in the text window, the text can be either a GraphML description of the current graph or an algorithm implementation. The user interface is designed for all three roles. The observer (or an instructor demonstrating an algorithm) does as follows: (a) loads a graph using the file browser; (b) loads an algorithm; (c) pushes the “Compile and Run” button; and (d) uses the controls underneath the graph window to step through the algorithm forward or backward as desired.
A typical explorer might edit or create a graph using the graph window and then follow steps (b)–(d), repeating steps (a) and (d) to try out different graphs. Saving graphs for later use is also an option. In addition, the explorer can use the graph’s tab in the text window to fine tune the placement of nodes or apply a force-directed graph drawing method (as described by Hu [20]) to adjust node placement.
4
Future work
Perhaps the most promising direction that our work on Galant can take is that of developing research applications. The benefits are twofold. First, Galant has the potential for providing a rich environ-ment for the exploration of new graph algorithms or developing hypotheses about the behavior of existing ones. Second, as Galant is augmented with the infrastructure for specific research domains (i.e., additional Java classes), some of the resulting functionality will no doubt be migrated into its core. Or the core will be enhanced to accommodate new capabilities.
One drawback of the current implementation is that an animation runs to completion before the user can interact with it. This precludes certain types of interactions. For example, one might want the user to be able to select the next node to visit during a depth-first search or a node to insert or remove during an animation of a binary search tree.
An algorithm implementation, despite the preprocessing we provide, still requires some undesirable Java-specific syntax and generates highly unfriendly error messages at both compile and runtime — the compiler, after preprocessing deals with raw Java code. Automatic insertion of semicolons at the ends of lines would prevent some of the strangest error messages. There are also serious issues with the use of global variables, e.g., a time stamp that is used to assign discovery and finish times for nodes in a depth-first search. The necessary (arcane) syntax for global variables could easily be provided. However, the ideal of completely programmer-friendly pseudocode would require the writing of a new compiler.
A key challenge confronting any developer of algorithm animation software is that of accessibility to blind users. Previous work addressed this via a combinationearcons3, spoken navigation and haptic
interfaces (see [3,4,5]). The resulting algorithm animations were developed for demonstration and exploration rather than simplified creation of animations. In theory any graph navigation tool can be extended, with appropriate auditory signals for steps in an animation, to an algorithm animation tool. The most promising recent example, due to its simplicity, is GSK [2]. Earcons can be added to substitute for state changes of nodes or edges.
A user study testing the hypothesis that student creation of animations promotes enhanced learning raises several nontrivial questions. Are we going to measure ability to navigate specific algorithms? Or a broader understanding of graphs and graph algorithms? Can we make a fair comparison that takes into account the extra effort expended by students to create and debug animations? Why incur the overhead of designing an experiment that is very likely to validate the obvious? Namely: in order to create a compelling animation, an animator must first decide what aspects of a graph are important at each step of an algorithm and then how best to highlight these. This two-stage process requires a longer and more intense involvement with an algorithm than mere exploration of an existing animation.
There are various implementation issues with and useful enhancements to the current version of Galant. These will be addressed in future releases. As new animations for teaching and research are created, other issues and desired enhancements will undoubtedly arise. The current implementation should be transparent and flexible enough to effect the necessary modifications — the most chal-lenging aspect of creating enhancements has been and continues to be the design decisions involved.
References
[1] AlgoViz,The Algorithm Visualization Portal. algoviz.org. 3
[2] S. Balik, S. Mealin, M. Stallmann, and R. Rodman,GSK: Universally Accessible Graph SKetching, in SIGCSE, 2013. 7
[3] N. Baloian and W. Luther, Visualization for the minds eye, in Software Visualization, no. 2269 in LNCS, 2002, pp. 354–367. 7
[4] N. Baloian, W. Luther, and T. Putzer, Algorithm explanation using multimodal inter-faces, in Proc. XXV Int. Conf. of the Chilean Comp. Soc., 2005. 7
[5] D. Bennett, Effects of navigation and position on task when presenting diagrams to blind people using sound, in Diagrams 2002, vol. 2317 of LNAI, 2002, pp. 161–175. 7
[6] J. L. Bentley and B. W. Kernighan,A system for algorithm animation: Tutorial and user manual, Computing Science Technical Report 132, AT&T Bell Laboratories, Jan. 1987. 1,3
[7] M. Blattner, D. Sumikawa, and R. Greenberg,Earcons and icons: Their structure and common design principles, Human Computer Interaction, 4 (1989), pp. 11–44. 7
[8] S. Bridgeman,Graph drawing in education, in Handbook of Graph Drawing and Visualization, R. Tamassia, ed., CCRC Press, 2013, ch. 24. 2
[9] M. H. Brown,Exploring algorithms with Balsa II, Computer, 21 (1988). 1,3
[10] M. H. Brown and R. Sedgewick, Techniques for algorithm animation, IEEE Software, 2 (1985), pp. 28–39. 1,3
[11] T. H. Cormen, C. E. Leiserson, R. L. Rivest, and C. Stein,Introduction to Algorithms, The MIT Press, third ed., 2009. 6,14,21
[12] DIMACS,9th Implementation Challenge. dis.uniroma1.it/challenge9/format.shtml. 5
[13] E. Fouh, M. Sun, and C. Shaffer, OpenDSA: A creative commons active-eBook. Poster presentation., SIGCSE, 2012. 3
[14] D. Galles, Data structure visualizations. www.cs.usfca.edu/∼galles/ visualization/Algorithms.html. 2
[15] Gephi,The open GraphViz platform. gephi.org. 5
[16] Internalional symposium on graph drawing. www.graphdrawing.org, 1992–2013. 5
[17] The GraphML file format. graphml.graphdrawing.org. 5
[18] GraphViz,Graph Visualization Software. www.graphviz.org. 5
[19] M. Himsolt,Gml: A portable graph file format, tech. rep., Universit¨at Passau, 1999. 5
[20] Y. Hu, Efficient, high-quality force-directed graph drawing, The Mathematica Journal, 10 (2006). 5, 6,20
[21] j-Algo: The algorithm visualization tool. j-algo.binaervarianz.de. 2
[22] K. Mehlhorn and S. N¨aher, LEDA: A Platform for Combinatorial and Geometric Com-puting, Cambridge University Press, 1999. 2
[23] G. R¨oßling and B. Freisleben,ANIMAL: a system for supporting multiple roles in algo-rithm animation, J. Visual Languages and Computing, 13 (2002), pp. 341–354. 2
[24] G. R¨oßling, M. Sch¨uler, and B. Freisleben,The ANIMAL algorithm animation tool, in ITCSE 2000, 2002. www.algoanim.info/AnimalAV/. 2
[26] C. Shaffer, T. Naps, and E. Fouh, Interactive textbooks for computer science education, in Proceedings of the Sixth Program Visualization Workshop, 2011, pp. 97–103. 3
[27] M. Stallmann, F. Brglez, and D. Ghosh, Heuristics, Experimental Subjects, and Treat-ment Evaluation in Bigraph Crossing Minimization, Journal on Experimental Algorithmics, 6 (2001). 5
[28] M. Stallmann, R. Cleaveland, and P. Hebbar, GDR: A visualization tool for graph al-gorithms, Tech. Rep. 91-27, Department of Computer Science, North Carolina State University, Raleigh NC 27695-8206, Oct. 1991. 3
[29] , GDR: A visualization tool for graph algorithms, in Computational Support for Discrete Mathematics, N. Dean and G. Shannon, eds., no. 15 in DIMACS Series in Discrete Mathematics and Theoretical Computer Science, March 1992, pp. 17–28. 3
[30] J. T. Stasko,Tango: A framework and system for algorithm animation, Computer, 23 (1990), pp. 27–39. 3
[31] ,Using student-built algorithm animations as learning aids, in SIGCSE, 1997, pp. 25–29.
2
[32] B. Thanasis,Javenga. users.uom.gr/∼thanasis/JAVENGA.html. 2
A
Animation examples
We now illustrate the capabilities of Galant by showing several examples.
A.1 Dijkstra’s algorithm
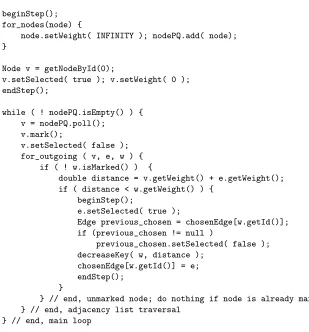
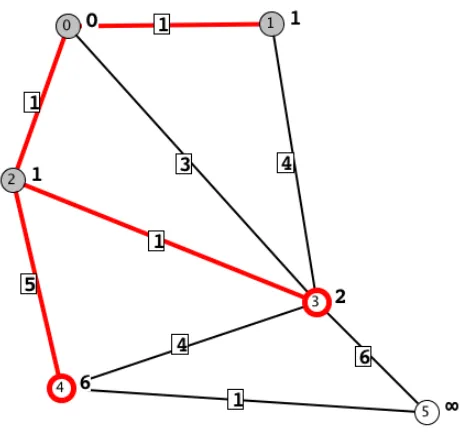
One of the simplest algorithms we have implemented is Dijkstra’s algorithm for the single source shortest paths problem. Fig. 3 shows most of the implementation of the animation of Dijkstra’s algorithm. At every step the nodes already in the shortest path tree arevisited (gray shading) and the nodes that have been encountered (but are not in the tree) areselected (thick red boundary).4
Selectededges(thick red) represent the current shortest paths to all encountered nodes; they are the edges of a shortest path tree when the algorithm is done. The same algorithm animation works for both directed and undirected graphs, as illustrated in Figs. 4 and5. The user can toggle between the directed and undirected versions of a graph via push of the appropriate button. The functions
beginStep andendStepdefine the points at which the exploration of the algorithm stops its forward or backward motion. In their absence, any state change (mark, select, change in weight, etc.) constitutes a step, which, in some cases, can force the user to do excessive “stepping” to move past uninteresting state changes.
The macro for outgoing(v, e, w) creates a loop whose body is executed once for each edge leading out ofv; in the body,e refers to the current edge andw to the other endpoint (any other variable names can be used). In an undirected graph the termoutgoing applies to all incident edges.5
The difference between what the algorithm does on a directed versus an undirected graph is evident in the figures. The edgefrom node 3 to node 2 in the directed graph becomes an edgebetween the two nodes in the undirected form of the same graph. Thus, in the undirected version, when node 2 is added to the tree it also causes the distance from the source, node 0, to node 3 to be updated, via the path through node 2. These snapshots come from the executions of thesame algorithm on
4Because these node and edge states both guide the logic of the algorithm and how the nodes/edges are displayed, the nomenclature has become awkward. A better way to handle the situation is to add initial declarations that specify color, thickness, and, in case of nodes, fill color, for each logical state. A logical state would have a name, e.g.,InTree, and be automatically provided with a setter (Boolean argument), e.g.,setInTree, and a logical test, e.g.,isInTree.
beginStep(); for_nodes(node) {
node.setWeight( INFINITY ); nodePQ.add( node); }
Node v = getNodeById(0);
v.setSelected( true ); v.setWeight( 0 ); endStep();
while ( ! nodePQ.isEmpty() ) { v = nodePQ.poll();
v.mark();
v.setSelected( false ); for_outgoing ( v, e, w ) {
if ( ! w.isMarked() ) {
double distance = v.getWeight() + e.getWeight(); if ( distance < w.getWeight() ) {
beginStep();
e.setSelected( true );
Edge previous_chosen = chosenEdge[w.getId()]; if (previous_chosen != null )
previous_chosen.setSelected( false ); decreaseKey( w, distance );
chosenEdge[w.getId()] = e; endStep();
}
} // end, unmarked node; do nothing if node is already marked } // end, adjacency list traversal
} // end, main loop
Figure 3: The implementation of the Dijkstra’ algorithm animation.
thesame graph. The only difference is that the explorer toggled from the directed to the undirected interpretation of the graph.
A.2 Kruskal’s algorithm
Another simple algorithm implementation is that of Kruskal’s algorithm for finding a minimum spanning tree (or forest) in a graph. Fig.6shows the implemented animation of Kruskal’s algorithm. Additional Galant features/workarounds illustrated here are:
• Use of the keyword function to declare a function: this avoids the syntactic complications of Java method declarations. In the case of FIND_SET, for example, you would normally have to say
static Node FIND_SET( Node x )
and would get error messages about non-static methods in a static context if you omitted the keywordstatic.
• Implicit use of weights to sort the edges: weights are created by the explorer when editing a graph. The only (syntactic) drawback is the required use of the Java Collections.sort()
construct, but this will be easy to fix in future releases. Another piece of awkward syntax is the template invocationList<Edge>; again, this is easily fixable.
• The ability to write messages during execution, as accomplished by the writeMessage calls. The syntax that requireswriteMessageto be a method of theGraphclass is awkward, but can be remedied by augmenting the macro translation mechanism.
Java-Figure 4: Dijkstra’s algorithm on a directed graph.
// parent in the disjoint set forest
final Node [] parent = new Node[ graph.numberOfNodes() ];
// standard disjoint set utilities; not doing union by rank or path // compression; efficiency is not an issue
function INIT_SET( Node x ) { parent[x.getId()] = x; }
function LINK( Node x, Node y ) { parent[x.getId()] = y; }
function Node FIND_SET( Node x ) { if (x != parent[x.getId()])
parent[x.getId()] = FIND_SET(parent[x.getId()]); return parent[x.getId()];
}
function UNION( Node x, Node y ) { LINK( FIND_SET(x), FIND_SET(y) ); }
for_nodes(u) { INIT_SET(u); }
List<Edge> edgeList = getEdges(); Collections.sort( edgeList );
int totalWeight = 0; for ( Edge e: edgeList ) {
beginStep();
Node h = e.getSourceNode(); Node t = e.getDestNode(); h.mark(); t.mark(); // for display purposes only endStep();
// if the vertices aren’t part of the same set if ( FIND_SET(h) != FIND_SET(t) ) {
// add the edge to the MST and highlight it e.setSelected( true );
UNION(h, t);
totalWeight += e.getWeight();
graph.writeMessage( "Weight so far is " + totalWeight ); }
else {
graph.writeMessage( "Vertices are already in the same component." ); }
beginStep(); h.unMark(); t.unMark(); endStep(); }
graph.writeMessage( "MST has total weight " + totalWeight );
(a) An edge is added to the tree.
(b) The current edge creates a cycle.
specific variant. With moderate effort the Galant preprocessor could be augmented to provide a more transparent syntax, such as
Node array parent[Node]
The underlying implementation could either be a map (associative array) or an array with integer indices but with nodes automatically converted to their id’s so that a reference to an element would always beparent[x]rather thanparent[x.getId()]. In this specific situation – implementation of disjoint set union – the need for the array can be obviated by providing disjoint sets as a built-in data structure.
Two steps in the execution of the animation are shown in Fig.7. The two endpoints of an edge are marked when that edge is considered for inclusion in the spanning tree. If the endpoints are not in the same tree, the edge is added and highlighted and the cost of the current tree is displayed in the message. Otherwise the message reports that the endpoints are already in the same tree.
A.3 Depth-first search (directed graphs)
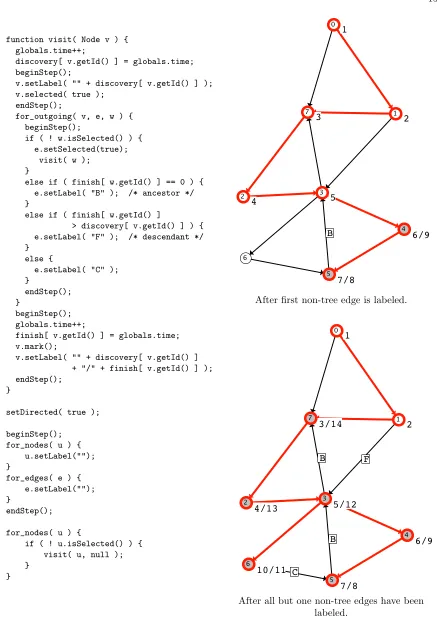
Fig.8illustrates an animation of depth-first search. The code and definitions follow those of Cormen et al. [11]. Tree edges are highlighted (selected) and non-tree edges are labeled as Back edges,
Forward edges orCross edges. White nodes, not yet visited, are neither highlighted (selected) nor marked; Gray nodes, visited but the visit is not finished, are highlighted only; and black nodes, visit is completed, are both highlighted and marked. Labels on nodes indicate the discovery and finish times, separated by a slash.
The setDirected(true) statement ensures that the graph is displayed and treated as a directed graph. For depth-first search, unlike Dijkstra’s algorithm, we need to write a different algorithm/animation to deal with the special case that arises because tree edges are also back edges when regarded as bidirectional.
As with Kruskal’s algorithm, the handling of global variables is awkward. But here, the global variable time cannot be declared final since that would prevent any changes to its value. The workaround, not shown in the figure due to space constraints, is:
class GlobalVariables { public int time; }
final GlobalVariables globals = new GlobalVariables();
This is yet another case where some macro preprocessing could make global variables mare trans-parent. A useful construct might be along the lines of
globals { int time;
// and, using the syntax suggested in the discussion of Kruskal’s algorithm int discovery[ Node ];
int finish[ Node ]; }
And then the preprocessor could do the necessary conversion, making, among other things, the use of simplytimeinstead ofglobals.timepossible.
A.4 Insertion sort
function visit( Node v ) { globals.time++;
discovery[ v.getId() ] = globals.time; beginStep();
v.setLabel( "" + discovery[ v.getId() ] ); v.selected( true );
endStep();
for_outgoing( v, e, w ) { beginStep();
if ( ! w.isSelected() ) { e.setSelected(true);
visit( w ); }
else if ( finish[ w.getId() ] == 0 ) {
e.setLabel( "B" ); /* ancestor */
}
else if ( finish[ w.getId() ]
> discovery[ v.getId() ] ) {
e.setLabel( "F" ); /* descendant */
} else {
e.setLabel( "C" ); }
endStep(); }
beginStep(); globals.time++;
finish[ v.getId() ] = globals.time; v.mark();
v.setLabel( "" + discovery[ v.getId() ] + "/" + finish[ v.getId() ] ); endStep();
}
setDirected( true );
beginStep(); for_nodes( u ) {
u.setLabel(""); }
for_edges( e ) { e.setLabel(""); }
endStep();
for_nodes( u ) {
if ( ! u.isSelected() ) { visit( u, null ); }
}
After first non-tree edge is labeled.
After all but one non-tree edges have been labeled.
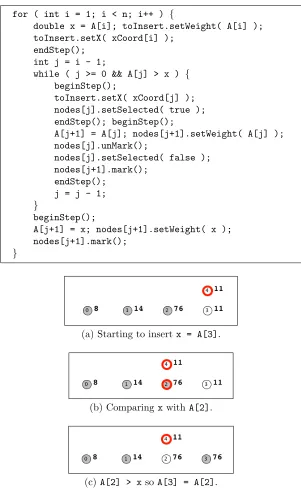
for ( int i = 1; i < n; i++ ) {
double x = A[i]; toInsert.setWeight( A[i] ); toInsert.setX( xCoord[i] );
endStep(); int j = i - 1;
while ( j >= 0 && A[j] > x ) { beginStep();
toInsert.setX( xCoord[j] ); nodes[j].setSelected( true ); endStep(); beginStep();
A[j+1] = A[j]; nodes[j+1].setWeight( A[j] ); nodes[j].unMark();
nodes[j].setSelected( false ); nodes[j+1].mark();
endStep(); j = j - 1; }
beginStep();
A[j+1] = x; nodes[j+1].setWeight( x ); nodes[j+1].mark();
}
(a) Starting to insert x = A[3].
(b) ComparingxwithA[2].
(c)A[2] > xsoA[3] = A[2].
element to be inserted at each outer-loop iteration. The rest of the code is a classic insertion sort implementation: nodes behave as if they were array positions; those in the already sorted part of the array are marked; a node that is being compared withxis highlighted (selected).
B
User documentation
This documentation gives instructions for interacting with the Galant GUI interface.
B.1 Overview
Galant provides three major components across two screens:
1. a text screen that can serve two distinct purposes –
(a) as an editor of algorithms
(b) as an editor of GraphML representations of graphs
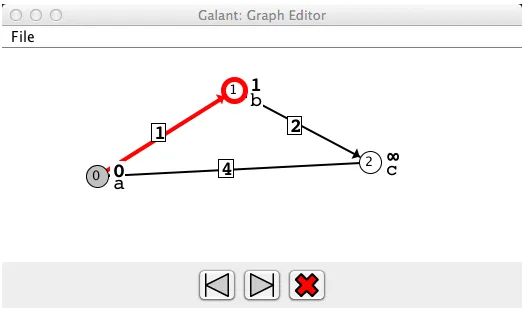
2. a graph screen that displays the current graph (independent of whether the text screen shows an algorithm or the GraphML representation of the graph)
It should be noted that it is usually more convenient to edit algorithms offline using a program editor and to use the visual editor only to edit graphs – one exception is when a precise lining up of node positions is desired.
These components operate in two modes: edit mode and animation mode. Edit mode allows the user to modify graphs – see Sec. B.3, or algorithms – see Sec. B.4. Animation mode disables all forms of modification, allowing the user to progress through an animation by stepping forward or backward, as described in Sec.B.5.
B.2 Workspace
Opened graph and algorithm files are displayed in the text screen, which has tabs that allow the user to switch among different algorithms/graphs. New algorithms can be created using the “page” icon at the top right of the screen and new graphs using the graph/tree icon to the left of that. More commonly, algorithm and graph files are loaded via the File->Open browser dialog. The
File drop-down menu also allows saving of files and editing preferences. Algorithm files have the extension.algand graph files the extension .graphml.
B.3 Graph editing
Graphs can be edited in their GraphML representation using the text screen or visually using the graph screen. These editors are linked: any change in the visual representation is immediately reflected in the text representation (and will overwrite what was originally there); a change in the GraphML representation will take effect in the visual representation when the file is saved.
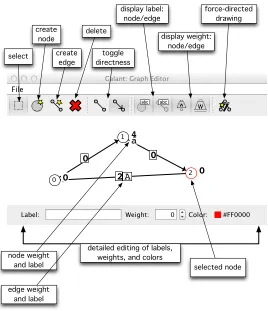
An improperly formatted GraphML file loaded form an external source will show as blank in the text window – unfortunately there is no error reporting in the current Galant implementation. The graph screen, as illustrated in Fig.10has a toolbar with four sections:
select create
node create
edge delete
toggle directness
display label: node/edge
display weight: node/edge
force-directed drawing
detailed editing of labels, weights, and colors node weight
and label
edge weight and label
selected node
Figure 10: The Galant graph screen with annotations.
Figure 12: The text screen showing Dijkstra’s algorithm.
Figure 13: The text screen when Dijkstra’s algorithm is running.
• Select. A mouse click selects the graph component with highest precedence. If the compo-nent is a node, it is shaded; if it’s an edge, it turns blue. The inline editor at the bottom of the graph screen allows editing of the component’s label, weight, and color.
• Create node. A node is created at the location of a mouse click if there is not already a node there. If another node is present it is simply selected.
• Create edge. Two clicks are required to create an edge. The first falls on the desired source node and the second on the destination node. The line representing the edge is shown after the first click. If the first click does not land on a node, no edge is created. If the second click does not land on a node, creation of the edge is canceled.
• Delete. A mouse click deletes the highest-precedence component at the mouse location. If a node is deleted, all of its incident edges are deleted as well.
2. Directedness toggles – These change both the interpretation and the display of the graph between directed and undirected. Pressing the undirected (line between two dots) button causes all edges to be interpreted as undirected: this means that, when the code calls for all incoming/outgoing edges, all incident edges are used. Undirected edges are displayed as simple lines.
Pressing the directed (line with arrow) button causes the macrosfor incoming,for outgoing, and for adjacent to have three distinct meanings (they are all the same for undirected graphs): Incoming edges have the given node as destination, outgoing as source, and adja-cent applies to all incident edges.
3. Display toggles – The four display toggles turn on/off the display of node/edge labels and node/edge weights. A shaded toggle indicates that the corresponding display is on. When Galant is executed for the first time, all of these areon, but their setting persists from session to session.
4. Force directed drawing button – Applies Hu’s force directed algorithm [20] to the graph.
Caution: this operation cannot be undone.
B.4 Algorithm editing
Algorithms can be edited in the text screen. The editor uses Java keyword highlighting (default blue) and highlighting of Galant API fields and methods (default green). Since the current algorithm editor is fairly primitive (no search and replace, for example), it is more efficient to edit animation code offline using a program editor – for example emacswith Java mode turned on. The Galant editor is, however, useful for locating and correcting minor errors. For more details on how to compose animation code, see the programmer guide (SectionC).
B.5 Animating algorithms
To animate an algorithm the code for it must be compiled and then run via the algorithm controls – the bottom tabs on the text screen shown in Figs.12 and13. The algorithm runs on the active graph, the one currently displayed on the graph screen. If there are errors in compilation these will show up on the console (terminal from which Galant was run) – this will be fixed in later revisions. Runtime errors open a dialog box that allows the user to ask for more details and decide whether to exit Galant or not.
During the execution of the animation, all graph editing functions are disabled. These are re-enabled when the user exits the animation by pressing the redXbutton.
B.6 Preferences
Galant preferences can be accessed via theFile->Preferencesmenu item or by using the keyboard shortcut Ctrl+Shift+P (Cmd+Shift+P for Mac). Preferences that can be edited are:
• Default directories for opening and saving files (Open/Save).
• Directory where compiled animation code is stored (Compilation).
• Font size and tab size for text screen editing (Editors).
• Colors for keyword and Galant API highlighting (Algorithm Editor).
• Color for GraphML highlighting (Textual Graph Editor).
• Edge width (Visual Graph Editor).
C
Programmer guide
Animation programmers can write algorithms in notation that resembles the pseudocode in Cormen et al. [11]. Java-like syntax is used throughout, e.g., node methods are called usingv.m(), wherev
is an object of type Nodeandmis a method. The graphobject is implicit — sograph.m()can be rendered simply asm().
Central to the Galant API is thegraphobject: currently all other parts of the API refer to it. The components of a graph are declared to be of typeNode orEdgeand can be accessed/modified via a variety of functions/methods. When an observer or explorer interacts with the animation they move either forward or backward one step at a time. All aspects of the graph API therefore refer to the currentstate of the graph, the set of states behaving as a stack. API calls that change the state of a node or an edge automatically generate a next step, but the programmer can override this using a
beginStep()and endStep()pair. For example, the beginning of our implementation of Dijkstra’s algorithm looks like
beginStep(); for_nodes(node) {
node.setWeight( INFINITY ); nodePQ.add( node);
}
endStep();
Without the override this initialization would require the observer to click through multiple steps (one for each node) before getting to the interesting part of the animation.
Functions and macros of the API are listed below.
C.1 Graph methods
Each node and edge has a unique integer id. The id’s are assigned consecutively as nodes/edges are created and may not be altered. The id of a node or edge can be accessed via thegetId()method.
• setDirected(boolean b)causes the graph to be displayed and treated as directed (b = true) or undirected (b=false); this function can only be applied once at the beginning of the ani-mation. It is useful, e.g., for minimum spanning tree algorithms (b = false) or for depth-first search to find strongly connected components (b = true).
• getNodes()returns a list of nodes of the graph; the return type is the Java templatedList<Node>; this should be replaced by a Galant-native equivalent in a future version
• for_nodes( node )andfor_edges( edge )circumvent the need to deal with Java templated list objects. Their syntax is:
for_nodes( node ) {block of code that uses node}(Note: nodeneed not be declared.) and the corresponding forfor_edges.
• getNodeById(id) returns the node with the given integer id or null if none exists; the only obvious use isgetNodeById(0) to specify node 0 (the first node created) as the start node for algorithms that require one. GDR also has a mechanism that prompts the user to select a node by clicking on it; because Galant runs animations to completion before allowing the user to step forward and backward, this type of interaction is not possible.
• getEdgeById(id)returns the edge with the given integer id or null if none exists; it is not clear that this has any use.
• select(Node n)makes nodenthe sole highlighted/selected node
• Node addNode()returns a new node and adds it to the list of nodes; attributes take on default values; weight, label, and position are absent and must be set explicitly by appropriate method calls.
• addEdge(Node source, Node target)adds an edge from the source to the target (source and target are immaterial when graph is undirected). There is also a variation with integer arguments that represent the id’s of the nodes. AS in the case of nodes, the edge is added to the list of edges and its weight and label are absent.
C.2 Node and edge methods
Nodes and edges have ‘getters’ and ‘setters’ and setters for a variety of attributes, i.e., seta([a0s type] x)and [a0stype] geta). In addition there are the usual methods one would expect from a graph API.
Logical attributes: functions and macros
From a node’s point of view we would like information about the adjacent nodes and incident edges. The relevant methods require the use of Java generics, but macros are provided to simplify graph API access. The macros, which have equivalents in GDR, are:
• for adjacent(Node x, Edge e, Node y){ statements } executes the list of statements for each edge incident onx. The statements can refer tox, ore, the current incident edge, ory, the other endpoint of e.
• for outgoing(Node x, Edge e, Node y){ statements }
behaves like for adjacent except that, when the graph is directed, it iterates only over the edges whose source isx(it still iterates over all the edges when the graph is undirected).
• for incoming(Node x, Edge e, Node y){ statements }
behaves like for adjacent except that, when the graph is directed, it iterates only over the edges whose sink is x(it still iterates over all the edges when the graph is undirected).
The actual API methods hiding behind these macros are (these are Node methods):
• List<Edge> getIncidentEdges()returns a list of all edges incident to this node, both incoming and outgoing.
• List<Edge> getOutGoingEdges() returns a list of edges directed away from this node (all incident edges if the graph is undirected).
• List<Edge> getIncomingEdges()returns a list of edges directed toward this node (all incident edges if the graph is undirected).
• Node travel(Edge e)returns the other endpoint of e. The logical edge methods are:
• getOtherEndPoint(Node u) returnsvwhere this edge is eitheruvorvu.
Nodes and edges also have a mechanism for setting (and getting) arbitrary attributes of type Integer, String, and Double. the relevant methods aresetIntegerAttribute(String key,Integer value)
to associate an integer value with a node and Integer getIntegerAttribute(String key) to retrieve it. String and Double attributes work the same way as integer attributes. These are useful when an algorithm requires arbitrary information to be associated with nodes and/or edges. Note that each individual node may have different attributes.
Geometric attributes
Currently, the only geometric attributes are the positions of the nodes. The edges are all straight lines and positions of labels are fixed. The relevant methods for nodes areint getX(),int getY(), and
Point getPosition()for the ’getters’. To set a position, one should use eithersetPosition(Point)
orsetPosition(int,int). However, once a node has an established position, it is possible to change only one coordinate usingsetX(int)orsetY(int).
Display attributes
Each node and edge has both a (double) weight and a label. The weight is also a logical attribute in that it is used implicitly as a key for sorting and priority queues. The label is simply text and may be interpreted however the programmer chooses. Both weight and label have values to indicate their absence: Double.NaN (not a number) in the case of weights, null in the case of labels. In either case the weights/labels are not displayed. Aside from the setters and getters: setWeight(double),
double getWeight(),setLabel(String), andString getLabel(), the programmer can also ma-nipulate and test for the absence of weights/labels usingclearWeight()andboolean hasWeight(), and the corresponding methods for labels.
Nodes can either be plain, highlighted (selected), marked (visited) or both highlighted and marked. Being highlighted alters the the boundary (color and thickness) of a node (as controlled by the implementation), while being marked affects the fill color. Edges can be plain or selected, with thickness and color modified in the latter case.
The relevant methods are:
• highlight(),unHighlight(), andboolean isHighlighted()
• correspondingly,setSelected(true),setSelected(false), andboolean isSelected() • mark(), unMark(), and boolean isMarked()
• correspondingly,setVisited(true),setVisited(false), and boolean isVisited()
Although the specific colors for displaying selected nodes or edges are predetermined, the animation implementation can modify the color of a node boundary or an edge, thus allowing for many different kinds of highlighting (as opposed to just one in GDR). The setColorand getColormethods use String arguments using the RGB format“#RRGGBB”; for example, the string#0000ffis blue. Of the attributes listed above, weight, label, color and position can be accessed and modified by the user as well as the program. In all cases, modifications by execution of the animation are ephemeral — the graph returns to its original state after execution.
C.3 Additional programmer information
One awkward feature of Galant’s implementation is that global variables must be declared final. For arrays and other structures this is not a problem, except for the annoyance of the syntax. So, for example,
will work as expected: the entries oftheArraycan be modified as the animation progresses. Not so with scalars. The workaround is along the lines of
class GlobalVariables { public int myInt; public double myDouble; }
final GlobalVariables globals = new GlobalVariables();