More likely than not, large, complex, first-of-a-kind (FOAK) industrial projects will not be completely successful. These projects tend to fail by overrunning schedule estimates, outspending cost estimates, and failing to meet estimated production levels. There are many contributing factors as to why these projects fail; some of the major factors include: changes in the political/regulatory environment, loss of market potential, changes of project scope during construction, and the use of immature and untested process technologies. This
research takes an in-depth look into how to eliminate or mitigate the effects of immature and untested technologies through a rigorous technology development framework integrated into front-end planning models.
Novel technologies cause project failures due to a lack of requisite “basic data” that has not been accrued before a project enters its execution phase. Basic data is any
physiochemical, thermodynamic, or process-specific information required to make a fully-informed design. A rigorous technology development process garners required basic data in a methodological manner in order to support the robust detailed design of a project. In the presented framework, basic data is fed forward from the conceptual stage of a technology’s development through various scales of testing, in order to reduce possible technology failures at full-scale applications.
complex, first-of-a-kind projects may reduce the risk of project failure before project execution.
In addition to discussing the combined approach of technology development and FEP, a case study was conducted to examine how the United States Department of Energy Office of Environmental Management performs according to the proposed methodology. A survey of project personnel who worked on first-of-a-kind nuclear waste treatment facilities and a review of the Department of Energy’s procedures were conducted in order to understand how, when, and why technology development and front-end planning are integrated, if at all. The case study revealed that the Department of Energy has a strong background in early project planning, but does not effectively and consistently develop novel technologies. Although the main procedure for project acquisition is well structured, the application of that method falls short and is swayed by non-technical and outside factors.
The main recommended action for the Department of Energy Office of
by
Gregory Scott Adams
A thesis submitted to the Graduate Faculty of North Carolina State University
in partial fulfillment of the requirements for the degree of
Master of Science
Civil Engineering
Raleigh, North Carolina 2016
APPROVED BY:
_______________________________ Edward Jaselskis, Ph.D.
Committee Chair
_____________________________ Abhinav Gupta, Ph.D.
DEDICATION
BIOGRAPHY
I, Gregory Adams, am a master’s student in the Department of Civil, Construction, and Environmental Engineering at North Carolina State University. I completed my Bachelors of Science in Civil Engineering with a concentration in Structures in May 2014, graduating Magna Cum Laude, at North Carolina State University. While at North Carolina State University, I was an active member of the Student Chapter of the American Society of Civil Engineers, the steel bridge team, the concrete canoe team, and of Delta Upsilon Fraternity. I grew up and attended high school in Western North Carolina.
Professionally, I have had the following opportunities: Summer Intern; CommScope, Inc.; Statesville, NC
Civil Design Intern; Duke Energy; Catawba Nuclear Station, York, SC Undergraduate Research Assistant; North Carolina State University;
Constructed Facilities Lab under Dr. Tasnim Hassan, Raleigh, NC
Rapid Response Design Intern; Duke Energy; Harris Nuclear Plant, New Hill,
NC
Structural Engineering Intern; Stewart Engineering; Raleigh, NC
ACKNOWLEDGMENTS
I would like to thank all of the faculty and staff in the Department of Civil, Construction, and Environmental Engineering at North Carolina State University for providing all of your students a challenging, engaging, and inspiring learning environment. In particular, I would like to thank Dr. Jim Nau, Dr. Vernon Matzen, Dr. Tasnim Hassan, Dr. John Stone, and Mr. Steve Welton for being great teachers and even greater mentors.
In addition, I would like to thank the following for their contributions to this project: The United States Department of Energy Office of Environmental
Management Mr. Jim Rispoli Mr. Chip Lagdon Mr. John Shultz Mr. Steve Schneider Mr. Jack Surash Mr. Jim Owendoff
I would like to thank Dr. Edward Jaselskis, Dr. Abhinav Gupta, and Dr. Alex Albert for being members of my research committee. Especially, I would like to thank Dr. Jaselskis for providing guidance, insight, and assistance from the conception to completion of this project. It really was OJT!
TABLE OF CONTENTS
LIST OF TABLES ... vii
LIST OF FIGURES ... viii
LIST OF ACRONYMS ... ix
INTRODUCTION ... 1
What Are First-of-a-Kind Projects? ... 1
Problem Statement ... 2
Hypothesis... 3
Objectives ... 4
Benefactors of this Research ... 4
Scope of the Study ... 5
RESEARCH METHODOLOGY... 6
Literature Review... 6
Combining Processes ... 7
Department of Energy Case Study ... 7
LITERATURE REVIEW ... 9
TECHNOLOGY DEVELOPMENT ... 17
Defining Technology Development ... 17
Characterizing Basic Data ... 19
Scales of Technology Development ... 21
Hierarchy of Process Systems ... 25
Integrated Systems Check ... 26
Technology Readiness Levels and Assessments ... 28
The Importance of Evaluations ... 29
... 31
Using Technology Readiness to Tailor Technology Development ... 32
Which Critical Technology Elements Need Development? ... 33
FRONT-END PLANNING ... 35
Developing the Business Case ... 35
Completing the Project Scope ... 37
COMBINING FRONT END PLANNING AND TECHNOLOGY DEVELOPMENT ... 41
From Ideation to FEP-1 ... 42
From FEP-1 to FEP-2 ... 43
From FEP-2 to FEP-3 ... 47
Project Execution, Completion, and Initial Operations ... 47
CASE STUDY ... 49
DOE Procedures Review ... 50
Select Project Performance Review ... 55
Survey Results ... 56
Study Findings ... 63
Recommended Actions ... 66
RESEARCH SUMMARY AND CONCLUSION... 71
Summary of Findings ... 71
Validation of Findings ... 71
Limitations of Findings ... 71
Future Research Topics... 72
Conclusions ... 74
REFERENCES ... 75
APPENDICES ... 78
Appendix A – U.S. DOE TRL Definitions ... 79
Appendix B – U.S. DOE Office of Environmental Management Survey ... 81
LIST OF TABLES
Table 1: Types of Knowledge Gaps, Risks, and Knowledge Generation Plans ... 14
Table 2: Examples of Basic Data ... 20
Table 3: Example Scale-up Factors ... 22
Table 4: Description of Technology Readiness Levels ... 29
Table 5: Groups Represented in Front-End Planning Team ... 36
LIST OF FIGURES
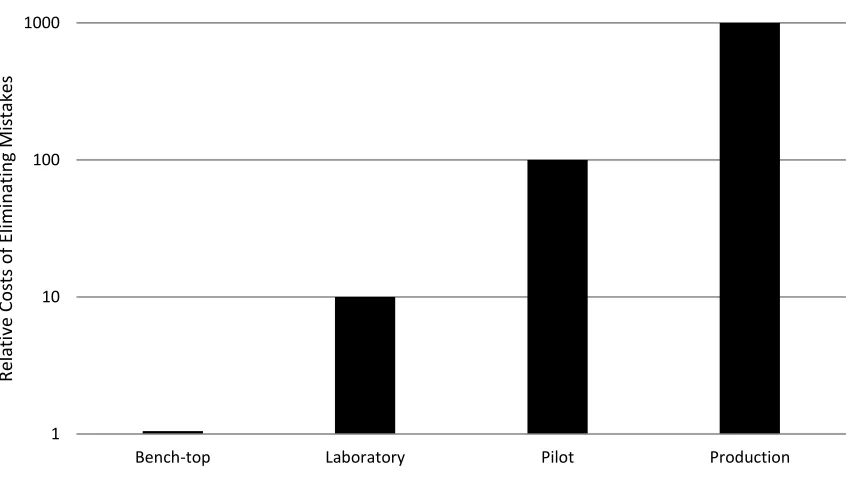
Figure 1: Relative costs of fixing mistakes by development stage ... 18
Figure 2: Scales of Technology Development ... 21
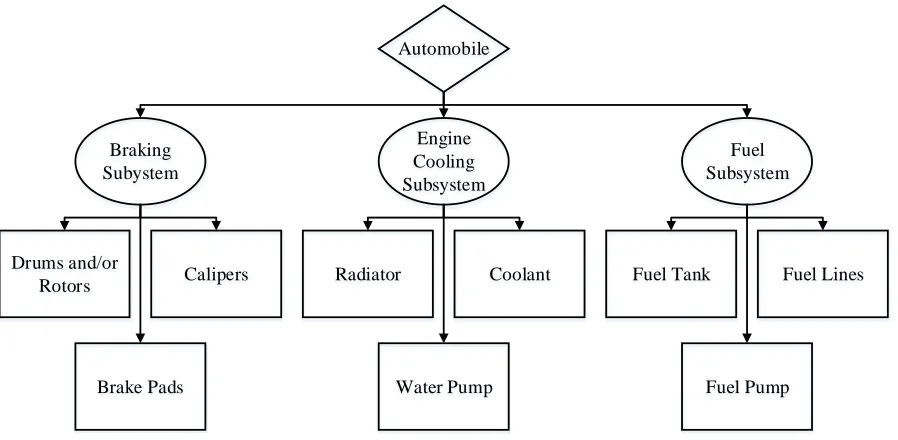
Figure 3: Hierarchy of Automobile System ... 25
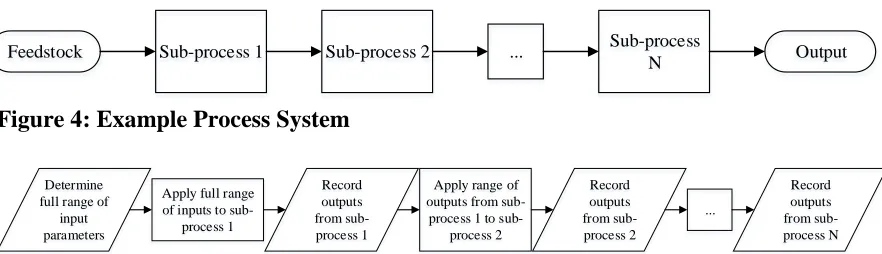
Figure 4: Example Process System ... 28
Figure 5: Methodology for Integrated Systems Check without Full-Process System ... 28
Figure 6: Relationship between Technology Development Rigor and Amount of Information Missing ... 31
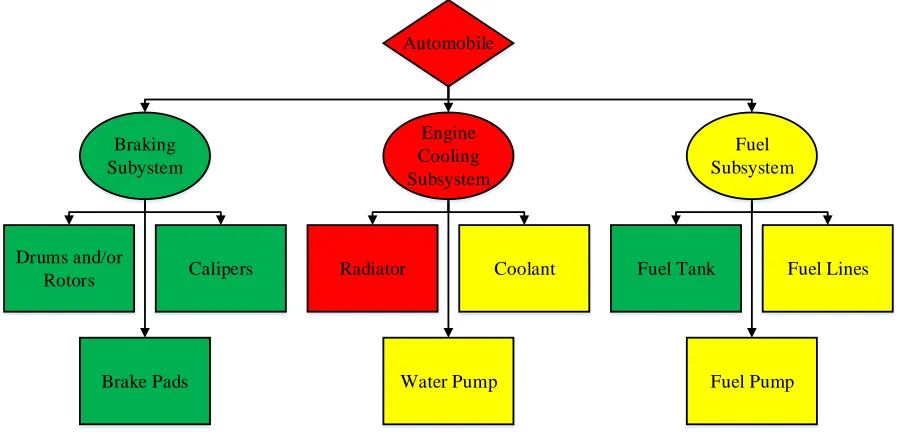
Figure 7: Tailoring of Example Automobile System ... 32
Figure 8: Front-End Planning Organization and Placement within Project Timeline ... 35
Figure 9: Technology Readiness Level vs. Project/Front-End Planning Phase... 41
Figure 10: Influence and Cost versus Time ... 45
Figure 11: DOE Critical Decision Process and Project Phases ... 51
Figure 12: DOE Recommended Technology Readiness Level vs. Critical Decision Step .... 53
LIST OF ACRONYMS CD Critical Decision
CII Construction Industry Institute CTE Critical Technology Element
DOD [United States] Department of Defense DOE [United States] Department of Energy
EM [DOE] Office of Environmental Management FEP Front-End Planning
FPD Federal Project Director FOAK First-of-a-Kind
GAO [United States] Government Accountability Office IPT Integrated Project Team
IWTP Integrated Waste Treatment Project JPL Jet Propulsion Laboratory
NASA National Aeronautics and Space Agency NCSU North Carolina State University
PFD Process Flow Diagram SME Subject-Matter Expert SRS Savanah River Site
INTRODUCTION
In 1903, the history of mechanized, human flight began with the successful flight of Orville and Wilbur Wright’s bi-plane in Kitty Hawk, North Carolina. However, their success on that day was due to years of gradual technological development. The two brothers first had a concept. Then, they did progressively larger tests, from kites to manned gliders, to further develop their concept. Finally, history was made when they put all of the pieces together into a full-scale, powered plane that flew for over 100 feet (U.S. National Parks Service 2016).
As with the novel project that the Wright Brothers undertook at the turn of the 20th century, first-of-a-kind projects take substantial amounts of time and money to accomplish. In fact, most industrial megaprojects consume more time and money than initially estimated (Merrow 2011). This failure of projects to succeed can be attributed to many factors, including changes in the socio-political climate, poor initial estimates, a lack of process data at the onset of project execution, and sheer bad luck. There are many additional reasons as to why these novel projects may fail, where failure is defined as a project exceeding either estimated cost, schedule, or both. This leads to the essential question, why do first-of-a-kind projects fail and what measures can be taken to improve their outcomes?
What Are First-of-a-Kind Projects?
technology or idea which can perform a process more quickly, safely, cost-effectively, and/or with less by-products. Newly created products can be slightly or vastly different than previous products; therefore, the process to create a new product should be different as well. The march of technology and the differences in products are the primary reasons why first-of-a-kind (FOAK) projects are attempted. First-of-a-kind projects are those that use one or more new technologies, use an existing technology in a novel way, and/or adapt a technology from a different application to the intended project.
Problem Statement
Some projects fail, grand projects fail on a grand scale, and FOAK projects fail in FOAK ways. For the large industrial projects studied by Merrow, the projects were either a success or a very poor failure, with little to no projects in the middle range (Merrow 2011). The problem can then be posed as: why do large, complex, FOAK projects fail? Why do these projects, in particular, tend to overrun their cost and schedule estimates and demonstrate production performance at a level substantially less than designed? Just as important as addressing the causes of project failure are possible solutions for project teams to reduce the risk of failure.
areas,” in which a project may be successful in one or two aspects but not all three, in general, projects tend to either be complete successes or fantastic failures. This effect is called the
Jemima Principle, from the little girl in Longfellow’s poem “There was a little girl,” but the
principle is outside the scope of this research (Merrow 2011).
Two examples of notable failed FOAK projects are the current construction of Units 3 and 4 at Vogtle Electric Generating Plant (also known as Plant Vogtle) in Waynesboro, GA, and the completed construction of Boston’s Central Artery Project, better known as the “Big Dig.”Plant Vogtle Units 3 & 4 had an initial cost estimate of $4.4 billion and completion date of April 2016 and 2017, respectively. As of August 2015, the estimated completed cost was over $5 billion and the estimated completion dates had been pushed back to June 2019 and 2020, respectively (Brown 2015). Cost and schedule increases have been associated with design changes and their requisite certification and delays in construction (Georgia Power 2015). The Big Dig was completed in December 2007 at a cost of over $14.6 billion, but was estimated to cost only $2.8 billion in 1982, which would be $6.0 billion in 2006 dollars. Some of the challenges to execution involved both leaks in the walls of the tunnel and a collapse of concrete panels in 2006 (Le Blanc 2007).
Hypothesis
can disappear, leading to changes in project economics; among a multitude of other factors causing project failure. There are factors that a project team can control, such as design, and factors beyond their control, such as the weather. The integration of a structured front-end planning (FEP) process, which examines all aspects of a project prior to project execution, and a rigorous technology development process, in which a novel concept is studied at growing scales to learn the basic data for the technology, can be used to reduce the risk of project failure.
Objectives
There are three main objectives for this research. First, as much has been written on the concepts of FEP and technology development, the integration of FEP and technology development for project planning will be explored on a conceptual level. This will require a discussion of both subjects and the details of their cooperation. Second, the potential success of combining FEP and technology development will be evaluated by subject-matter experts (SMEs). The final objective of this research is to conduct a case study to investigate the proposed integration of FEP and technology development.
Benefactors of this Research
presented here may be applicable to other endeavors in which high levels of uncertainty and of uncertainty-related risk are present, such as business start-ups and large mega- and gigaprojects.
Scope of the Study
RESEARCH METHODOLOGY
To complete complex, FOAK projects, planning on the front-end is key to success (Merrow 2011). The overall methodology of this study is to gather information on the subjects of technology development and front-end planning, process that information and evaluate their integration, and perform a case study based on these findings. As with any other lengthy project, these steps can be seen as discrete and sequential, but some steps occur simultaneously and share activities. The following discussion is a more detailed look into the aforementioned steps.
Literature Review
Combining Processes
After a review of the concepts of FEP and technology development, the process of combining them could take place. Although there are elements of each idea present in the other, determining the best approach to their integration was crucial. Because this study’s hypothesis holds that both FEP and technology development should happen concurrently, it was also important to identify which stage of technology development should be reached before proceeding to the next stage of FEP. Finally, a model was developed that outlines the use of both FEP and technology development.
Department of Energy Case Study
After a combined framework was established, the researchers conducted an examination of the performance of DOE EM projects. The DOE EM already has a protocol in place that contains elements similar to the FEP and technology development processes. However, since their FOAK projects have a relatively high failure rate, it is reasonable to assume that gaps remain in either their protocols and/or implementation processes. An analysis was performed to find areas in which the DOE technology development process could be improved. Recommendations were then given to help increase DOE EM project success, such as using a two-phase project acquisition process, constructing and using high fidelity pilot-scale systems, and purposefully selecting technology alternatives.
LITERATURE REVIEW
In the late 1970s, the DOE commissioned the Rand Corporation to study why the cost estimates of pioneer processing plants were highly inaccurate and how to better estimate their capital costs. The driving force behind the study was that for large processing facilities, the total cost of a facility could grow upwards of 100 percent from preliminary design and construction. This significant “cost growth” caused many projects to be less economical, scaled-back, or canceled altogether as they progressed. Authors of this first study, A Review of
Cost Estimation in New Technologies: Implications for Energy Process Plants (1979), used
the following methodology to develop and evaluate the data for their cost estimation framework: review what is already known about estimation accuracy in other fields; quantify and analyze the estimation errors in large public and private projects; and come up with common factors for those projects. Finally, this report applied the knowledge developed towards the unique aspects of DOE projects (Merrow et al. 1979).
In the second of the Rand studies, Understanding Cost Growth and Performance
Shortfalls in Pioneer Process Plants, the authors quantified and analyzed the following
gauge the effect of each factor indicated in the previous step. A statistical analysis was used to show which factors have the most effect and the extent of their effect on project performance. Using this information, the researchers developed empirical models to better estimate the cost and performance of pioneer processing plants at the various stages of project planning and execution. A key finding from this report is that both cost and performance uncertainty comes from a lack of process and project understanding for FOAK projects (Merrow et al. 1981).
L.A. Robbins, who was an engineer at DOW Chemical U.S.A., created a methodology on how to develop a successful pilot plant, outlined in his 1979 article for Chemical
Engineering Progress, “The Miniplant Concept.” Although labeled as a process for
In his March 1990 article in Chemical Engineering, “Piloting Processes into
Commercial Plants,” Palluzi elaborated on the details involved with pilot plants. The sizes for “pilot plants” range from bench-top, 5-10 ft2, to integrated, 20-150 ft2, to semiwork units, larger
than 10,000 ft2. In addition to describing the sizes of pilot plants, he also discussed their intended use, whether as single purpose, multi-purpose, or general-purpose facilities. The size and purpose of a pilot plant can determine many factors of the design, operation, and cost of a pilot plant. As well as elaborating on how to best design a pilot plant, Palluzi also laid out a general list of action items that should occur in the start-up of a chemical processing pilot plant. Finally, the subject of who should conduct the pilot plant process was discussed: the owner, operator, designer, or some outside contractor (Palluzi 1990).
In 2014, Wood-Black further elaborated on the questions that need to be answered through a scale-up process. The stages that scale-up are broken down into bench to pilot plant and pilot plant to full-scale production plant. From bench to pilot plant, it is critical to understand the scale-up factors from bench to pilot scales, any mechanical issues, the physical states of the materials at the larger scale, and to foresee problems before they occur. A similar scenario is necessary when scaling-up from the pilot to production scale. Wood-Black concluded that the pilot plant is critical to developing the information required to understand scaling issues (Wood-Black 2014).
for full-scale process design. The bench-scale is important to the pilot process because preliminary design should be based off of the results of experiments at the bench-scale. Once the preliminary design is completed, it should then be scaled down and a pilot plant constructed. The pilot plant then feeds information forward to the final design of the production facility. In addition, while Berty addressed the decision to continue a project to full-scale or abandon it after the pilot-scale, no definite criteria to make this decision were discussed (Berty 1979).
Using the findings from the Rand studies, Bell (2005) examined why the scale up of particulate processes caused, and continues to cause, so much trouble in process development. From the Rand studies, it was shown that after one year of operations, the design rate percentage for liquid and gas fed processes had a median of 90%. Processes being fed refined solids reached a median of 50% of their design rate and raw solids only 38%. One contributing factor to this is a lack of fundamental equations that define processes on solids at various scales comparable to those for gasses and liquids, such as the Ideal Gas Law. Other factors that affect the scale-up of particulate processes are the tendency of particles to act like multiple states of matter, effects from the time history and scale of a process or equipment, troubles in scaling models of processes, and the difficulty in collecting data in existing processes. The difficulties in several common unit operations were discussed, including crystallization, centrifugal dewatering, grinding, and silo design (Bell 2005).
In his 1992 book, Pilot Plant Design, Construction, and Operation, Palluzi traced all of the steps required for a successful pilot plant from program definition to cost estimates and design to construction, start-up, and operations. A key point of his book was the description of both the size and application of a pilot plant. Palluzi also discussed how to deliver a pilot plant, with the proposed options as follows: design and construct in-house; design in-house and contract out the construction; rent an existing pilot plant; or contract out the entire process. Another point made in Palluzi’s book that pertains to this research was the notion that new technology or components need to be tested before the design is finalized to minimize future problems (Palluzi 1992).
ideation and research, development, and demonstration. In addition to defining and elaborating on the stages of technology development, different types of knowledge gaps, their associated risks, and plans to generate missing knowledge were identified, as shown in Table 1. Harmsen also discussed the various methods for the scale-up of unit operations, which include brute force, model based, empirical, and empirical-model hybrid based methods (Harmsen 2013). Table 1: Types of Knowledge Gaps, Risks, and Knowledge Generation Plans
Flyvbjerg, Bruzelius, and Rothengatter studied megaprojects, especially large, public transportation projects in Europe, and how risk affects them. In their study, they found that in order to best manage these large, complex projects, decisions regarding those projects need to come from a risk-informed framework. The risks involved can be project-specific, market, sector-policy, or capital-market risks. Sector-policy risks arise from regulatory requirements and can reflect changes in the political landscape surrounding a project. Capital-market risks arise with the need for modern projects to acquire international funding. After describing the conventional approach to completing projects, the authors offered four ways to make project teams accountable for the development of an infrastructure megaproject: transparency, performance specifications, explicit formulation of a regulatory regime, and the involvement of risk capital (Flyvbjerg et al. 2003).
As the number of simultaneous projects being worked on by the Jet Propulsion Laboratory (JPL) at the California Institute of Technology increases, so does the need for
Type of Knowledge Gap Risks Knowledge Generation Plan I know what I don’t know Specific and limited Specific research
support of those projects. A major area in which these projects need support is during the early project planning phase. The JPL has identified front-end planning as an effective tool to address the need for project support. The process used by JPL includes an advanced studies phase, mission and systems definition, and a preliminary design phase, all of which occur before the execution of the project. In addition, reviews are completed at the close of each phase and a supplemental technical, management, and cost review is done at the end of the first two phases (Webster 2004).
TECHNOLOGY DEVELOPMENT
Pertaining to projects in the processing industry, technology is best defined as any process; system, subsystem, or component of that process; or variation on an existing technology. For the scope of this research, some examples of a technology would be: a process to separate radioactive materials from a sludge, a system that performs the material removal from the sludge, a subsystem used to deliver a catalyst to a reactor vessel, or a valve that regulates the flow of the catalyst into the reactor. Technology consists of both physical elements, ranging from individual components to full systems, as well as the process itself that uses these products. For large, FOAK projects, construction technology, such as modular construction and pre-fabrication, can be developed as well, but construction technology is outside the scope of this research.
Defining Technology Development
As L.H. Baekland said in Industrial & Engineering Chemistry, “commit your blunders on a small scale and make your profits on a large scale” (Baekland 1916). Technology Development is important because it allows for a structured approach to learning the details of an idea on a small scale before they become problems on the large scale. In addition, making mistakes, or at least learning about them, at an earlier stage can save time and money, as the cost of solving a problem at a full-scale facility can be one thousand times more expensive than solving the same problem on the bench-top scale, as shown in Figure 1. Also, by having specific “kill criteria,” the management of a project can choose to abort or revert to a previous stage (Vogel 2005), which can save time and money by going back to solve problems at a more
1 10 100 1000
Bench-top Laboratory Pilot Production
Re
lat
iv
e
Cos
ts
o
f E
lim
in
at
in
g Mis
ta
kes
Developmtent Stage
manageable scale or abandoning a technology altogether if forecasts of performance are not promising.
Characterizing Basic Data
Table 2: Examples of Basic Data
Another important aspect of basic data is the development of “kill criteria.” Kill criteria are specified situations, results, or performance levels that are predetermined to indicate that a technology is not developing as expected or towards economic or physical feasibility. While some kill criteria will indicate that a technology should be abandoned, other criteria can be used to indicate that the technology is not mature enough for a specific stage of development and should return to an earlier stage. Kill criteria are very important because they set reasonable limits, usually lower bounds, on the development of a technology.
Category of Basic Data Basic Data Type
Material Properties of Pure Substances
Empirical Formula Molar Mass Melting Point Boiling Point Density Viscosity
Process Information
Product Characteristics Reaction Temperature Yields (including waste) Hydraulic Requirements Scale-up Effects
Other Considerations
Construction Materials and Reactivity Patent and Licensing Issues
Scales of Technology Development
Although the many facets of the processing industry have different terminology for the names and criteria for different scales of technology, the following discussion will be in a general context. In addition, technology development typically occurs in a logical sequence of small to large scale, so the discussion will follow this sequence: conceptual, bench-top, laboratory, pilot, and production. Each scale has an important role to play in the successful development of a novel technology.
Before discussing the different scales, some limitations need to be addressed. The limiting factors in the different scales that can be utilized, especially in terms of progression in size, are the scaling factors of both processes and components used within a process. A scaling factor is a multiplier that indicates how much a technology can be expanded and still be understood. Table 3 shows several processes and their respective scaling factors. The difference in size between two scales of a technology should not be more than the smallest scaling factor of any part of that technology. Exceeding the scaling factors can result in the breakdown of performance observed between scales and the underlying assumptions of a technology (Vogel 2005).
Conceptual Bench-top Laboratory Pilot Production
Table 3: Example Scale-up Factors
The first scale to be discussed is the concept or ideation scale. At this scale, a new technology is only an idea or a concept and has not yet taken physical form. The novel technology may also be found in research or published studies of the project team. Although this stage of technology development is purely theoretical, a project team can still think ahead and develop some criteria for performance in future systems, identify broad categories of required basic data, and choose some potential components and subsystems.
Next, the bench-top scale serves as a proof of concept for a novel technology’s critical ideas and scientific concepts. At this scale, it is likely that the final components and subsystems have yet to be determined, so the components used at this stage do not reflect the final process. This scale is best suited for basic research into a technology, not for optimizing performance, and developing simulants of materials used by or created by a process. In addition, processes
Technology Scaling Factor
Reactors
Tube-bundle reactor >10,000
Homogeneous tube >10,000
Homogeneous stirred tank >10,000
Bubble column <1,000
Fluidized-bed reactor 50-100
Separation processes
Distillation and rectification 1,000-50,000
Absorption 1,000-50,000
Extraction 500-1,000
Drying 20-50
Crystallization 20-30
at this scale are generally operated manually, but can be automated if the proper equipment is available (Palluzi 1992).
The laboratory-scale follows the bench-top scale; these systems are larger than their bench-top predecessors, but are generally less than 10% the size and/or throughput of a production-scale facility (DOE 2011). At this stage in development, the conceptual design of the production-scale facility should be completed, so scaled-down versions of components and subsystems can be tested with both simulants and actual feedstocks. Unlike previous scales, for some components and subsystems, there may be enough fidelity to their production-scale counterparts that integrated systems checks may occur. Those systems and components that can be integrated should be able to be scaled-up to production-scale from the laboratory-scale. A pilot-scale system is the intermediary between the laboratory and production scales. The primary purpose of this scale is to fill in the basic data relating to scale-up of the technology elements. For the pilot-scale system to be most effective at simulating the production scale, it needs to be large enough to capture the complex physiochemical, mechanical, and operational data required but small enough to be quickly and economically constructed. If fidelity at the laboratory-scale was not adequate, then it is imperative to achieve production-scale fidelity at this level.
the purpose of this research, only the pilot scale will be used to represent the space between the laboratory and production scales.
If the production-scale facility is to be constructed in such a way that there will be multiple, identical trains of the same process, e.g., “Alpha,” “Bravo,” “Charlie,” and “Delta” units, then it may make sense for the project team to develop one full-scale unit as a pilot. In doing so, they can run experiments and characterize all of the required basic data for the other, unconstructed units. However, for facilities that will only have a single process train, it would be redundant to construct a full-scale, full-process pilot facility. Two additional benefits of either type of pilot are the ability to train operators and the opportunity to begin some level of production before the execution phase is complete.
Hierarchy of Process Systems
As with any technological system, there is a natural hierarchy that appears between the system, subsystems, and components. This “tree-like” nature of systems is important to technology development because it forces information to flow from smaller Critical Technology Elements (CTEs) to larger elements. Critical Technology Elements are subsystems or components of a system which, by their own technological development, affect the technology development of other CTEs or the system as a whole (DOE 2011). An example of some CTEs in a modern automobile can be found in Figure 3. In the example provided in Figure 3, some of the major subsystems are the fuel, engine cooling, and braking subsystems, all of which have their own set of components.
Engine Cooling Subsystem Braking
Subystem
Fuel Subsystem Automobile
Drums and/or
Rotors Calipers
Brake Pads
Radiator Coolant
Water Pump
Fuel Tank Fuel Lines
Fuel Pump
An important idea in the hierarchy of systems is that a system cannot be at a certain level of technology development until all of the constituent subsystems beneath it are at least at the same level. The same can be said for all of the subsystems and components that make up the system. This goes hand-in-hand with the notion that technology development starts at the base of the system “tree.” Once all of the components are adequately understood, the subsystems can be understood, and then the system as a whole. It is important to identify all of the relevant CTEs and their hierarchy at the onset of technology development in order to map out where efforts need to be made and to facilitate the flow of basic data from bottom to top.
Integrated Systems Check
until the whole process has been exhausted. Following this procedure will allow for the prediction of production-scale system performance across a range of inputs and conditions.
In the case of more complicated processes, the above methodology can still work. Instead of moving from one step to the next, a study should be conducted in which a range of inputs are performed for each step, noting the range of outputs and the effects on the subsystem itself, then testing those conditions on each of the following steps that are affected. A project team should also pay close attention to those processes that involve recycle flows, as undesirable materials may build up over time. However, this method of validating integrated system performance is only accurate if the components, subsystems, and interactions between subsystems are scalable to production-scale. If they are not able to be scaled-up to production scale, then an integrated systems check should be performed on a larger scale.
Technology Readiness Levels and Assessments
As with other scientific or engineering endeavors, metrics have been developed in order to measure technology development. The metric that will be discussed here is Technology Readiness Level (TRL), developed by the National Aeronautics and Space Administration (NASA) in the mid-1970s (Sadin et al. 1988) and then adopted by the U.S. Department of Defense, specifically the U.S. Air Force, and the DOE (Mankins 2009). The purpose of the TRL is to give a metric outside the pressures of project management to measure the maturity of a developing technology. See Table 4 for a description of TRLs.
Technology Readiness Assessments (TRA) are the framework by which the TRL metric is measured. These assessments of a technology’s maturity are to be conducted regularly and can be used as a tool to measure progress. Similar to NASA and the U.S. Air Force protocols, TRAs should be standardized to effectively evaluate technologies across different disciplines. In addition, there should be separate TRAs conducted for CTEs at the component and subsystem levels, as well as one for the overall system. In doing so, the progress of each part of a technology can be tracked.
Feedstock Sub-process 1 Sub-process 2 ... Sub-process
N Output
Determine full range of
input parameters
Apply full range of inputs to
sub-process 1
Record outputs from sub-process 1
Apply range of outputs from
process 1 to sub-process 2 Record outputs from sub-process 2 ... Record outputs from sub-process N
Figure 4: Example Process System
Table 4: Description of Technology Readiness Levels
The Importance of Evaluations
Both TRLs and TRAs play an important role in standardizing how technology is measured, but it is the evaluation of those measurements that proves to be the important tool to a project team. By evaluating a technology at each TRL, through a TRA, it can be shown if the technology is developing according to schedule, budget, and generation of basic data. Evaluation is important to sort out what basic data has been generated, what data is missing, and what information is expected to be found at the next stage of development. In addition, any assumptions from prior stages should be validated during the evaluation period, as
TRL Name Description
1 Basic Principles Basic science has been established
2 Technology Concept Technology applications are formed, but not proven 3 Proof of Concept Technology concept proven on the benchtop-scale in
limited conditions
4 Lab-scale w/ Simulants Technology has been proven on the laboratory-scale with simulants or in a limited range of operating conditions
5 Lab-scale w/ Actual Material
Technology has been proven on the laboratory-scale with actual materials or in a broad range of operating conditions
6 Pilot-scale w/ Simulants
Technology has been proven on the pilot-scale with simulants or in a limited range of operating conditions 7 Pilot-scale w/ Actual
Material
Technology has been proven on the pilot-scale with actual materials or in a broad range of operating conditions
8 Full-scale Demonstration
Technology has been proven at the production-scale with actual materials on a broad range of operating conditions but is not operating at design capacity 9 Full-scale, Full-process
Operations
unvalidated assumptions can lead to system problems later on. Depending on the balance of basic data versus maturity of the developing technology, there are three possible outcomes of an evaluation: move forward, gather more information, or abort development.
The best case scenario after an evaluation of a technology’s development would be to move forward to the next stage of development. For this to occur, an evaluation should find that all of the basic data needed for the next stage of development has been gathered and that all of the problems of the previous stage were either solved or dealt with in an appropriate manner. Some of the information of the previous step may be unknowable, so parameters and contingencies should be created in order to mitigate the effects of that basic data. It is important to take the time at this point in development to then list the information to be found and assumptions to be validated in the next stage of development and to plan how it will be acquired.
a feed stock or fuel source), then testing at previous stages should also be conducted to study the effects of the change.
The third outcome of an evaluation would be to abort the development of the technology. This decision should be reached based upon specific “kill criteria” that are determined at an earlier time, either at the onset of technology development or at the prior stage’s evaluation. Kill criteria are situations and indicators of the performance of the technology development process, such as budget, schedule, and performance of the developing technology. If it is determined that a technology’s development should be stopped, then either the project itself is canceled or an alternative technology is chosen.
In addition to tracking the progress of a technology’s development, assessments can be used to predict the amount of work remaining based upon the amount of missing basic data surrounding the new technology. Figure 6 outlines this relationship. The less known about a technology, more rigorous development at a larger scale will be required for reliable information. Technologies for which most of the basic data has been gathered will require little to no development at a smaller scale.
Information Missing
Technology Development Rigor Little to No Information
Missing
Some Information Missing
Large Amounts of Information Missing
No Tests Needed Test Individual
Components, as needed
Test Individual Subsystems, as needed
Full Process Test Needed
Using Technology Readiness to Tailor Technology Development
Like the Pyramids at Giza, whose uppermost stone blocks are built upon and supported by the layer beneath them, a technology system is dependent on the function of the subsystems and components that comprise the whole system. Using TRLs and TRAs on the subsystems, components, and interactions between them, the overall technology development of a system can be mapped out which will indicate which CTEs need more development and which have reached maturity. Using the hierarchy of the system itself and the TRAs of each CTE, a project team can tailor their technology development approach to fit the state of the system and allocate resources accordingly. An organization chart depicting the hierarchy of the system can be used as a visual tool; each CTE can be color-coded to match its individual level of technology development (see Figure 7 for an example using the earlier automobile example). In the given figure, CTEs that are green are matured technologies; yellow CTEs indicate that there may be
Engine Cooling Subsystem Braking
Subystem
Fuel Subsystem Automobile
Drums and/or
Rotors Calipers
Brake Pads
Radiator Coolant
Water Pump
Fuel Tank Fuel Lines
Fuel Pump
some missing basic data, but parameters have been developed to lessen their impact; and red CTEs need further development. At the end of technology development, the whole system organization chart should be green, with some yellow as necessary.
Which Critical Technology Elements Need Development?
At the onset, deciding which CTEs need more development or attention than others can be daunting, but knowing a few indicators that point towards potential problems before they coalesce can help to simplify the process. Primarily, any truly novel CTE should be investigated heavily, as should any subsystem or component that is downstream of the new CTE’s outflow. A new technology is inherently unevaluated, and the missing data from lack of testing can raise tremendous problems at large scales of utilization. In addition to truly novel elements, any technology element that has been adapted to a new application also merits scrutiny as changes in purpose or inputs can affect performance (DOE 2011).
Critical Technology Elements that are involved in complex recycle flows need to be closely inspected as well. Left to its own processes, a system with recycle flows can develop an unforeseen concentration of materials that will, likely, affect the performance of the overall system. The recycle flow can develop materials that may slow overall process performance or may change the output altogether (Vogel 2005). Understanding the complex workings of recycle flows allows designers to design solutions to eliminate or work with their effects.
FRONT-END PLANNING
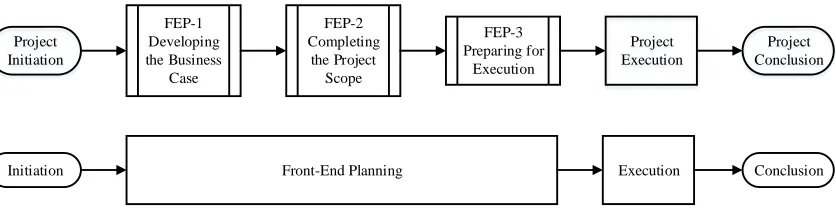
Preparing the elements to conduct a good design before entering the execution phase of a project is a key factor in the success of a complex project. Front-end planning is a process that works to ensure a robust design so that the execution phase of a project yields better results (CII 1995). In essence, FEP reduces the risk of a project failing during the execution phase, which is defined as the detailed design, construction, commissioning, and start-up activities of a project. The three main stages of FEP are developing the business case, completing the project scope, and preparing for execution (Merrow 2011). See Figure 8 for the organization and placement of FEP within a project’s timeline.
Developing the Business Case
At the onset of any project, the need to show that a project is a viable business endeavor is key. No project will receive approval if it cannot prove it will be profitable during operation, at least in the long-term. Although cost estimates at the earliest stage of a project are typically the most inaccurate, they can still give insight into a proposed project’s performance. This stage is about setting up the project and developing a plan to succeed.
Project Initiation FEP-1 Developing the Business Case FEP-2 Completing the Project Scope FEP-3 Preparing for Execution Project Execution Project Conclusion
Initiation Front-End Planning Execution Conclusion
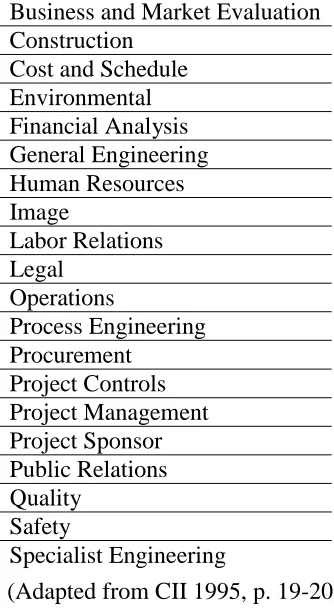
The first major decision is the creation of the project team. Members of the FEP project team should all be contributors to the project; all stakeholders should be represented, which would include the owner, operator, construction contractor, designer(s), and any regulatory bodies, among others. A general list of groups to be represented on a FEP team is given in Table 5. This team of people will develop the foundation of the FEP process, so selection should be taken with great care. If needed to better accomplish FEP tasks, sub-teams may be created in order to distribute work to smaller groups of members who may have more expertise in a certain area, desire to see a task completed properly, or live or work in geographical proximity (CII 1995).
Table 5: Groups Represented in Front-End Planning Team Group
Business and Market Evaluation Construction
Cost and Schedule Environmental Financial Analysis General Engineering Human Resources Image
Labor Relations Legal
Operations
Process Engineering Procurement
Project Controls Project Management Project Sponsor Public Relations Quality
Safety
Specialist Engineering
The team then is tasked with developing the business case of the project. Research should be conducted with regards to process alternatives, locations, feedstocks, unit costs, amount of technology development needed, and eventual product market. All of these factors, among others, should factor into initial estimates of the project’s profitability. Any partnerships between entities, e.g. corporations, private groups, governments, or other public groups, should also be addressed and defined at this point in the FEP. The FEP team should be called upon to lay out the objectives of the project, which may be to increase profits, lower overhead of another internal project or process, meet new regulatory requirements, bring a new product to the market, etc (CII 1995 and Merrow 2011).
Before continuing on to complete the project scope, the FEP team should plan out the rest of the FEP tasks. The FEP process is, in and of itself, a mini-project and should be held accountable to a budget and schedule in the same manner as the execution phase. Important dates for milestones should be agreed upon and a budget established. These dates, budget targets, and all other FEP information should be recorded in the event that the FEP activities are halted for any reason so that those activities may be resumed later with little time wasted (Merrow 2011).
Completing the Project Scope
alternative relatively early in FEP-2, but location selection can affect the technology selection, and vice versa. Overall, the technology and location combination that is selected may not be the cheapest or quickest option at face value, but should be the solution that best fits the business case and project need laid out in FEP-1 (CII 1995 and Merrow 2011).
There are many questions to be asked and analyzed before finalizing a project location. How far from the closest airport is the site? Are there any environmental issues? Should we construct on a green-field or an existing site? What is the local/state/federal government oversight? Table 6 lists some of the factors that should be considered in choosing a site (CII 1995).
Table 6: Example Factors for Site Evaluation Site Factor
Access to Feed Stocks Labor Economy Expandability Energy Cost Location Configuration Topography Zoning Weather Climate Ownership
Environmental Restrictions Governmental Incentives
For some projects, there may be a multitude of technology alternatives to choose from. Other projects may only have one or two options. Each possible technology needs to be assessed for its maturity, fit for the application, cost of construction, ease of operation,
maintenance and resale costs, and production performance. Similar to choosing a facility’s location, choosing the technology alternative is not a straightforward decision either. For example, while it may be economical to build a combined facility that can process more than one material stream, this would require a major change in project planning and a return to FEP-1 would be warranted (Merrow 20FEP-1FEP-1).
Given the information obtained from researching possible locations and technology alternatives, estimates can be made as to the cost and schedule of the project’s execution phase of the project. All of the factors should then be weighed against one another to choose the best fitting technology and location combination for the project. In this manner, the FEP team can determine which aspects of the project’s scope are most important and tailor their alternative selection based upon those criteria. Once an alternative has been established, the Process Flow Diagrams (PFD) can be established with a conceptual design (Merrow 2011).
Preparing for Project Execution
With a project site and a conceptual design established from FEP-2, the last stage of FEP is to prepare to execute the project. The two major tasks at this stage are to complete a preliminary design of the facility and establish a project execution plan. Any and all lose ends still present from previous planning stages must be addressed before continuing on to project execution (Merrow 2011).
any unobtainable basic data should be carried out and actions taken to lessen or mitigate the effect of the missing information. In addition to those risks the FEP team can identify, there will also be risks that evade detection, so additional contingency should be added towards lessening the unknown risks’ effects. Three major accomplishments in the preliminary design phase can serve as indications that the project is ready for the execution stage: the completion and approval of piping and instrumentation diagrams, completion of major equipment specifications and the order of long-lead time items, and a more accurate cost estimate developed from the piping and instrumentation diagrams (Merrow 2011).
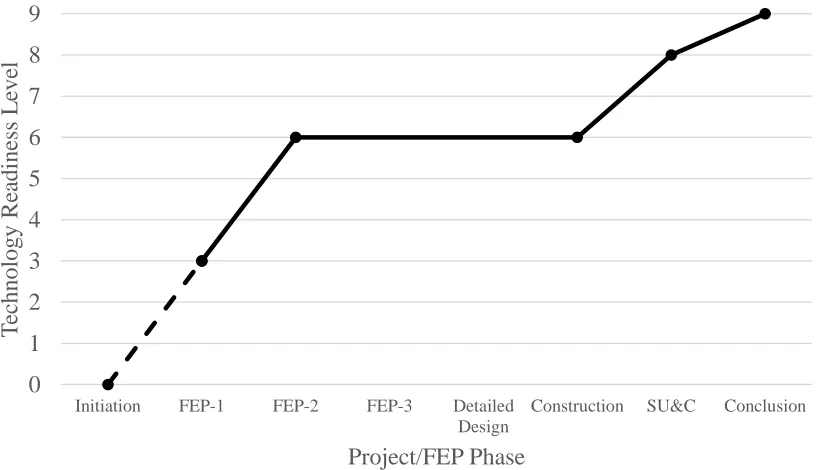
COMBINING FRONT END PLANNING AND TECHNOLOGY DEVELOPMENT Although both FEP and technology development are established concepts, the combination of these two processes and the extent to which they can be performed together can have large benefits for FOAK projects. The use of a rigorous technology development protocol supports the need for process information throughout the FEP process. A well-managed FEP process gives more structure to the development of technology. The most important aspect of the relationship between FEP and technology development is that the timing of each process logically fits into the pace of the other. The following discussion will be formatted around the stages of the FEP process because the small increments of technology development, specifically the TRLs, fit better into the larger progression between FEP stages. See Figure 9 for a layout of how TRLs fit into the FEP stages.
0 1 2 3 4 5 6 7 8 9
Initiation FEP-1 FEP-2 FEP-3 Detailed
Design
Construction SU&C Conclusion
T ec hnolog y R ea diness L eve l Project/FEP Phase
From Ideation to FEP-1
The purpose of FEP-1 is to establish the business case of a project. To do so, the initial concepts of the project facility and process need to be developed. In doing so, technology alternatives are found and analyzed in order to determine their order-of-magnitude cost and the amount and intensity of technology development that still needs to occur. It is at this stage that technology alternatives should be at a TRL 3 or above. This level of technology development, TRL 3, is important to developing the business case because it represents the first major milestone in understanding a technology at larger scales and can begin to provide insight into the intensity of further technology development. Technology Readiness Level 3 indicates that the alternative technology concept has been proven and is well documented in scientific and engineering papers. It is also at this TRL that the notion of how much and how intense the technology development process will be. Put simply, the practicality of developing a technology to a TRL 6 or TRL 7 for the detailed design stage needs to be considered in the alternative analysis. As an example, it may be easier to develop an alternative that is at TRL 2 at FEP-1 to TRL 6 than a different alternative that is at TRL 3 at FEP-1. With that information in mind, an initial evaluation should be conducted to rule out any significantly costly, ill-performing, and developmentally difficult technology alternatives.
contention, they can either wait for the alternative to mature to at least TRL 3 or allocate resources to ensure its maturation. There is a third possibility: to abort that technology alternative for the current project and save it for a later need. If the technology has developed beyond a TRL 3 at that time, then there should be no adverse effect on the project.
Technology development assists FEP at this stage by demonstrating that a proposed technology alternative is a viable solution to solving a project’s need. It does this by proving that the concept behind the technology is possible and not just scientific theory. Front-end planning assists technology development at this early stage by providing a goal for basic science research to help solve engineering and business problems. In addition, it can also be a possible avenue of funding for researchers to develop concepts and offer solutions to current sponsors or future organizational partners.
From FEP-1 to FEP-2
Starting with TRL 4, basic component and system validation at a laboratory scale, the technology should develop to at least a TRL 6, component or system validation at the pilot scale, or TRL 7, validation at full scale. For certain processes and technologies, it may be important to distinguish between the use of simulant materials to test a system, as required for TRLs 4 and 6, and the use of actual materials for the same validation procedures, as required for TRLs 5 and 7. The characteristics that a simulant is designed to replicate in the actual material are likely to be the important features of the actual material, but no simulant can truly capture the exact behavior of the original material. If simulants alone are used in the validation of TRLs, then the FEP and technology development teams should continue the work until TRL 7 is reached with actual materials.
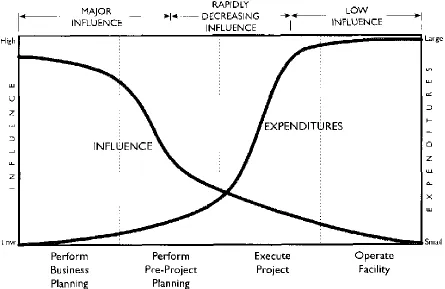
If a technology does not reach either TRL 6 or 7, as appropriate, by the completion of FEP-2, then there is an increased risk that there is unknown basic data that will be entering the preliminary and detailed designs of a system. This can poorly affect system performance and hinder commissioning, start-up, and operational activities until the unknown information is identified on either the production-scale or smaller-scale system. As shown in Figure 10, the problems caused by a lack of basic data are also far more expensive to fix after the preliminary and detailed designs have been completed and even more so as the construction, commissioning, and start-up processes progress (CII 1995). Therefore, it is in the best interest of the FEP, technology development, and project management teams to ensure that basic data
is found earlier in a project’s lifetime. If a technology is above a TRL 6 or 7, there should be limited adverse effect on a project.
Although it is good to have all CTEs at a TRL 6 or 7, as applicable, by the end of FEP-2, it is also important to have all of the interactions between CTEs at the same level of development. This is a critical step that can be easily overlooked due to the presentation of the TRL process. If the interactions between CTEs do not occur at a high enough TRL, then the overall system is at higher risk of not performing as intended. In some cases, this can be more costly in time and money than a component or subsystem failing, because the problem is harder to solve, due to its nature, and the solution could involve the replacement of one, two, or more whole CTEs. As with the general technology discussed above, if the interactions between CTEs are above a TRL 6 or 7, then there should be no adverse effect on the project.
development of the technology should be stopped and other alternatives should be pursued; it may also indicate that the FEP schedules and budgets are too aggressive.
From FEP-2 to FEP-3
In order to achieve FEP-3 and clear the project for entrance into the execution stage, the project execution plan and the preliminary design need to be completed (Merrow 2011). For the detailed design to be finished and approved in the execution phase of the project, any outstanding requisite basic data should be found and understood prior to FEP-3 approval. Therefore, the interaction between FEP and technology development at this stage is a continuation from previous stages to fill any further gaps in the understanding of the technology. Concurrently, the technology development team can complete any necessary activities on commissioning, start-up, and operational procedures for the production-scale facility. In addition, operators and maintenance personnel can begin training on the scaled-down systems and small amounts of the product can be produced to help develop quality control testing and standards, or to make available to outside entities.
Project Execution, Completion, and Initial Operations
CASE STUDY
The United States has a substantial history of producing nuclear waste in the 20th century, mostly as a byproduct of the production of weapons-grade nuclear materials for military use. This production has its roots in the Manhattan Project, started in 1939, and continued with the development of weapons for World War II and the Cold War. In 1989, the DOE created the Office of Environmental Management to clean up radioactive and hazardous wastes across the United States (DOE 2014). The mission of the DOE EM is to complete the safe cleanup of the environmental legacy brought about from five decades of nuclear weapons development and government-sponsored nuclear energy research. In order to meet this mission, the DOE EM must construct large, complex, usually FOAK facilities in order to treat the various types of waste found at each site to prepare them for permanent storage.
DOE Procedures Review
As an organization that oversees the design, construction, and operation of large, FOAK waste treatment facilities, the DOE EM already has a quite robust project management procedure in place that covers the entire lifespan of a project from inception to completion.
The Program and Project Management for the Acquisition of Capital Assets, referred to as
DOE O 413.3B and the Project Management Order, took effect in November 2010 and is applicable to all DOE capital projects over $50 million and those over $20 million as needed. DOE O 413.3B serves as an umbrella document that lays out an overall approach for the DOE to perform large capital projects and references many more documents for the specifics of each activity required and when to perform those activities (DOE 2010).
completion of a capital project. See Figure 11 for an outline of the CD process and the associated project phases as used by the DOE (DOE 2010).
The approval of the mission need is the first step in the CD process. It is at CD-0 the DOE EM identifies that there is a need to perform an action and begins to frame the solution to the problem at hand. The major task to be performed at this time is the Mission Need Statement, which address both the performance gap and the general idea of a solution. In addition, a rough cost estimate is generated in order to determine at which organizational level the CD authority is held or should be delegated (DOE 2010).
After the mission need has been approved, the alternative selection phase begins. The purpose of CD-1 is to take the rough framework of the solution from CD-0 and use an iterative, systems engineering approach to determine the technological details of the solution to the mission’s need. The systems engineering approach is outlined in Managing Design and
Construction Using Systems Engineering for Use with DOE O 413.3A, or DOE G 413.3-1. It
is in this phase in which an integrated project team (IPT) is formed to analyze potential alternatives and determine the most suitable alternative for the project. In addition to
CD-0 Approve Mission Need CD-1 Approve Alternative Selection and Cost Range CD-2 Approve Performance Baseline CD-3 Approve of Construction or Execution CD-4 Approve Start of Operations or Project Completion Definition Execution Initiation Closeout
determining the best alternative, a conceptual design is developed and a cost estimate generated; this is not the final, most accurate estimate (DOE 2010).
Where CD-1 aims to determine the best alternative available and develop a conceptual design, CD-2 goes further and works to create a full-fledged preliminary design. It is at this stage that the project execution plan, which includes details regarding funding and long-lead items for the project, is defined. In addition, the TRA process is applied to any significantly new technologies and a technology maturation plan is developed as necessary. The preliminary design and project execution plan can then be used to determine the performance baseline for the project, which outlines the cost, completion date, and key performance parameters to be achieved at the end of the execution phase. It is important to note that the preliminary design required for CD-2 approval is not the complete and final design (DOE 2010).
After the performance baseline has been established, the final preparations before starting construction take place prior to CD-3 approval. In this period, the final, detailed design is completed. For those technologies that went through a TRA in CD-2, another assessment should be conducted, as necessary. In the case of long-lead procurement items, a special CD-3A can be approved sufficiently early to receive those items at an appropriate time. The approval of CD-3, in earnest, marks the the project as ready to begin construction activities (DOE 2010).
commissioning, and project start-up can take place. A plan also needs to be in place that lays out the transition from the project team to operations. In the end, CD-4 cannot be approved until the key performance parameters identified and defined in CD-2, such as waste conversion and feedstock consumption rates, are met. After CD-4 is approved, several more activities occur, but the project is mostly finished for the IPT (DOE 2010).
The DOE’s Technology Readiness Assessment Guide, DOE G 413.3-4A, is the child document under DOE 413.3B that deals specifically with technology development and makes recommendations to an IPT as to when a TRA should occur and which TRL should be achieved by each CD step. See Figure 12 for the recommended TRLs for each CD step. The DOE uses similar TRLs to those defined in Table 4; the DOE’s level definitions are included in Appendix
0 1 2 3 4 5 6 7 8 9
0 1 2 3 4
T ec hnolory R ea diness L eve l
Critical Decision Step
Figure 12: DOE Recommended Technology Readiness Level vs. Critical Decision Step
A. In addition to defining how assessments should be conducted and technology readiness measured, guidance is given for identifying which elements of a technology are critical for system performance and project completion and labels them as CTEs. Each CTE’s technology development is tracked during the life of the project through TRAs (DOE 2011).
In addition to the Technology Readiness Assessment Guide, the DOE EM produced a report in 2013 to address some of the missing pieces in the DOE’s procedures relating to technology readiness and development. The Technology Readiness Assessment/Technology
Maturation Plan Process Implementation Guide was initially drafted in 2008, but was revised
Select Project Performance Review
Although it is important to review the official procedures and literature from the DOE, it is equally important to look into their project performance. The two projects in particular to be assessed are the Salt Waste Processing Facility (SWPF) at the Savanah River Site (SRS) in South Carolina, and the Integrated Waste Treatment Unit (IWTU) at the Idaho National Laboratory. Both SWPF and IWTU are large, complex, FOAK projects that have completed their construction phase, and are still in the execution phase, at the time of the present study (DOE 2015).
The SWPF at the SRS is designed to pre-treat salt waste to separate high- and low-level radioactive waste from on-site storage tanks and fits into the larger Radioactive Liquid Tank Waste Stabilization and Disposition Project at the SRS. As part of the development of SWPF, a pilot-scale facility was completed to pre-treat a small amount of salt waste using the two main CTEs, the Actinide Removal Process and the Modular Caustic Side Solvent Extraction Unit, and to provide operating experience towards the use of SWPF. Although no pilot-scale testing was performed, since the two processes are already 1/10 scale of SWPF, extensive laboratory testing did occur with actual waste. The pilot-scale portion of SWPF was completed both within schedule and under budget, and the original three-year operating life was extended to provide coverage due to delays in SWPF operations (DOE 2015).