Enhanced Feature Selection Algorithm
(FAST) for Large Data
Priyanka Mate 1, G.P. Chakote2
P.G. Student, Department of Computer Engineering, MSS CET, Jalna, Maharashtra, India1
Associate Professor, Department of Computer Engineering, MSS CET, Jalna, Maharashtra, India2
ABSTRACT: When selecting a feature, we will look for features that deliver similar results to the original feature set. We consider efficiency and effectiveness when evaluating feature selection algorithms. These criteria suggest grouping FAST (FAST) and are evaluated and used in this document. Reducing the size of the data is one of the most important features of FAST. First, we use group graph theory to classify properties. Next, we create a subset of properties by selecting the most representative properties associated with the target class. Because the group's properties are quite independent, FAST's clustering strategy is very likely to offer useful and independent secondary features.
Specify a subset of the most useful features that produce compatible results because all sets are involved in selecting properties. The feature selection algorithm can be evaluated from the point of view of efficiency and effectiveness. Performance is related to the quality of the subset of performance properties versus the time spent searching for a subset of features.
KEYWORDS:Subset selection, Properties, Grouping methods, Filtering capabilities
I. INTRODUCTION
The feature selection algorithm can be seen as a combination of search and measure techniques that can be used to mark different sets of features. The simplest algorithm is an algorithm that will test every possible search function and reduce the error rate. It is a detailed and rare area for the smallest package. The selection of the evaluation parameters has a great influence on the algorithms and constitutes a measurement of the evaluation which distinguishes the three methods of algorithm selection: filter envelope, clipping method and integrated method. [1] Finding the best features is often a way to measure the ability to differentiate classes. Can be an independent classifier (such as filtering methods) or specific (for example, how to wrap or integrate a method). The clipping method is used as a prediction model for selecting a subset of partitions. The new encapsulation feature for each subset is very complex. This method offers the best feature set for specific model templates. [6] The filtering method uses a proxy rather than an error rate to evaluate a subset of attributes. Filtering methods are often used by computers less than packets. However, instead, create a feature set that is not suitable for a specific prediction model. Many filtering algorithms assign a ranking to features rather than choosing the best subset and the collation intersection is selected by cross-checking. [7] How to integrate all group techniques. These elements, which use the selection of properties as part of the modeling process In the most common form of property selection, the process fails, unexplained algorithms to add the best features to each turn. If you want to learn with this machine, this is usually done by cross-examination.
than the other three. [3] Examples of integrated methods: mechanisms Learn traditional machines such as decisions or inventions. The artificial neural network [12] does not guarantee the accuracy of the learning algorithm and does not depend on general learning algorithms. [17] [9] The encapsulation method tends to enter the learning set, training small and expensive. Calculation methods are a combination of packaging and filtering methods. [4] [17] Using filtering methods to reduce the search space, determined by the following coverage method, is a good way to filter when the number of properties is very large. So we use filtering methods. The grouping of the general graph theory is simple, which involves looking for a subset of edges creating vertex trees, which reduces the total weight of all the edges of the structure.
II. RELATEDWORK
Selecting a feature set is a process that identifies and removes redundant and irrelevant data. 1) Irrelevant features do not lead to accurate predictions [5] and 2) duplicate entities are not ready to search for predictors. It is best to get the information already in this feature. [6], [6], [13], [16] can also eliminate irrelevant functionality while retaining redundant functionality.
In general, choosing a subset of the feature set can be thought of as the process of identifying and removing as much as possible of unrelated and redundant features. Because the first unrelated feature does not predict accuracy, and second, the unique redundant features make it possible to find better predictors to obtain the available information. Traditionally, research on choosing a subset of properties has focused on finding relevant properties. This method is an improvised algorithm that weights each property based on the ability to select samples for different purposes based on the distance threshold function. However, improvised algorithms suppress the redundant properties due to the predicted properties. CFS and FCBF [20] are examples of CFS redundancy. The assumption is that a subset of good attributes is a group with associated attributes. FCBF High Goal [20] is a quick filtering method that can identify relevant features, including redundancy among associated features, without the need for dual correlation analysis. FAST Algorithm [19] Using Methods Grouped according to the selected properties, hierarchical grouping properties have recently been used for word selection in the hierarchical organization context. Quaid messages because of the distribution of words as a group of clumping characteristics and for this reason, word combinations do not work and have a high price.
Dhillon et al. [23] proposes new theoretical discrimination algorithms for groups of words and applies to the classification text, Butterworth and faculty [24] proposing group elements using distance measurements. Unfortunately, the Barthelemy-Montjardet Kriss group assessment and the faculty [21] offer a spectral clustering method and a selection of datasets using shared data. The way they group the characteristics is similar to that of Van Dijck and Van Hulle [22], with the difference that all external forces are continuous. Both methods use hierarchical grouping to eliminate redundant features. Sequential clustering algorithms and FAST algorithms have different minimum algorithms. Although the data points are not grouped around the center or separated by a general geometric curve.
Selecting this feature set is a technique for dealing with problems caused by too many features. [1] How to choose a subset of elements usually consists of two personal sub-functions, creating sub-features and evaluation machines. Both parties work together to find a subset of features that meet the best evaluation criteria. The set of functionalities can also be considered as a search engine that can be divided into three categories: advanced search engines, search engines, heuristics and search engine engineering. These search engines are located in the state sector and use different search strategies.
Butterworth et al., then select the most relevant features that take advantage of the BarthelemyMontjardet hierarchy of results hierarchy. The evaluation of the distance measurement group does not specify a subset of properties that allow the classifier to improve the accuracy of the original performance. Compared to other certification methods, accuracy will decrease. Selecting properties in the spectrum data Use sequential grouping. The FAST algorithm uses a tree development method on the proposed FAST cluster, which is not limited to certain types of data.
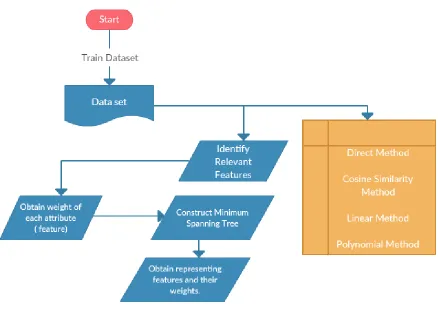
The accuracy of the learning machine will be severely affected by independent features, including duplicate features. Delete as many unrelated and redundant data by selecting a subset of properties. The framework for selecting new features (as shown in Figure 1) includes two irrelevant related components that have eliminated duplicate features. Eliminate irrelevant features and remove the redundant functionality of affected individuals by selecting representatives from various property groups. The past will receive features related to the target concept and will cause the last subset.
III.PROPOSEDARCHITECTURE
The filtering method is a type of agnostic. There are no suggestions on how to choose in advance that do not depend on the machine learning algorithm to use. After classification (29) and (26), the filtering methods can be divided into simple and multivariate techniques. The univariate filter model considers one entity at a time, while the multivariate method considers a subset of attributes with the objective of combining Guyon and Elissee reference entities. [26] And multiple filtering methods are grouped with encapsulation and embedding methods and sub-selection methods. This system undergoes the following phases:
1.Deleting irrelevant features
This step removes the idea of the match. This feature has been removed. If there is no correspondence between the value of the selected property f and the target level c, it is said to be irrelevant and removed from the set of properties. If the relevance measure exceeds the limit, the entity will be selected.
2.Grouping
Distributed grouping is used to group words into groups based on specific grammatical relationships with other words or by distributing class tags associated with each word. Because word grouping is agglomerated by nature, the result is a subset of inefficient words with high computational costs. The data division and word grouping theories algorithm is presented and used for text classification. The proposed algorithm is used by the group and uses the most relevant features.
3.Deleting redundant features
4.Select a subset
The associated properties will be grouped together and group representatives will be established for the desired properties without duplication. Properties that are not related to duplicate properties affect the accuracy of the machine. Therefore, the choice of a subset of properties should be able to identify and remove as much as possible unbound and redundant information. In addition, it is also necessary to choose a good set of sub-functionalities in order to obtain a functionality strongly correlated with the class. There are new ways to effectively and efficiently deal with irrelevant and redundant properties and to receive a good subset.
Information to retrieve from the dataset, Datasets are created using online inventory data. Grouping techniques are one of the most important and fundamental tools for data recovery. In this paper, we will present a clustering algorithm inspired by the minimal expansion structure. This algorithm has two main parts and one kernel. The heart of the choice or denial of MST profit in the group creation process depends on the value of the coefficient of variation. The kernel is repeatedly called in the main algorithm until all parts are completely formed. We present the results of this algorithm in synthetic data sets and real data sets. Grouping is an important tool for exploring the hidden structures of large modern databases. It is the subject of extensive studies and many steps in the literature. Due to the variety of problems and the distribution of data, techniques such as hierarchy, discrimination, density and modeling are developed and no one is completely satisfied. For example, some traditional algorithms depend on the concept of grouping data points around certain centers or separating data points using regular geometric curves, such as large planes. As a result, they often do not work well when the scope of the group is not the same. The apparent empirical evidence shows that the lowest substitution agent is relatively stable with respect to detailed geometric modifications of the cluster boundary. As a result, the cluster shape affects the efficiency of the clustering algorithm by using the smallest spatial index (MST), which allows us to overcome the problems encountered by the algorithm, Classic Grouping. These data use real-time online data from the predefined interface.
5.Univariate filtering methods.
These methods consider distinct properties and often use certain notation functions to weight the characteristics and rank them according to the relevance of the target concept. [27] In the literature, this process is called Organize. The classification or weighting of characteristics is selected if the weight or relevance is greater than the threshold value.
(F) If S (f) is greater than the threshold value, adding fi properties to the new sub-subassembly has many filtering methods, such as the Improvised algorithm, using instances or statistical methods such as Pearson's relationship with linear regression or improvised statistical algorithms (three-dimensional displacement), vehicle detection according to the conditions of the instance. They evaluate the value of the feature by sampling the sample several times and taking into account the value of the attribute specified for the closest instance of the same class and different. Most mitigation algorithms work in discrete and continuous data. Theoretical and empirical analysis of many algorithms is described in [30]. In addition to the examples and statistical methods, many filtering methods use theoretical criteria to select variables such as data reception. (Divergence of Kullback-Leibler) and the rate of exposure are described in [31]
6.Obtain information
IV.EXPERIMENTALRESULTS
Data matrix has been processed in advance and fragmented, taking into account the meaning of each expression of the gene (column), the number of output properties (genes), suggesting that n is provided from outside by the user. Data matrix with class c = {1, 2, •••, C} is the input at first. The first objective (obj1) is that the relevance of each gene is calculated by sharing data according to equation 6 from the score The relevance will be extracted and added to the identity of the top scorer.
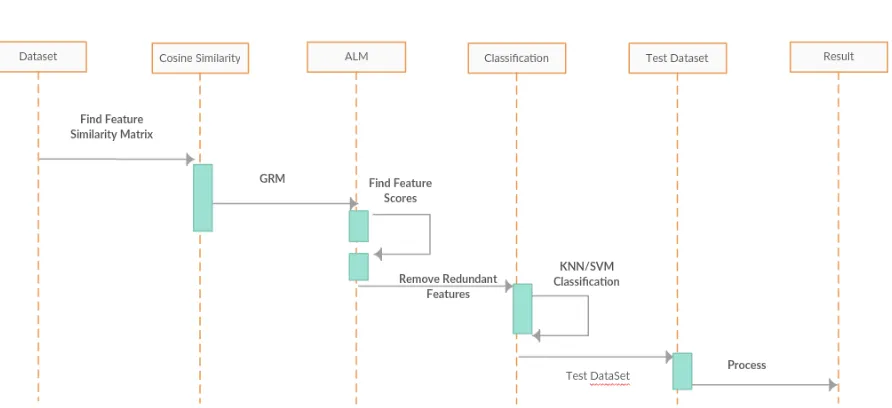
Figure 1.1 Sequence for proposed architecture
Algorithm 1 Proposed Feature Selection
Input: The feature id idle f t, first objective ob j1, second objective ob j2, |ob j1| = |ob j2| = |idle f t|.
Output: Non-dominated feature id idns, the second objective ob j2ns of non-dominated features. 1: k = 1;
2: for i = 1 : |idle f t| do 3: t = 0;
4: for j = 1 : |idle f t| do 5: if then(i! = j)
6: if then(ob j1(i) ≤ob j1( j)&ob j2(i) ≤ob j2( j));
7: else if then(ob j1(i) < ob j1( j)&ob j2(i) > ob j2( j)||ob j1(i) > ob j1( j)&ob j2(i) < ob j2( j)); 8: else
9: t = 1; 10: break; 11: end if 12: end if 13: end for
14: if then(t == 0&j == |idle f t|) 15: idns(k) = i;
16: ob j2ns(k) = ob j2(i); 17: k = k + 1;
18: end if 19: end for
where F is output feature set, Xk is output feature vector and xi is the ith feature vector. Then the second objective (obj2) is modeled as the ratio of relevance to the redundancy and it is to be maximized. After calculating the two objectives for each feature the non-dominated features are identified. A reference feature is called the non-dominated feature if it satisfies the following conditions: 1) if the obj1 of the reference feature is greater than or equal to all the other futures’ obj1 and the obj2 of the reference feature is greater than or equal to all the other features’ obj2 2) if the obj1 of the reference feature is greater than all the other features’ obj1 and the obj2 of the reference feature is less than all the other features’ obj2 and vice-versa. Afterwards, from the non-dominated features, the feature having maximum obj2 is included in the output feature set.
One real life data sets is used for the comparative study. The CervicalCancer dataset is collected from the website: www.biolab.si/supp/bi-cancer/projections/info/. The dataset contain two classes of samples.
1. Prostate: Gene expression measurements for samples of Cervicaltumors and adjacent Cervicaltissue not containing tumor were used to build this classification model. It contains 50 normal tissue and 52 Cervicaltumor sample. The expression matrix consists of 12533 numbers of genes and 102 numbers of samples.
A. Data
Set
B. method C. Sensitivity D. Specificityy E. Accuracy F. Fscore G. Avg
Corr
H. AUC
I. J. K. L. M. N. O. P.
Q. R. S. T. U. V. W. X.
Y. Z. AA. BB. CC. DD. EE. FF.
GG. HH. II. JJ. KK. LL. MM. NN.
OO. PP. QQ. RR. SS. TT. UU. VV.
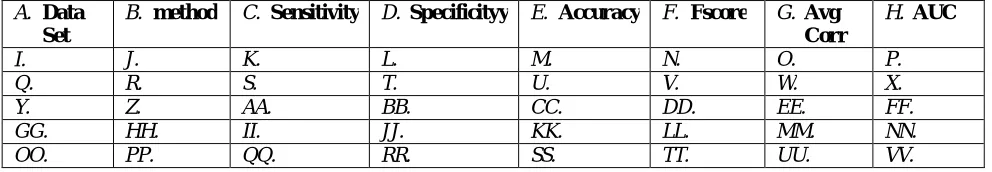
Table 1.2 Results with existing methods
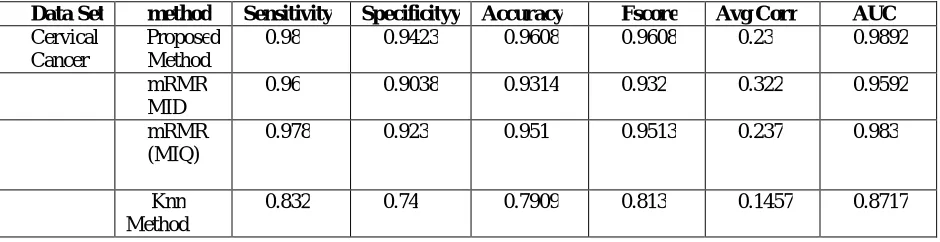
The actual data sets described above are first standardized with the Min-Max normalization technique. Then, with respect to the mean of each characteristic (gene) or column, the data are discretized. In this article, the number of output functions is taken as 100 for all algorithms. Using 10-fold cross-validation, sensitivity, specificity, precision and fscore score are calculated. Then, the mean correlation for evaluating the redundancy of the selected characteristics is also calculated. A smaller correlation value indicates that the selected functions are less redundant. In addition, the area under ROC curve (AUC) is also reported.
The metric performance values of the proposed method, mRMR (MID) and mRMR (MIQ) on the different real datasets are shown in Table 1. It is evident from the table that for the data series on cancer Cervicalsensitivity, specificity, and AUC are respectively 0.98, 0.9423, 0.9608, 0.9608 and 0.9892, which are better than the mRMR (MID) and mRMR (MIQ) patterns in all cases. Furthermore, the average correlation of the proposed method is 0.23, which is lower than the other two methods and indicates that the resulting characteristics given by the proposed method are the least correlated.
Summary Results
Figure 1.3 Graph for Categorization of True Positive
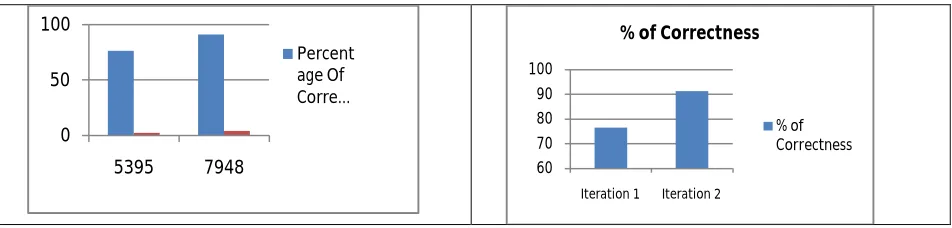
Figure 1.4 Graphs for Percentage of correctness based upon confusion matrix
V. DATASETSANDRESULTS
One real life data sets is used for the comparative study. The Cervical dataset is collected from the website: www.biolab.si/supp/bi-cancer/projections/info/. The dataset contain two classes of samples.
1. Cervical: Gene expression measurements for samples of Cervical tumors and adjacent Cervical tissue not containing tumor were used to build this classification model. It contains 50 normal tissue and 52 Cervical tumor sample. The expression matrix consists of 12533 numbers of genes and 102 numbers of samples.
Data Set method Sensitivity Specificityy Accuracy Fscore Avg Corr AUC
Cervical Cancer
Proposed Method
0.98 0.9423 0.9608 0.9608 0.23 0.9892
mRMR MID
0.96 0.9038 0.9314 0.932 0.322 0.9592
mRMR (MIQ)
0.978 0.923 0.951 0.9513 0.237 0.983
Knn Method
0.832 0.74 0.7909 0.813 0.1457 0.8717
Table 1.0 Results with existing methods
0 50 100
5395 7948
Percent age Of Corre…
60 70 80 90 100
Iteration 1 Iteration 2
% of Correctness
functions is taken as 100 for all algorithms. Using 10-fold cross-validation, sensitivity, specificity, precision and fscore score are calculated. Then, the mean correlation for evaluating the redundancy of the selected characteristics is also calculated. A smaller correlation value indicates that the selected functions are less redundant. In addition, the area under ROC curve (AUC) is also reported.
The metric performance values of the proposed method, mRMR (MID) and mRMR (MIQ) on the different real datasets are shown in Table 1. It is evident from the table that for the data series on cancer Cervical sensitivity, specificity, and AUC are respectively 0.98, 0.9423, 0.9608, 0.9608 and 0.9892, which are better than the mRMR (MID) and mRMR (MIQ) patterns in all cases. Furthermore, the average correlation of the proposed method is 0.23, which is lower than the other two methods and indicates that the resulting characteristics given by the proposed method are the least correlated.
Summary Results
Figure 1.1 Graph for Categorization of True Positive
Figure 1.3 Graphs for Percentage of correctness based upon confusion matrix
VI.CONCLUSION
Data analysts use data mining as a means to find quality knowledge in data mining. Data preparation is responsible for identifying quality data from system data. Fast data processing is very important because (1) real world data is not pure (2) requires high quality data for high efficiency mining systems and (3) static forms. We are easily looking for general items in a large warehouse using our process. We use fast algorithms as a basis for finding relevant information.
0 50 100
5395 7948
Percent age Of Corre…
60 70 80 90 100
Iteration 1 Iteration 2
% of Correctness
We focus on identifying the relevant pieces instead of guiding them. Our algorithm has a large dimension and confidentiality, with the necessary information. With the development of less time-consuming algorithms for data mining, we can take advantage of the ease of data mining and search results, even with comprehensive analysis.
REFERENCES
[1] F. Fleuret, “Fast Binary Feature Selection with Conditional Mutual Information,” J. Machine Learning Research, vol. 5, pp. 1531-1555, 2004. [2] G. Forman, “An Extensive Empirical Study of Feature Selection Metrics for Text Classification,” J. Machine Learning Research, vol. 3, p.
1289-1305, 2003.
[3] I. Guyon and A. Elisseeff, “An Introduction to Variable and Feature Selection,” J. Machine Learning Research, vol 3, pp. 1157- 1182, 2003. [4] M.A. Hall, “Correlation-Based Feature Subset Selection for Machine Learning,” PhD dissertation, Univ. of Waikato, 1999.
[5] G.H. John, R. Kohavi, and K. Pfleger, “Irrelevant Features and the Subset Selection Problem,” Proc. 11th Int’l Conf. Machine Learning, pp. 121-129, 1994. Xiaoqing Liu and Jagath Samarabandu, “Multiscale Edge-Based Text Extraction From Complex Images”, IEEE Trans., 1424403677, 2006
[6] K. Kira and L.A. Rendell, “The Feature Selection Problem: Traditional Methods and a New Algorithm,” Proc. 10th Nat’l Conf. Artificial Intelligence, pp. 129-134, 1992. Mr. Rajesh H. Davda1, Mr. Noor Mohammed, “ Text Detection, Removal and Region Filling Using Image Inpainting”, International Journal of Futuristic Science Engineering and Technology, vol. 1 Issue 2, ISSN 2320 – 4486, 2013
[7] D. Koller and M. Sahami, “Toward Optimal Feature Selection,” Proc. Int’l Conf. Machine Learning, pp. 284-292, 1996.
[8] I. Kononenko, “Estimating Attributes: Analysis and Extensions of RELIEF,” Proc. European Conf. Machine Learning, pp. 171-182,1994. [9] P. Langley, “Selection of Relevant Features in Machine Learning,” Proc. AAAI Fall Symp. Relevance, pp. 1-5, 1994.
[10] H. Liu and R. Setiono, “A Probabilistic Approach to Feature Selection: A Filter Solution,” Proc. 13th Int’l Conf. Machine Learning, pp. 319-327, 1996.
[11] H. Liu, H. Motoda, and L. Yu, “Selective Sampling Approach to Active Feature Selection,” Artificial Intelligence, vol. 159, nos. 1/2, pp. 49-74, 2004.
[12] T.M. Mitchell, “Generalization as Search,” Artificial Intelligence, vol. 18, no. 2, pp. 203-226, 1982.
[13] M. Modrzejewski, “Feature Selection Using Rough Sets Theory,” Proc. European Conf. Machine Learning, pp. 213-226, 1993.
[14] L.C. Molina, L. Belanche, and A. Nebot, “Feature Selection Algorithms: A Survey and Experimental Evaluation,” Proc. IEEE Int’l Conf. Data Mining, pp. 306-313, 2002.
[15] F. Pereira, N. Tishby, and L. Lee, “Distributional Clustering of English Words,” Proc. 31st Ann. Meeting on Assoc. for Computational Linguistics, pp. 183-190, 1993.
[16] M. Scherf and W. Brauer, “Feature Selection by Means of a Feature Weighting Approach,” Technical Report FKI-221-97, Institute fur Informatik, Technische Universitat Munchen, 1997.
[17] J. Souza, “Feature Selection with a General Hybrid Algorithm,” PhD dissertation, Univ. of Ottawa, 2004.