c
Owned by the authors, published by EDP Sciences, 2015
Dynamic behavior of zirconium alloy E110 under submicrosecond
shock-wave loading
D.N. Kazakov, O.E. Kozelkov, A.S. Mayorova, S.N. Malyugina, S.S. Mokrushin, and A.V. Pavlenkoa
RFNC-VNIITF, 456770, Snezhinsk, Chelyabinsk region, Russia
Abstract. Stress waves have been measured under shock wave loading of zirconium alloy E110 samples with the 0.5 – 8 mm thickness at normal and elevated temperatures. Duration of shock loading pulses varied from∼0.05 up to 1µs with the amplitude varying from 3.4 up to 23 GPa. Free-surface velocity profiles have been registered using VISAR and PDV interferometers with nanosecond resolution. Attenuation of the elastic precursor has been measured to determine plastic strain rate behind the elastic precursor front. The plastic strain rate was observed to decrease with propagation from 106s−1at the 0.46-mm distance down to 2·104s−1at the 8-mm distance. Spall strength has been measured under normal and elevated temperatures. Spall strength versus strain rate relationships have been constructed in the 105s−1– 106s−1range. Under shock compression higher than 10.6 GPa, the three-wave configuration of the shock wave has been registered and the polymorphousα→ωtransition is considered to be the reason of this phenomenon.
This work was supported by State Atomic Energy Corporation “Rosatom” within State Contract # H.4x.44.90.13.1111
1. Introduction
Investigation into processes of elastic-viscous-plastic deformation of metals and alloys under shock-wave loading [1] allows us to measure velocity-temperature relationships how these materials resist to deformation and fracture. In shock waves, a wide range of strain rates of solid bodies can be covered and thus we can accumulate experimental data that can serve as the basis for construction of defining relationships needed to predict materials behavior under high-intensity shock loads [2]. The structure of shock waves in solid bodies depends on processes of their elastic-viscous-plastic deformation, possible phase transformations, as well as on kinetics of fracture incipience and development [3–5]. In recent years, shock-wave methods were used for [6–9] systematic investigations into the velocity-temperature relationships for yield stresses and fracture of pure metals with face-centered and body-face-centered cubic structures. These data are practically absent for metals with hexagonal close-packed structure.
Interest to zirconium and alloys on its basis is inspired by a wide application of this material in nuclear power engineering due to happy combination of its nuclear physical (small thermal-neutron capture cross-section), physical-and-mechanical characteristics, processing behavior and also resistance to corrosion. Zirconium – is a polymorphous metal that has a hexagonal close-packed lattice under normal conditions and belong to transition metals. Zirconium alloy E110 (Zr – 1.0% Nb) – is one of the main commercial alloys for nuclear power engineering. Experimental data on dynamic properties of zirconium alloys in the area of high-strain rate deformation
aCorresponding author:[email protected]
are practically unavailable. The considered experimental investigation results for zirconium alloy E110 samples loaded in well-controlled conditions is an attempt to fill this gap.
2. Material and experimental setup
Zirconium alloy E110 contains niobium (Nb 1%) as an alloying component; principal impurities – are iron and oxygen (O and Fe less than 0.1%), the rest admixtures (tin, hafnium, nickel, chromium, carbon, silicon, etc.) in the aggregate do not exceed 0.25%. The alloy has 6.5 g/cm3density, 160 MPa yield strength, and 270–310 MPa ultimate strength.
The material was studied in the as-received condition. The rod with the 35-mm diameter was sliced into disks with the thickness of 0.5, 1.0, 2, 4, and 8 mm to serve as zirconium alloy E110 samples for tests. Unevenness of the sample surface after processing was within 2.5–6µm. The ultrasonic technique and samples with the 8-mm thickness were used to determine longitudinal cland shear cs sound velocities: cl=4700±15 m/s and cs = 2262±5 m/s. Volume sound velocity was estimated to be c0=3.91 km/s. In order to estimate stresses arising in
the samples, we used Hugoniot adiabat of zirconium D= 3.91+0.91u (km/s), where D – is shock wave velocity, u– is mass velocity [10] with a correction for sound velocity data obtained for alloy E110.
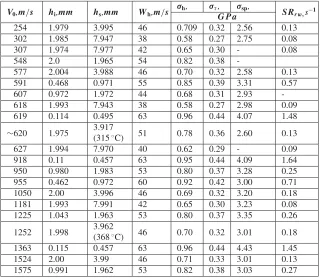
Table 1. Setting Data on experimental setups and measured strength characteristics of zirconium alloy E110.
V0,m/s hi,mm hs,mm Wh,m/s
σh, στ, σsp,
S Rrw,s−1 G P a
254 1.979 3.995 46 0.709 0.32 2.56 0.13
302 1.985 7.947 38 0.58 0.27 2.75 0.08
307 1.974 7.977 42 0.65 0.30 - 0.08
548 2.0 1.965 54 0.82 0.38
-577 2.004 3.988 46 0.70 0.32 2.58 0.13
591 0.468 0.971 55 0.85 0.39 3.31 0.57
607 0.972 1.972 44 0.68 0.31 2.93
-618 1.993 7.943 38 0.58 0.27 2.98 0.09
619 0.114 0.495 63 0.96 0.44 4.07 1.48
∼620 1.975 3.917
(315◦C) 51 0.78 0.36 2.60 0.13
627 1.994 7.970 40 0.62 0.29 - 0.09
918 0.11 0.457 63 0.95 0.44 4.09 1.64
950 0.980 1.983 53 0.80 0.37 3.28 0.25
955 0.462 0.972 60 0.92 0.42 3.00 0.71
1050 2.00 3.996 46 0.69 0.32 3.20 0.18
1181 1.993 7.991 42 0.65 0.30 3.23 0.08
1225 1.043 1.963 53 0.80 0.37 3.35 0.26
1252 1.998 3.962
(368◦C) 46 0.70 0.32 3.01 0.18
1363 0.115 0.457 63 0.96 0.44 4.43 1.45
1524 2.00 3.99 46 0.71 0.33 3.01 0.13
1575 0.991 1.962 53 0.82 0.38 3.03 0.27
thickness were formed by the striker having 0.5-; 1-, and 2-mm thickness and experiments with 8-mm thick samples used 2-mm thick strikers. Impact velocity varied from 0.25 to 1.6 km/s. Striker velocity was measured with the error at least 0.5%. In experiments with the up to 1 km/s velocity, out-of-parallelism of impacting surfaces was∼1 mrad with the velocity higher than 1 km/s–2..4 mrad. Experiments were performed in conditions of vacuum.
Resistance heaters were used for tests under elevated temperatures in order to heat up samples to the required temperatures and this heating took not more than 15 minutes. Temperature was monitored with the accuracy of ±5◦C by T-type thermocouples fixed at the lateral surface of samples.
Laser Doppler interferometers VISAR [12] and PDV [13] recorded velocity profiles W (t) for the free surface of samples. Surface sounding area for VISAR-interferometer was in the center of the sample and diameter of this area was not more than 0.8 mm. Sounding area for PDV-interferometer was shifted from the sample center by 3 mm and was not more than 0.4 mm. Time resolution of VISAR-interferometer is at least 2 ns, its velocity resolution is not more than 1% when velocities are measured within 0.3– 1.6 km/s. The Hilbert method was used to process PDV interferometric data.
3. Measurement results
Table 1 gives (new and previous [14]) basic data on the setup of shock-wave experiments, as well as certain measured strength characteristics of zirconium alloy E110. We also used the following designation: V0–impact
velocity, hi–impactor thickness, hs–sample thickness, Wh–velocity at the front of the elastic precursor,
Figure 1. Free-surface velocity profiles for Zirconium alloy E110
samples.
σh=σH E L–dynamic elastic limit, στ–dynamic yield stress,σsp- spall strength, SRrw–strain rate in a rarefaction wave (V/V0).
The value of the dynamic elastic limit σH E L = ρ0cl Wh/2 agrees with conditions of uniaxial deforma-tion; this value is converted to the yield strength in standard conditions of uniaxial stressed state στ using a simple relationshipστ=3/2σH E L(1-(cb/cl)2).
Figure1 shows free-surface velocity profiles W (t)for Zirconium alloy E110 samples having 0.5-; 2-; 4- and 8-mm thickness under different-intensity impacts.
Figure 2. Free-surface velocity profiles for Zirconium alloy
E110 samples. Profiles have designated velocity of the striker and nominal thickness of samples; exact values of thickness for samples and strikers are given in Table1.
pressure is higher than 16 GPa, the two-wave configuration “closes” due to the fact that the velocity of the wave with phase transformation becomes equal to or higher than the plastic shock wave velocity. When impact velocity varies, the compression stress on the elastic precursor remains practically unchanged. It follows that in this range of parameters, attenuation of the elastic precursor is practically independent of the final shock compression pressure.
All sample free-surface velocity profiles demonstrate decrease of parameters in the rarefaction wave behind the area of steady-state flow. Interaction of the incident and reflected rarefaction waves leads to generation of tensile stresses inside the sample and to its spall fracturing. Relaxation of tensile stresses due to fracturing causes initiation of the compression wave in the stretched material and arrival of this wave at the surface is accompanied by the repeated increase of its velocity, which is called spall pulse. The subsequent periodic fluctuations of the free-surface velocity are conditioned by waves reverberation, i.e. reflection of rarefaction and compression waves from the surface on the separated layer of the material.
Spall strength was estimated based on measured free-surface velocity decrease under unloading from the shock-compressed state taking into account correction for the velocity profile distortion caused by the difference in the velocity of spall pulse and plastic wave propagation in the unloading area [4].
Elastic precursor and plastic flow behind its front. Figure 2 gives measured profiles for the free surface velocity of zirconium alloy E110 samples having different thickness. Each profile has designated thickness of samples and velocity of the striker that has generated the compression wave in the sample. Amplitude of the elastic precursor decreases with its propagation. Elastic precursor attenuation is conditioned by relaxation of tresses due to plastic deformation development.
Measurement results for the elastic precursor attenua-tion are given in Fig.3. Similar to previous studies [6–9, 14–16], attenuation measurement results are approximated by the following empirical relation:
σh = S(h/h0)−α, (1)
Figure 3. Relationships of measured dynamic elastic limit σh, yield strengthστ, calculated plastic train rateγp, and measured strain rate behind the elastic precursor front
where S= 0.87GPa,α= 0.138, and h0=1 mm. The
elastic precursor attenuation is related to the plastic deformation rateγpjust behind its front by the relationship [15,17]:
dσx/dh|H E L =−4/3Gγp/cl, (2) where G–is shear modulus,σx – is compression stress in the direction of wave propagation, h–is distance covered by the wave. Taking into account relationship (1), the plastic deformation rate can be expressed as:
γ
p =−3/4(Sαcl(h/h0))−(α+1)/(h0G). (3)
After the wave-covered distance h from relationship (1) is substituted into (3), we have the initial velocity of the “plastic shear deformation versus shear stress behind the precursor front” relationship:
γ
p =3/4(τE/(SG))
(α+1)/αSαc
l/(h0G). (4)
Figure 3 shows data on the dynamic elastic limit attenuation, empirical relationship (1), and appropriate plastic deformation rate.
Plastic deformation rate behind the elastic precursor front changes from 106 s−1 at the 0.46-mm thickness of
samples up to 2·104s−1at the 8-mm thickness of samples and this is almost one order of magnitude higher than the plastic deformation rate in magnesium alloy Ma-2 [15].
Analysis of elastic precursor attenuation provides information on the initial plastic deformation rate directly after the elastic limit is attained. Measurements of compression velocity in the plastic shock wave provide data on the material behavior at the follow-on stages and usually at higher deformation rates. The maximum plastic deformation rate of alloy E110 in the plastic shock wave is 5·105 s1 at the impact velocity of 254 m/s (compression stress behind the plastic shock wave is 3.4 GPa) and 1.3·107s−1at the impact velocity of 577 m/s
(compression stress – is 7.8 GPa). The maximum shear stresses in the plastic shock wave were 173 GPa and 284 GPa, respectively.
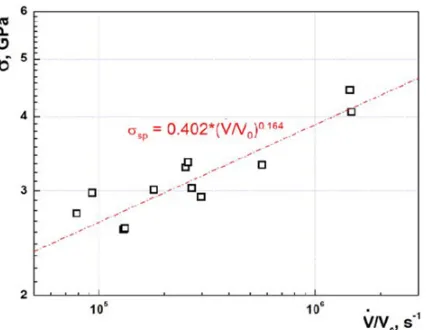
Figure 4. Measured spall strength of zirconium alloy samples
versus deformation rate under expansion.
probably a well-known transformationα→ω[18]. As the first plastic shock wave propagates, pressure at its front, which corresponds to transformation onset, decreases from 11.2 GPa for the sample having 0.46-mm thickness down to 10.6 GPa when this wave leaves the sample having 4-mm thickness. Pressure decrease in the first plastic shock wave as it is propagating is indicative of the final velocity of phase transformation. When striker velocity is 1181 m/s, loading amplitude becomes sufficient for the principal wave to begin to “close” the first plastic shock wave.
Spall strength. Figure4 shows results of processing the stress wave profiles as the “spall strength versus the material expansion rate in the unloading part of the incident compression pulse” relationship.
Measurement results for the elastic precursor attenua-tion are given in Fig.3. Similar to previous studies [6–9, 14–16], attenuation measurement results are approximated by the following empirical relation:
σsp =0.402 (V/V0)0.164GPa. (5)
Relationship (5) also determines how the initial rate of discontinuities growth depends on stresses and can be used to construct a macrokinetic model of fracturing.
Experimental data given in Fig.4cover the impact load duration range from∼0.05µs up to 1µs and, respectively, spall thicknesses – from 0.08 mm up to 2 mm.
Figure 5 illustrates how the dynamic elastic limit and spall strength of zirconium alloy E110 depend on temperature. We were forced to limit experiments to the temperature of 370◦C as zirconium looses its reflectivity even if its surface is protected by deposited gold.
In the meantime, zirconium alloy members are usually in service just in this temperature range.
Wave profiles were processed taking into account temperature relationships of elastic moduli given in [19]. Particularly in this temperature range, shear modulus of zirconium decreases by 20% and the longitudinal sound velocity–by 3.2%.
Comparison of wave profiles in Fig. 5 shows 10% growth in the dynamic elastic limit of zirconium, i.e. from 640 MPa at room temperature up to 710 MPa at 315◦C. Calculation of the appropriate yield strength
Figure 5. Free-surface velocity profiles W (t) for Zirconium alloy
E110 samples having 4-mm thickness loaded by the impact of the 2-mm plate from the same material at a rate of about 600 m/s under normal and elevated up to 315◦C temperatures.
στ =1.5σH E L(1−(cb/cl)2) taking into account the time-dependent longitudinal sound velocity demonstrated that yield strength decreases from 300 MPa at room temperature down to 280 MPa at 315◦C. Spall strength was measured at normal and elevated temperatures in very similar loading conditions taking into account measurement errors and it proved to remain unchanged and to be equal to 2.7 GPa.
4. Conclusion
The paper presents measurement results for dynamic characteristics of zirconium alloy E110 in the range of loading duration from ∼0.05µs up to 1µs when the pressure amplitude in the shock wave varies from 3.5 up to 23 GPa. Measured dependences of elastic precursor attenuation allowed us to estimate the plastic deformation rate that changes from 106 s1 at the 0.46-mm thickness of samples to 2·104s−1 at the 8-mm thickness and this
practically one order of magnitude higher than the plastic deformation rate in zirconium alloy E635, VT1-0 titanium and magnesium alloy Ma-2.
The reason why the compression wave is split into the three-wave configuration under pressure higher than 10.6 GPa (striker velocity is higher than 780 m/s) is the polymorphous α→ωtransformation. Attenuation of the first plastic shock wave indicates the final rate of phase transformation. Splitting of the plastic shock wave “closes” when the impact velocity is more than 1.2 km/s.
Spall strength of zirconium alloy increases with the deformation rate according toσsp =0.402(V/V0)0.164.
Spall strength of the material is practically independent of heating up to 315◦C.
Authors express their sincere gratitude to G.I. Kanel for problem statement and useful discussions during this work implementation.
References
[1] G.I. Kanel, V.E. Fortov, S.V. Razorenov. Rus.J. UFN (“Uspekhi Fizicheskikh Nauk”- Advances in Physical Sciences), v. 177, 8, pp. 809–830 (2007).
[2] E.N. Avrorin, B.K. Vodolaga, V.A. Simonenko, V.E. Fortov. Rus.J. UFN, v. 163, 5, pp. 1–34 (1993).
[3] G.I. Kanel, S.V. Razorenov, A.V. Utkin, V.E. Fortov. Shock-wave phenomena in condensed media. M.: “Yanus –K”, p. 408 (1996).
[4] G.I. Kanel. R.J. Rus.J. PMTF (Applied Mechanics and Technical Physics), v. 42, 2, c. 1–5 (2001). [5] G.I. Kanel, S.V. Razorenov, A.V. Utkin, V.E. Fortov.
Experimental profiles of shock waves in condensed matter. M.: FIZMATLIT (2008).
[6] E.B. Zaretsky, G.I. Kanel. J. Appl. Phys. 110 (7), 073502 (2011).
[7] E.B. Zaretsky and G.I. Kanel. J. Appl. Phys. 112, 073504 (2012).
[8] E.B. Zaretsky and G.I. Kanel. J. Appl. Phys. 114, 083511 (2013).
[9] E.B. Zaretsky and G.I. Kanel. Journal of Applied Physics 115, 243502 (2014).
[10] M.V. Zhernokletov, V.N. Zubarev, R.F. Trunin, V.E. Fortov. Experimental data on shock compressibility and adiabatic expansion of condenced matter under high energy densities. Chernogolovka Publisher (1996).
[11] A.V. Pavlenko, S.I. Balabin, O.E. Kozelkov, D.N. Kazakov. Rus.J. PTE, (Instruments and experimental technique), 4. pp. 122–124 (2013).
[12] A.V. Pavlenko, S.N. Malyugina, V.V. Pereshitov, I.N. Lisitsyna. Rus.J. PTE, (Instruments and experimental technique), 2. pp. 127–129 (2013).
[13] S.S. Mokrushin, N.A. Anikin, S.N. Malyugina, A.A. Tyaktev, A.V. Pavlenko. Rus.J. PTE, (Instruments and experimental technique), 4, pp.107–110 (2014). [14] D.N. Kazakov, O.E. Kozelkov, A.S. Mayorova,
S.N.Malyugina, S.S. Mokrushin and A.V. Pavlenko, Rus. J. MTT, 6, 77–86 (2014).
[15] G.V. Garkushin, G.I. Kanel, S.V. Razorenov. Rus.J. FTT (Solid State Physics), v. 54, 5, pp. 1012–1018 (2012).
[16] S.V. Razorenov, G.I. Kanel, G.V. Garkushin, O.N. Ignatova. Rus.J. FTT (Solid State Physics), v. 54, issue 4, pp. 742–749 (2012).
[17] Duvall G.E. In: Stress Waves in Anelastic Solids, edited by H. Kolsky and W. Prager, Berlin: Springer-Verlag. p. 20 (1964).
[18] P.A. Rigg, C.W. Greeff, M.D. Knudson and G.T. Gray III. In Proc. 16th Int. Conf. of American Institute of Physics. Shock Compression of Condensed Matter–p. 1171–1174 (2009).