DOI: 10.1534/genetics.107.078584
Toward a Systems Biology of Mouse Inner Ear Organogenesis: Gene
Expression Pathways, Patterns and Network Analysis
Samin A. Sajan,* Mark E. Warchol
†and Michael Lovett*
,1*Department of Genetics, Washington University School of Medicine, St. Louis, Missouri 63310 and†Department of Otolaryngology, Washington University School of Medicine, St. Louis, Missouri 63310
Manuscript received July 9, 2007 Accepted for publication July 10, 2007
ABSTRACT
We describe the most comprehensive study to date on gene expression during mouse inner ear (IE) organogenesis. Samples were microdissected from mouse embryos at E9–E15 in half-day intervals, a period that spans all of IE organogenesis. These included separate dissections of all discernible IE substructures such as the cochlea, utricle, and saccule. All samples were analyzed on high density expression microarrays under strict statistical filters. Extensive confirmatory tests were performed, including RNAin situ hybridi-zations. More than 5000 genes significantly varied in expression according to developmental stage, tissue, or both and defined 28 distinct expression patterns. For example, upregulation of 315 genes provided a clear-cut ‘‘signature’’ of early events in IE specification. Additional, clear-clear-cut, gene expression signatures marked specific structures such as the cochlea, utricle, or saccule throughout late IE development. Pathway analysis identified 53 signaling cascades enriched within the 28 patterns. Many novel pathways, not previously implicated in IE development, includingb-adrenergic, amyloid, estrogen receptor, circadian rhythm, and immune system pathways, were identified. Finally, we identified positional candidate genes in 54 uncloned nonsyndromic human deafness intervals. This detailed analysis provides many new insights into the spatial and temporal genetic specification of this complex organ system.
M
ORE than 10% of the human population hashearing or balance disorders; two-thirds of these are between the ages of 21 and 65. One newborn out of
1000 suffers from profound deafness (Parving 1993;
Mehland Thompson1998), and up to 15% of children between 6 and 19 years of age have some form of hear-ing loss (Marazita et al. 1993; Niskar et al. 1998). Environmental causes play a significant role in this, but genetic determinants are estimated to account for at least one-half of all congenital hearing and balance disorders. In light of these facts, it is clearly important to understand the genetic program of normal devel-opment for the mammalian inner ear (IE). One ap-proach to that end is to screen for single gene defects that result in either balance or hearing deficiencies (i.e., abnormal development of the IE). This has been a productive route in the mouse where both auditory and balance phenotypes are relatively easy to score (Avraham2003). However, such single gene approaches are slow to yield information on critical pathways or networks of genes. In this article we describe the most
comprehensive analysis to date on transcriptional changes in the developing mammalian IE, with an emphasis on discovering the pathways and networks that underlie organogenesis in this complex set of structures.
The mature mammalian IE has two major compo-nents: the vestibular and auditory organs. The vestibular organ senses balance and changes in movement. It contains the three semicircular canals that sense angu-lar acceleration and the utricle and saccule, both of which are responsible for sensing gravity and linear acceleration. The auditory organ consists of the coiled cochlea, which senses sound. Within both of these organs a specialized sensory epithelium converts mechanical actions into electrical potentials. These epithelia contain sensory hair cells—mechanoreceptors that initiate action potentials in response to sound or movement—as well as surrounding supporting cells. Damage to this small population of hair cells is a major cause of hearing loss. There are numerous other cell types in the IE that are also required for the mechanical, electrical, and struc-tural aspects of hearing and balance. Examples of such cell types are the nonsensory supporting cells
surround-ing the hair cells (Raphael and Altschuler 2003),
those of the stria vascularis on the lateral wall of the cochlear duct, responsible for the production of the
endocochlear electrical potential (Takeuchi et al.
2000), and those of the various membranes on which the sensory organs rest and that separate the different
Sequence data from this article have been deposited with the National Center for Biotechnology Information’s Gene Expression Omnibus under series accession no. GSE7536.
1Corresponding author: Division of Human Genetics, Department of
Genetics, Washington University School of Medicine, 4566 Scott Ave., St. Louis, MO 63110. E-mail: [email protected]
compartments of the IE (Sulik 1995; Raphael and Altschuler2003).
The morphological events that accompany organo-genesis of the IE and some of the signaling molecules involved in the patterning of the IE, have been de-scribed in some detail (Sulik 1995; Gallagher et al. 1996; Morsliet al. 1998; Fritzschet al. 1998; Cantos et al. 2000; Kelleyet al. 2005). In the mouse, the IE first becomes evident as an otic placode at embryonic day (E) 8.5. These placodes are bilateral thickenings of the lateral ectoderm above the hindbrain. These invagi-nate and form otic cups/pits by E9 and eventually otic vesicles/otocysts by E9.5. The otocyst elongates and forms a dorsal vestibular pouch and a ventral cochlear pouch. At around E12.5, the utricle, saccule, and the three semicircular canals of the vestibular organ be-come visually discernible. The sensory hair cells in the vestibular organ appear at about E13, a day earlier than
they do in the cochlea (Ruben 1967; Anniko 1983;
Lumpkinet al. 2003). Full development of the IE con-tinues postnatally; the mouse IE does not become fully mature until three weeks after birth, but by E15 all of the major structures and cell types are already present.
One step toward understanding how the IE devel-ops and functions in its entirety is to catalog the time and place of expression of all genes expressed within this complex organ. Currently, there are several re-sources that list information about some of the protein-coding genes expressed in different regions of the IE and/or whether any are known to cause an IE defect when mutated (http://www.sanger.ac.uk/PostGenomics/ mousemutants/deaf/; http://www.jax.org/hmr/map. html; http://webhost.ua.ac.be/hhh/; http://www.ihr.mrc.
ac.uk/hereditary/genetable/index.shtml) (Robertson
et al. 1994; Anagnostopoulos 2002; Resendes et al. 2002; Beiselet al. 2004; Kelleyet al. 2005). These assist in identifying genes that function in the IE, but they fail to provide a dynamic temporal pattern of expression of such genes over a larger timescale. This is primarily due to the fact that most studies to date have sampled genes from just one particular time point and many have sampled genes from tissues that are quite heteroge-neous. Hawkinset al. (2006) and others (Robertson et al. 1994; Resendeset al. 2002; Beiselet al. 2004) have constructed cDNA libraries from IE tissues, but these resources, while valuable, are not comprehensive. Sev-eral microarray expression profiling studies of the IE also exist (Chenand Corey2002; Hawkinset al. 2003; Lin et al. 2003; Liu et al. 2004; Toyamaet al. 2005). While these are undoubtedly useful in identifying genes expressed at particular stages of IE development, they are limited by the fact that they either only provide a static view of gene expression or describe expression of a selected category of genes at multiple stages that are sep-arated from one another by large gaps. Moreover, such studies do not cover all the sensory regions of the IE.
Here, we describe a new resource for data mining and discovery of genes involved in IE organogenesis. This involved large-scale gene expression profiling across all stages and substructures of IE development and in-cluded the discovery of novel pathways and patterns that act during this complex process. Specifically, we describe 28 distinct patterns of gene expression on the basis of tissue type, developmental stage, or a combina-tion of both. Genes from each type of pattern were used to identify 53 significant biological signaling pathways potentially active during IE development. Many of these pathways have not previously been implicated in IE organogenesis. We have also validated the expression of a selected number of genes using independent means
such as RNA in situs and semiquantitative RT–PCR.
Finally, we present a large number of new candidate genes that map to uncloned human deafness intervals. Our entire data set is freely available online½Gene Expression
Omnibus (GEO) series accession no. GSE7536 and
should provide a valuable source of new individual genes and networks for further genetic investigations.
MATERIALS AND METHODS
IE dissections: Timed pregnant CBA/J mice were eutha-nized with carbon dioxide, and IE tissues were dissected as described (Lumpkinet al. 2003). For each gestational stage, two biological replicates were collected, i.e., two pools of tissues from different identical staged litters. From E9–E10, IE epithelia from five to eight embryos were pooled. From E10.5 to E12, the ventral cochlear region and the dorsal vestibular region (without the endolymphatic duct) were separated and pooled separately for each stage from five to eight embryos. For stages E12.5–E15, the cochleae and the saccules from three to six embryos were separately pooled, whereas the utricles and the ampullae of the three semicircular canals were combined and pooled together (without the endolymphatic duct and canals). This utricle/ampullae mixture is referred to as ‘‘utricles’’ in the text. The noninner ear (NIE) tissues were also obtained from each stage and pooled as follows: stage E9 NIE tissues were pooled from four to five embryos per rep-licate; from E9.5 to E10.5 NIE was pooled from two to seven embryos; for E11–E15 NIE tissue was pooled from two to four embryos. Thus, a total of 29 IE and 3 NIE samples were ob-tained, each in duplicate, from 13 distinct developmental stages. RNA isolation, cDNA synthesis, target synthesis:Total RNA was isolated and processed as described (Hawkinset al. 2003). Total RNA was resuspended in either 7–10ml (for stages E9– E10.5) or 15–20ml (for stages E11–E15) of H2O. RNA quality was assessed by agarose gel electrophoresis of an aliquot of total RNA. PolyA RNA was isolated and converted to cDNA as previously described (Hawkins et al. 2003). This cDNA was then PCR amplified for a total of 12 cycles. Biotin-labeled target (cRNA) was derived from this cDNA byin vitro scription reactions using the BioArray HighYield RNA tran-script labeling kit (ENZO Life Sciences, New York) and a T7 promoter embedded within the 39 end of the cDNA PCR products. Labeled cRNA was purified and eluted in water using an RNA purification kit (QIAGEN, Valencia, CA) following the manufacturer’s instructions.
MOE430A_2 Affymetrix arrays, and scanned following stan-dard Affymetrix protocols. Supplemental Materials and Methods (http://www.genetics.org/supplemental/) extensively describes all aspects of data normalization, intensity filtering, and the generation of lists of probe sets/genes with specific expression patterns½e.g., early–middle–late (EML) analysis, etc..
Gene ontology annotations: Genes from various ‘‘present’’ lists and expression pattern types were uploaded in eGoN (http://www.genetools.microarray.ntnu.no/egon/index.php), a web-based tool for classifying multiple gene lists simulta-neously on the basis of gene ontology (GO) annotations and finding statistically over-represented categories (cumulative hypergeometric probability of #0.05). All gene lists were uploaded using Affymetrix probe sets (only one per unique gene), and tests were carried out using the ‘‘Master-Target’’ option.
Identifying significant biological pathways:The various lists of differentially expressed genes were analyzed by Ingenuity pathways analysis (IPA) (Ingenuity Systems, Redwood City, CA). Genes from each of the individual 28 expression patterns together with their ratios ($1.5-fold) were uploaded in IPA using Entrez IDs as gene identifiers to identify significant biological pathways. Genes that did not have Entrez IDs in the Affymetrix NetAffx database were instead represented by probe set IDs. All genes within the resulting networks (focus and nonfocus genes) were exported from IPA. We next determined whether the nonfocus genes from each list were ‘‘present’’ or ‘‘absent’’ in our data set regardless of whether or not they were differentially expressed. These expanded lists were then re-uploaded in IPA to determine pathway signifi-cance. Note that the ratio of all nonfocus genes was designated as negative three. Only pathways that had at least two genes differentially expressed were considered. For the ‘‘middle’’ and ‘‘late’’ analyses, we re-uploaded focus genes combined with nonfocus genes that were both present and at the same time passed the ANOVA testP-value cutoff of#0.005.
Whole mount RNA in situ hybridizations: PCR products were amplified (with primers that contained a T7 promoter at one or the other end) using cDNA from various developmen-tal stages throughout the time course. The following are the
specific nucleotides amplified:FoxP1nucleotides 1341–1546, NM_053202; Hey2nucleotides 1333–1437, NM_013904; Irx5 nucleotides 1600–1854, NM_018826; and Clu nucleotides 1291–1540, NM_013492. These were sequence verified and used for in vitro synthesis of DIG-labeled RNAs using Ambion’s T7 megascript RNA synthesis kit. See supplemental Materials and Methods for sequences of the probes. Approx-imately 1 ng/ml of the labeled RNA was used in in situ hybridizations that were carried out as described (http:// axon.med.harvard.edu/cepko/protocol/ctlab/ish.ct.htm). Hybridization was carried out at 58–60°. All steps were carried out either on whole IEs still in temporal bone (stages E13 and beyond) or on whole embryos (E11.5 and younger). After signal developed, whole IEs were dissected from the embryos E11.5 and younger, and tissues from all stages were incubated in 3–5 mg/ml dispase (Gibco, Grand Island, NY) at 37°for 1–2 hr. The IE epithelium was then dissected free of the cartilage and other NIE tissue and photographed.
RESULTS
and illustrates the attention that was paid to obtaining high quality samples. Tissues from E9 to E10, classified as ‘‘early,’’ were gene expression profiled in their entirety. Those from E10.5 to E12, designated as ‘‘middle’’ stages, were separated into the dorsal vestibular organ and the ventral cochlea. Each of these was then separately analyzed on gene chips. Tissues from ‘‘late’’ stages,i.e., from E12.5 to E15, were separated into three parts: the cochlea, the saccule, and the utricle (the latter being combined with the superior, posterior, and lateral ampullae). These three tissue types were then separately profiled. Thus, a total of 29 IE samples were analyzed from the 13 developmental stages, each being collected in duplicate (from different mouse litters). In addition to these tissues, we also dissected adjacent noninner tissues (NIE) from areas in close proximity to the IE tissue at each stage. This enabled us to subsequently estimate whether observed changes in gene expression were specific to the IE or a more broad reflection of stage-specific changes across many cell types. Specifi-cally, NIE tissue from E9, consisting primarily of a mixture of neuroepithelial and mesenchymal cells, was profiled by itself. NIE tissues from E9.5 to E10.5, consisting mostly of ganglia, mesenchymal, and vascular cells, were combined and profiled together. Finally, NIE tissues from E11 to E15, mostly composed of mesen-chyme, ganglia, vascular cells, the modiolus, and early cartilage were pooled and profiled together.
Measures of reproducibility and reliability: In all microarray studies, and particularly those performed
with microdissected samples that may vary in quality, it is important to determine the limits of reliability and re-producibility of such a large data set. In this regard, we performed four types of independent tests on our profiling data to check these parameters, in addition to the confirmatory RNAin situsdescribed below½and others in supplemental materials (http://www.genetics. org/supplemental/). These tests are described in de-tail in supplemental Materials and Methods and in all cases provided strong confirmation of the data quality. Analysis of genes scored as present or absent, regardless of differential expression, is also provided in supple-mental Materials and Methods.
Identifying classes of differentially expressed genes:
resolution as supplemental Figure 6). These SOMs re-present a form of unsupervised clustering that group genes with similar patterns of expression across the time course (Golub et al. 1999; Tamayoet al. 1999; Reich et al. 2004). The centroids of Figure 2 have been ar-ranged into five groups (A–E) according to the similar-ity of their gene expression patterns. Thus, all of the centroids in group A show genes (a total of nine, listed to the right of the centroids) that decrease in gene expression in NIE samples relative to the IE samples. This pattern of dramatic changes in the NIE relative to IE is the predominant one observed in this analysis. Groups B and C show patterns in which expression decreases (B) or increases (C) in the NIE. Many of the upregulated genes in the NIE are components of the cytoskeleton and/or the extracellular matrix such as collagens, glycans, and proteases (supplemental Table 7). In some cases, genes that change in expression in the NIE samples also show relatively large changes in expres-sion in at least one IE sample. For example, the otoconin-90 gene, which encodes the major protein component of the otoconia (Verpyet al. 1999), is downregulated in the E9 placode and in the NIE tissues relative to all other samples (group B, centroid 0 in Figure 2). Within the IE, it appears to be detectably expressed in all samples except the placode at E9. Eight additional genes in centroids 13 and 14 of group B also exhibit this pattern of gene expression. Overall, a total of 90 genes show the predominant NIE pattern of up- or downregulation relative to the IE samples. The remaining 19 genes fall into two classes; 14 show upregulation in the E9 otic cup and also some increased level of expression in the NIE tissues. Examples include theSlc2a3gene that encodes a solute carrier transporter andHapln1, which encodes a hyaluronan and proteoglycan link protein. The final seven genes exhibit just one pattern of expression; upregulation of expression in the E15 cochlea (group E of Figure 2). This group includes the insulin-like growth factor-1 gene (Igf1), which is required for the normal post-natal survival, maturation, and differentia-tion of the cochlear ganglion cells, and also for the nor-mal innervation of cochlear sensory hair cells (Camarero et al. 2001). The significance of a spike in expression at E15, however, remains to be investigated further. Also in Figure 2E is the gene encoding a meteorin-like protein (Metrnl), which may play a role in axonal guidance and network formation (Nishinoet al. 2004), theCalb1gene that encodes the calcium-binding protein calbindin-28K (Dechesneand Thomasset, 1988), the gene-encoding integrin a-8 ½which, when knocked out in the mouse, results in hair cells with malformed stereocilia (Evans and Muller, 2000), two genes encoding proteoglycans (Spock1andDspg3), and the product of the mouseSilver locus (Silv). Expression of this latter gene is believed to be melanocyte specific (Theoset al. 2006). Its detection in the E15 cochlea may reflect the activity of the population of melanocytes in the developingstria vascularis.
To detect broader trends in gene expression, rather than the more infrequent, discrete, and dramatic changes in expression described above, we conducted a series of comparisons between time points and tissues. These are shown in Tables 1 and 2 and fall into four types of analysis, which we named according to the types of gene expression pattern that they highlight: early–middle– late, middle, late, and IEvs. NIE. Within these analyses we then derived different patterns of gene expression. Details on each type of comparative analysis and the patterns of gene expression that they reveal are de-scribed below.
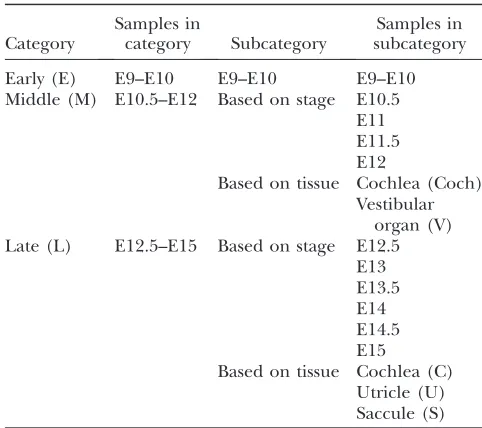
Table 1 shows the groupings of stages and tissues that we employed in this study. All samples from E9 to E10 (three samples in total) were considered the early (E) category, while the ones from E10.5 to E12 were considered parts of the middle (M) category (these were further divided into four subcategories on the basis of developmental stage and two subcategories on the basis of tissue type). Samples from E12.5 to E15 were des-ignated as late (L) and comprised six subcategories on the basis of developmental stage and three on the basis of tissue type. All of these various groups were compared to one another to identify genes that changed in expres-sion only according to tissue type, or to developmental
TABLE 1
Classification of samples for data analysis
Category
Samples in
category Subcategory
Samples in subcategory Early (E) E9–E10 E9–E10 E9–E10 Middle (M) E10.5–E12 Based on stage E10.5
E11 E11.5 E12
Based on tissue Cochlea (Coch) Vestibular
organ (V) Late (L) E12.5–E15 Based on stage E12.5
E13 E13.5 E14 E14.5 E15
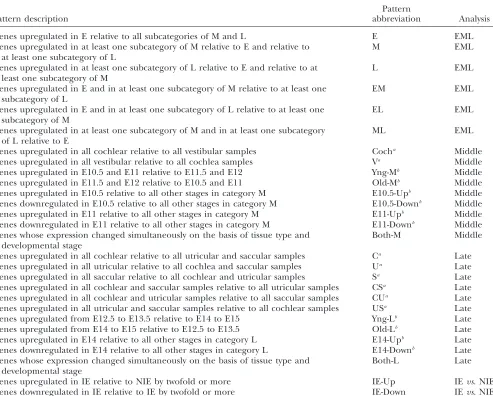
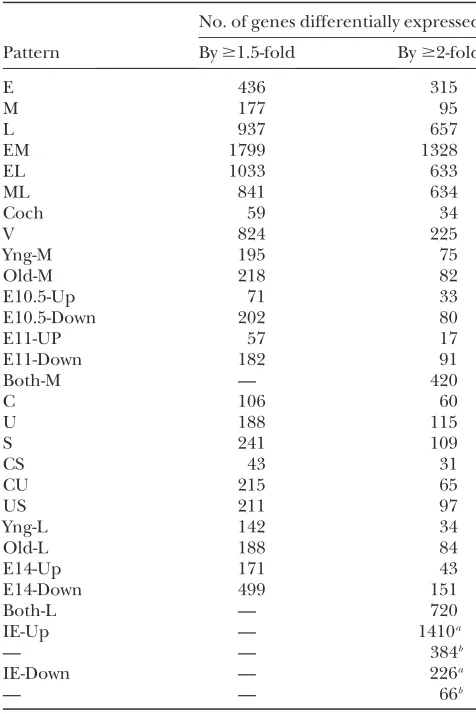
stage, or according to both tissue and time point. Table 2 describes the 28 different patterns of gene expression that were identified in these analyses, and Table 3 lists the number of genes that exhibited a.1.5-fold change in expression and also those that changed by.2-fold in each of the identified patterns. The lower fold-change cutoff was chosen so as to include genes known to be differentially expressed during these developmental stages and that also cause IE defects in mouse when mutated (e.g.,Ctnnb1,Eya1,Eya4,Gja1,Gjb6,Notch1, and Sox10among others).
In EML analysis, we identified six different expression patterns. To accomplish this we compared the genes
present in category E with those present in each sub-category of M and L. Significant analysis of microarrays (SAM) (Tusheret al. 2001) was used to identify those differentially expressed by at least 1.5-fold with an estimated false discovery rate (FDR) of#0.5%. On the basis of these comparisons, we then inferred the com-parisons between each subcategory of M and L (see supplemental Materials and Methods). Genes that met the fold-change and FDR cutoffs in all the various com-parisons were assigned to one of the expression patterns. Thus, for example, the EL pattern of expression contains genes that are upregulated in category E and also in at least one subcategory of L relative to M. The precision TABLE 2
Description of the 28 expression patterns identified in the data set
Pattern description
Pattern
abbreviation Analysis Genes upregulated in E relative to all subcategories of M and L E EML Genes upregulated in at least one subcategory of M relative to E and relative to
at least one subcategory of L
M EML
Genes upregulated in at least one subcategory of L relative to E and relative to at least one subcategory of M
L EML
Genes upregulated in E and in at least one subcategory of M relative to at least one subcategory of L
EM EML
Genes upregulated in E and in at least one subcategory of L relative to at least one subcategory of M
EL EML
Genes upregulated in at least one subcategory of M and in at least one subcategory of L relative to E
ML EML
Genes upregulated in all cochlear relative to all vestibular samples Cocha Middle
Genes upregulated in all vestibular relative to all cochlea samples Va Middle
Genes upregulated in E10.5 and E11 relative to E11.5 and E12 Yng-Mb Middle
Genes upregulated in E11.5 and E12 relative to E10.5 and E11 Old-Mb Middle
Genes upregulated in E10.5 relative to all other stages in category M E10.5-Upb Middle
Genes downregulated in E10.5 relative to all other stages in category M E10.5-Downb Middle
Genes upregulated in E11 relative to all other stages in category M E11-Upb Middle
Genes downregulated in E11 relative to all other stages in category M E11-Downb Middle
Genes whose expression changed simultaneously on the basis of tissue type and developmental stage
Both-M Middle
Genes upregulated in all cochlear relative to all utricular and saccular samples Ca Late
Genes upregulated in all utricular relative to all cochlea and saccular samples Ua Late
Genes upregulated in all saccular relative to all cochlear and utricular samples Sa Late
Genes upregulated in all cochlear and saccular samples relative to all utricular samples CSa Late
Genes upregulated in all cochlear and utricular samples relative to all saccular samples CUa Late
Genes upregulated in all utricular and saccular samples relative to all cochlear samples USa Late
Genes upregulated from E12.5 to E13.5 relative to E14 to E15 Yng-Lb Late
Genes upregulated from E14 to E15 relative to E12.5 to E13.5 Old-Lb Late
Genes upregulated in E14 relative to all other stages in category L E14-Upb Late
Genes downregulated in E14 relative to all other stages in category L E14-Downb Late
Genes whose expression changed simultaneously on the basis of tissue type and developmental stage
Both-L Late
Genes upregulated in IE relative to NIE by twofold or more IE-Up IEvs. NIE Genes downregulated in IE relative to IE by twofold or more IE-Down IEvs. NIE The 28 patterns of expression obtained from four types of analyses are described and the abbreviation for each is listed. EML, early–middle–late; IE, inner ear; NIE, noninner ear.
aPatterns based only on tissue type.
with which this analysis allowed us to group expression patterns is illustrated in Figure 3. This figure shows heat maps of genes that exhibit a twofold change or more in gene expression between various time point and tissue comparisons (red, upregulation; blue, downregula-tion). For example, Figure 3A shows the expression levels of genes that fall into the E, M, and L categories of gene expression. It is clear that the 315 genes in the E
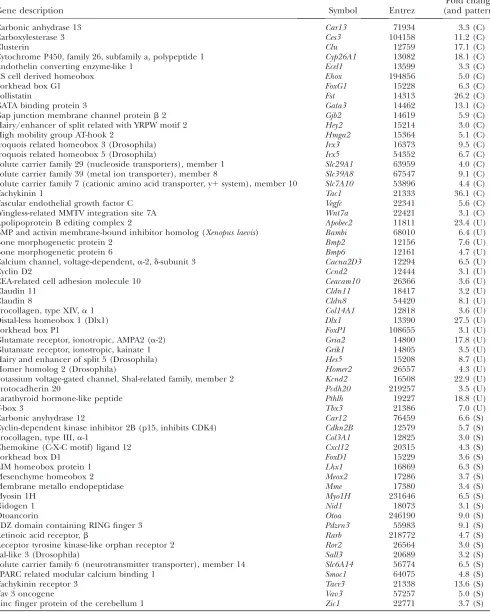
class are much more highly expressed in the E9 through E10 stages than at other stages and that the 95 middle stage genes are more highly expressed within the E10.5 through E12 stages than at other stages. These types of clear-cut differences can also be seen in Figure 3B where gene expression in later stages was broken down into tissue-specific classes. Thus, a set of 60 genes are clearly upregulated in cochlea, whereas 115 genes are more highly expressed in the utricle relative to the cochlea and saccule at E12.5–E15. The heat maps shown in Figure 3 (and additional ones that illustrate other comparative analyses) are available at higher resolution as supplemen-tal Figure 3 (http://www.genetics.org/supplemensupplemen-tal/). Table 4 lists examples of genes that exhibit large fold changes (threefold or more) in expression in only the cochleae (C), utricles (U), and saccules (S) shown in Figure 3B. Note that in the interests of space this is a partial listing. The complete list of these genes is presented in supplemental Table 4. Taken together, these sets of differentially expressed genes in various subgroupings provide discernible (and clear-cut) gene expression signatures for tissue type and/or time points within mouse IE development. For example, among the genes that appear to specify the cochlear signature are Tachykinin1, Clusterin, Gata3, Irx3, Irx5, FoxG1, Wnt7a, andHey2(among others). Among the utricle signature
genes are Dlx1, Bmp2, Tbx3, Bmp6, Hes5, and FoxP1.
Examples of saccule signature genes are Tachykinin
receptor-3, Lhx1, Vav3, Zic1, Rarb, and FoxD1. Some of the genes listed in Table 4 have been previously studied in specific areas of the IE (e.g.,Gata3), but these lists provide many more additional candidates and clues to unraveling the developmental programming of each of these IE organs.
The M and L categories (see Table 1) include sub-structures of the IE, such as the vestibular organ or cochlea. Therefore, these stages were separately ana-lyzed by employing a two-factor analysis of variance test (ANOVA) to identify genes whose expression changed on the basis of developmental stage only, tissue type only, or on the basis of both developmental stage and tissue type. Only genes that met a P-value cutoff of #0.005 were considered for further analysis. An addi-tional filter was then implemented using SAM to identify
genes that changed by $1.5-fold with an estimated
FDR of#0.5%.
For the middle (M) analysis only two patterns of tissue-specific differential expression were possible—genes high in the cochlea and those high in the vestibular organ (Table 2 and supplemental Figure 3C). Six pat-terns of gene expression were identified on the basis of developmental stage: genes high in E10.5 and E11 (‘‘young’’ stages or Yng-M); those high in E11.5 and E12 (‘‘old’’ stages or Old-M); genes up- or downregulated at E10.5 only (E10.5-Up and E10.5-Down, respectively); and genes up- or downregulated at E11 only (E11-Up and E11-Down, respectively).
TABLE 3
Number of genes within each of the 28 patterns of expression
No. of genes differentially expressed Pattern By$1.5-fold By$2-fold
E 436 315
M 177 95
L 937 657
EM 1799 1328
EL 1033 633
ML 841 634
Coch 59 34
V 824 225
Yng-M 195 75
Old-M 218 82
E10.5-Up 71 33
E10.5-Down 202 80
E11-UP 57 17
E11-Down 182 91
Both-M — 420
C 106 60
U 188 115
S 241 109
CS 43 31
CU 215 65
US 211 97
Yng-L 142 34
Old-L 188 84
E14-Up 171 43
E14-Down 499 151
Both-L — 720
IE-Up — 1410a
— — 384b
IE-Down — 226a
— — 66b
The number of genes that change by$1.5-fold or$2-fold (with an estimated FDR of at most 0.5%) are shown for each type of pattern according to the abbreviations in Table 2. In EML analysis, the lowest boundary of fold changes was 1.5-fold after taking error into account. In M and L analyses, the number of genes indicated are those that were able to meet the two-way ANOVA P-value cutoff of 0.005 (see text and supplemental Materials and Methods for details). These had a lowest boundary of fold changes of 1.4-fold after taking error into account. Genes within expression patterns Both-M and Both-L do not have an expression ratio associated with them.
a
Genes that were either up- or downregulated in at least one-tenth of all IE samples relative to at least one NIE sample.
b
In the late (L) analysis six possible tissue-specific pat-terns were identified; genes high in either one of the three dissected tissues or pairwise combinations of the three. Four patterns were identified on the basis of developmental stage; genes upregulated from E12.5 to E13.5 (young stages or Yng-L), those high from E14 to E15 (old stages or Old-L), and those up- or downregulated only at E14 (E14-Up and E14-Down, respectively). Both the M and the L analysis included comparisons to search for genes that changed in expression according to both tissue type and developmental stage. Genes within these groupings did not have a specific fold change associated
TABLE 4
Examples of signature genes
Gene description Symbol Entrez
Fold change (and pattern)
Carbonic anhydrase 13 Car13 71934 3.3 (C)
Carboxylesterase 3 Ces3 104158 11.2 (C)
Clusterin Clu 12759 17.1 (C)
Cytochrome P450, family 26, subfamily a, polypeptide 1 Cyp26A1 13082 18.1 (C) Endothelin converting enzyme-like 1 Ecel1 13599 3.3 (C)
ES cell derived homeobox Ehox 194856 5.0 (C)
Forkhead box G1 FoxG1 15228 6.3 (C)
Follistatin Fst 14313 26.2 (C)
GATA binding protein 3 Gata3 14462 13.1 (C)
Gap junction membrane channel proteinb2 Gjb2 14619 5.9 (C) Hairy/enhancer of split related with YRPW motif 2 Hey2 15214 3.0 (C) High mobility group AT-hook 2 Hmga2 15364 5.1 (C) Iroquois related homeobox 3 (Drosophila) Irx3 16373 9.5 (C) Iroquois related homeobox 5 (Drosophila) Irx5 54352 6.7 (C) Solute carrier family 29 (nucleoside transporters), member 1 Slc29A1 63959 4.0 (C) Solute carrier family 39 (metal ion transporter), member 8 Slc39A8 67547 9.1 (C) Solute carrier family 7 (cationic amino acid transporter, y1system), member 10 Slc7A10 53896 4.4 (C)
Tachykinin 1 Tac1 21333 36.1 (C)
Vascular endothelial growth factor C Vegfc 22341 5.6 (C) Wingless-related MMTV integration site 7A Wnt7a 22421 3.1 (C) Apolipoprotein B editing complex 2 Apobec2 11811 23.4 (U) BMP and activin membrane-bound inhibitor homolog (Xenopus laevis) Bambi 68010 6.4 (U)
Bone morphogenetic protein 2 Bmp2 12156 7.6 (U)
Bone morphogenetic protein 6 Bmp6 12161 4.7 (U)
Calcium channel, voltage-dependent,a-2,d-subunit 3 Cacna2D3 12294 6.5 (U)
Cyclin D2 Ccnd2 12444 3.1 (U)
CEA-related cell adhesion molecule 10 Ceacam10 26366 3.6 (U)
Claudin 11 Cldn11 18417 3.2 (U)
Claudin 8 Cldn8 54420 8.1 (U)
Procollagen, type XIV,a1 Col14A1 12818 3.6 (U) Distal-less homeobox 1 (Dlx1) Dlx1 13390 27.5 (U)
Forkhead box P1 FoxP1 108655 3.1 (U)
Glutamate receptor, ionotropic, AMPA2 (a-2) Gria2 14800 17.8 (U) Glutamate receptor, ionotropic, kainate 1 Grik1 14805 3.5 (U) Hairy and enhancer of split 5 (Drosophila) Hes5 15208 8.7 (U) Homer homolog 2 (Drosophila) Homer2 26557 4.3 (U) Potassium voltage-gated channel, Shal-related family, member 2 Kcnd2 16508 22.9 (U)
Protocadherin 20 Pcdh20 219257 3.5 (U)
Parathyroid hormone-like peptide Pthlh 19227 18.8 (U)
T-box 3 Tbx3 21386 7.0 (U)
Carbonic anyhydrase 12 Car12 76459 6.6 (S)
Cyclin-dependent kinase inhibitor 2B (p15, inhibits CDK4) Cdkn2B 12579 5.7 (S) Procollagen, type III,a-1 Col3A1 12825 3.0 (S) Chemokine (C-X-C motif) ligand 12 Cxcl12 20315 4.3 (S)
Forkhead box D1 FoxD1 15229 3.6 (S)
LIM homeobox protein 1 Lhx1 16869 6.3 (S)
Mesenchyme homeobox 2 Meox2 17286 3.7 (S)
Membrane metallo endopeptidase Mme 17380 3.4 (S)
Myosin 1H Myo1H 231646 6.5 (S)
Nidogen 1 Nid1 18073 3.1 (S)
Otoancorin Otoa 246190 9.0 (S)
PDZ domain containing RING finger 3 Pdzrn3 55983 9.1 (S)
Retinoic acid receptor,b Rarb 218772 4.7 (S)
Receptor tyrosine kinase-like orphan receptor 2 Ror2 26564 3.0 (S)
Sal-like 3 (Drosophila) Sall3 20689 3.2 (S)
Solute carrier family 6 (neurotransmitter transporter), member 14 Slc6A14 56774 6.5 (S) SPARC related modular calcium binding 1 Smoc1 64075 4.8 (S)
Tachykinin receptor 3 Tacr3 21338 13.6 (S)
Vav 3 oncogene Vav3 57257 5.0 (S)
Zinc finger protein of the cerebellum 1 Zic1 22771 3.7 (S)
identified within the M analysis or within the L analysis. Thus, some genes recur when lists are compared between the three analyses.
The final step in this differential expression analysis was to compare all IE samples to their corresponding NIE control samples. That is, E9 IE was compared with E9 NIE; each IE sample from E9.5 to E10.5 was com-pared with NIE from the same stage; and each IE sample from E11 to E15 was compared with NIE from those stages. We identified genes that were either up- or downregulated in at least one IE sample relative to at least one NIE sample by twofold or more with an FDR of #0.5%. This resulted in the identification of 1410 genes that were upregulated and 226 genes that were down-regulated in three or more (at least 10%) of all IE samples. Complete gene lists for the heat maps shown in supplemental Figure 3, for the SOMs in supplemental Figure 4, and for the IEvs. NIE comparisons are shown in supplemental Table 4.
GO classifications of differentially expressed genes:
To identify the functional categories represented by the various differentially expressed genes, we used GO anno-tations to classify these genes on the basis of molecular function (MF) ontology. Supplemental Table 5 (http:// www.genetics.org/supplemental/) lists the significant MF classes and genes (along with their fold changes) that are unique to each type of expression pattern.
In the EML analysis (described above and in Tables 1 and 2), the highest number of differentially expressed genes was found in the EM expression pattern and, consequently, many significant MF terms are represented by these genes. This is not unexpected. During the early and middle developmental stages, when the vast major-ity of cells have not acquired their final differentiated states, it is likely that many different developmental routes will be elaborated with a consequently large number of gene expression changes. Some prevalent MF classes in this pattern were those involved in electron and proton transport, as well as helicase and DNA/histone binding activities. Genes high in the late stages included many coding for structural molecules unique to the IE ½e.g., tectorins and collagens; TectA, TectB,Col18a1, andCol7a1being upregulated in many IE samples relative to NIE ones (supplemental Table 4), as well as those that bind certain growth factors and steroid hormones such asNr1d2,Rarb,Rorc, andVdr. Among the genes represented in the middle and late (ML) expres-sion pattern were those encoding calcium and chloride ion channels and components of TGF-bsignaling.
Within the M category, the vestibular organ, as expected, expressed many calcium ion binding proteins and various structural molecules. Numerous genes coding for zinc ion binding proteins were downregu-lated at E10.5 in both the cochlea and the vestibular organ (E10.5-Down) but these were dramatically upre-gulated after E10.5. These genes includePcgf4,Rnf14, Rnf38,Zfp294,Pias1, andPias2, among others.
Interest-ingly, a similar burst of transcription from many zinc finger protein-coding genes has also been shown to occur as adult chicken auditory sensory epithelium undergoes regeneration following neomycin damage (Hawkinset al. 2007). It is tempting to speculate that this burst of avian zinc finger gene expression during hair cell regeneration may be a recapitulation of what normally occurs during development of the sensory epithelium.
In the L category, genes upregulated in the utricle included endopeptidase inhibitors, glutamate recep-tors, and potassium channels. Glutamate receptors are known to be expressed in the hair cells of the vestibular organ (Hendricsonand Guth2002), as are potassium channels (Eatocket al. 2002). Genes upregulated in the saccule included those encoding numerous zinc ion binding proteins. Interestingly, at E14 in all three tissues the transcription of many ribosomal protein genes was dramatically downregulated suggesting a possible re-duction of protein synthesis throughout the IE at that stage. Certain transcriptional activators were also down-regulated at this stage, indicating a possible slowing of overall transcriptional activity as well. Additionally, the transcription of many genes involved in energy pro-duction also appeared to be downregulated at this stage across all three organs. The E14-Up set of genes did not fall into significant and well-defined MF classes in this GO analysis (however, see below for pathway analysis on these and other genes) nor did genes within the Coch, Old-M, E11-Up, and C patterns.
pathways are shown in supplemental Figure 5 (http:// www.genetics.org/supplemental/). Supplemental Table 6 lists all of the genes parsed into all of the detected pathways and patterns of gene expression. Figure 4 shows seven examples of these pathways to illustrate what this type of analysis can reveal and how it differs from gene ontology outputs. Each of the 28 expression patterns is shown across the x-axes, and the y-axis for each pathway shows the percentage of genes from the pathway that are differentially expressed in each of the 28 patterns. The total number of genes in the pathway is shown at the top of each pathway, as is the total number present on the chip used in this study. Thus, it can be
Components of estrogen receptor signaling have been previously described in the developing and adult IE (Stenberget al. 1999; Stenberget al. 2002; also reviewed in Hultcrantzet al. 2006), but this analysis provides a much higher level of detail for this pathway.
Figure 4, A, B, and D, shows components of the IGF-1, FGF, and Neurotrophin-Trk signaling pathways, respec-tively. All of these show quite broad representation through most of the 28 expression patterns. However, there are interesting and specific differences between patterns. For example, FGF signaling is enriched in both the
IE-Up (overexpressed in IEvs. non-IE) and the IE-Down
(overexpressed in NIE tissues). This apparently contra-dictory observation reflects the expression of different components of FGF signaling in the two tissue types. For example,Fgf9is upregulated in the IE tissues whereas Fgf13 andFgfr3(among others) appear to be upregu-lated in the non-IE tissues.
The Notch signaling pathway (shown in Figure 4E) appears to be relatively enriched in the vestibular organs and in later stages of development. Specifically, genes such asNotch1,Notch2, andNotch4appear to be higher in the vestibular (V) pattern of expression than in all of the cochlear samples.Notch1is also one of the genes that is detectably upregulated in the later stages of develop-ment relative to the middle or early stages.
One of the most striking observations from the oxidative phosphorylation pathway shown in Figure 4F is that this pathway is over-represented by those genes that appear to be downregulated at E14 (E14-Down). This downregulation of housekeeping and metabolic genes at the E14 stage (already noted above) does not inversely correlate with an induction of specific, dis-cernible IPA pathways in the E14-Up category. As noted above, the GO classifications for this set of genes are also not significantly enriched. Nevertheless, the E14-Up set of genes contains some interesting single genes that do show upregulation as proliferation apparently slows down. These genes includeIntersectin1(which is involved in endocytic membrane traffic) (Evergrenet al. 2007), Fgfr1(a key component of growth and differentiation in many systems, including the developing auditory sen-sory epithelium) (Pirvolaet al. 2002), and Paxip1(a
member of the Pax gene family that is involved in
maintaining genome stability) (Choet al. 2003). Wnt signaling is known to play a major role in IE development (Dabdoubet al. 2003; Stevenset al. 2003; Takebayashiet al. 2004; Kimet al. 2004; Ohyamaet al. 2006). Numerous members of this (canonical) pathway were observed to have different expression patterns (Figure 4G) in the samples profiled. For instance, con-sistent with its role in cellular proliferation (Kimet al. 2004; Takebayashi et al. 2004), b-catenin (Ctnnb1) expression peaked in pattern EM (supplemental Table 4), at a time when the vast majority of cells in the IE are still undifferentiated and in a proliferative state. Many members of the frizzled and wnt family of genes also
exhibited interesting patterns of expression. Specifi-cally, within category L, Wnt7a appears to be upregu-lated by 3.1-fold in the cochlea relative to the saccule and the utricle, whereasWnt4is upregulated by 8.6-fold in both the cochlea and the saccule relative to the utricle. Within category M (before the saccule is mor-phologically distinct),Wnt4expression changes on the basis of both tissue type and developmental stage, but it does so only in the cochlea. Hence, it appears thatWnt4 expression dramatically increases in the cochlea from E10.5 to E12 and then plateaus. Within the sacculeWnt4 expression increases as development progresses, but it does so linearly and does not show the plateau of expres-sion observed in the developing cochlea. On average, Wnt4expression was found to be 8.6-fold higher in all cochlear and saccular samples from E12.5 to E15 relative to the utricle samples. However, by the end of
this time period (E15), Wnt4 expression was 6-fold
higher in the cochlea and 17.4-fold higher in the saccule, compared to the utricle at the same stage. An additional wnt gene with an intriguing expression pattern is Wnt5a. Within category M, its expression is moderate and, on average, almost twice as high in the vestibular organ compared to the cochlea (supplemen-tal Table 4). However, within category LWnt5a expres-sion increases sharply in the cochlea (but not in the utricle and the saccule) and peaks at E15 in this organ (supplemental Table 4 and centroids 5 and 64 in supplemental Figure 4B).
Genes from several immune-related pathways (such as natural killer cells, T- and B-cell signaling, and in-terleukin pathways) were also observed to significantly alter their expression in the profiled samples. These are listed in supplemental Table 6 and shown diagrammat-ically in supplemental Figure 5. In all three analyses, most of these pathways were found to be statistically significant in expression patterns on the basis of de-velopmental stage, suggesting common roles in various organs of the IE. It is known that certain immune cells are present in the mature IE and are recruited to sites of hair cell damage in both the cochlea and vestibular
organs of mammals and birds (Fredelius and Rask
-Andersen 1990; Warchol 1997, 1999; Bhave et al.
1998; Warchol and Kaplan 1999). Studies also
genes, known PCD participants, were observed to sig-nificantly alter in their expression. For instance,Bcl2l1 and caspases-3, -6, and -8 followed the expression pat-tern EM, whereasCasp7andBcl2fell into patterns ML and L, respectively. Within category L, the pro-apoptotic
gene Bidwas upregulated in the cochlea and saccule
relative to the utricle, whileCasp9was upregulated in the utricle and saccule relative to the cochlea (sup-plemental Table 4).Bcl2, on the other hand, increased sharply in the cochlea from E12.5 and peaked at E15 in this organ, but not in the saccule and utricle (supplemental Table 4 and centroid 65 in supplemental Figure 4B).
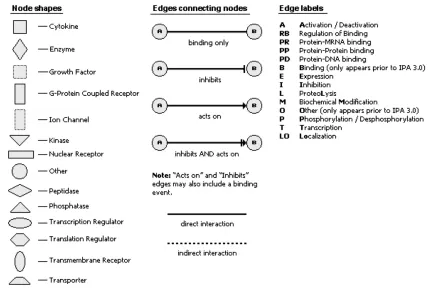
Evaluating relationships among genes through net-work building:The analysis illustrated in Figure 4 and in supplemental Figure 5 identifies a series of seed net-works in which differentially expressed genes resided. However, these networks include only genes that are detectably differentially expressed. They do not take into account genes that are not differentially expressed, but are in fact present across various time points and tissues and are part of the network. We were interested in determining whether these ‘‘missing’’ genes were actually present in a given tissue or stage, but were not scored as being differentially expressed across the sample set. Therefore, we queried all genes within our seed networks for whether they were scored as ‘‘present’’ in IE samples comprising a particular expres-sion pattern (e.g., early genes). We took all those that were present, combined them with the differentially expressed genes and re-uploaded this set into IPA to determine if they further populated the initial pathway or others. In this way we derived the types of network outputs shown in Figure 5. This second form of analysis consists of a series of interaction diagrams in which networks of direct and indirect gene interactions can be postulated from the IPKB. In many cases these are large in scale and should provide many new leads into the exact framework of interactions that occur during the complex process of IE development and morphogenesis. The network in Figure 5A was generated by merging two of the high-scoring networks built by IPA using genes upregulated in category L (shown as varying shades of red, proportional to their level of expression) by at least 1.5-fold relative to categories E and M. Genes shown in green are those that are known to interact with upregulated genes, but which themselves were not upregulated in this category. However, they were pre-sent within this category. Thus, one can see that seven components ofWntsignaling are enriched in these late stages, as are interacting components of Notch
signal-ing, components of the Ap1 pathway, and various
components that interact with the hair cell differentia-tion markerAtoh1. A total of 68 genes are thus drawn into this network.
Figure 5B shows an example of one of several high-scoring networks built around genes upregulated in the
cochlea (again shown in shades of red) by at least 1.5-fold within category L relative to both the utricle and the saccule, while those in green are known to interact with the former and were found to be present in the late cochlear samples. Genes from three pathways (TGF-b, Vegf, and NF-kB) known for their roles in IE develop-ment are indicated on this figure. In addition to these, it is interesting to note that additional upregulated genes, such asIrx5andClu, are also found within this network (black arrows). It appears likely that these genes (which have not previously been investigated in the IE and were validated byin situs, see below) function through one or more of the three known pathways within the cochlea at later stages in IE development.
The network in Figure 5C was built similarly to those in 5A and 5B but using genes upregulated in the saccule by at least 1.5-fold (shades of red) within category L relative to the cochlea and the utricle. In this case, in addition to genes from well known IE pathways (e.g., Wntand the cell cycle), there are also genes (e.g.,Clock andPer2) from the circadian rhythm pathway. There is evidence that appears to link the vestibular system to homeostatic and circadian regulation (Fuller et al. 2002), but this pathway has not been characterized in the IE. It is interesting to note that this pathway has also been observed to be differentially expressed in regen-erating avian sensory epithelia (Hawkinset al. 2007).
RNA in situ hybridization confirms differential expression:To validate our array data and also to iden-tify spatial patterns of expression, we performed whole mount RNAin situhybridizations on microdissected IE structures. Genes for this analysis were selected from the array data on the basis of their apparent clear-cut, tissue-specific patterns of gene expression and the fact that they had never previously been studied in the IE. On the basis of these criteria we selected hairy and enhancer of split related with YRPW motif 2 (Hey2, a gene that appeared from our array data to be cochlea-specific at E14.5), iroquois homeobox protein 5 (Irx5, another gene that appeared to be cochlea-specific), forkhead box protein1 (FoxP1, which showed a vestibular pattern of expression), and Clusterin (Clu, which showed a cochlear-specific pattern of expression).
compared to the cochlea and the saccule. This latter observation is consistent with previous RNAin situdata forHes5(Shailamet al. 1999), which demonstrated that it is expressed only in the cristae of the three semi-circular canals during these stages of development.
the cochlea until E15 and was absent in all samples of the saccule, again consistent with previous reports (Shailamet al. 1999; Zineet al. 2001).
Transcripts for Irx5 are localized in the cochlea
(Figure 6B), as suggested by the array data, and are pre-sent in a gradient that decreases from the base to the apex. The saccule also appears to expressIrx5,although in a diffuse pattern. Iroquois genes frequently have overlapping domains of expression during develop-ment, and appear to play redundant roles (Bosseet al.
1997; Bruneau et al. 2001; Houweling et al. 2001;
Lebelet al. 2003). Interestingly, our array data indicate that three additional iroquois genes (Irx1, Irx3, and Irx6) are also upregulated in the cochlea by 2.2-, 9.5-, and 1.8-fold, respectively, relative to the utricle and saccule.Irx5is involved in cone bipolar cell
differenti-ation in the mouse retina (Chenget al. 2005) and also in maintaining the ventricular repolarization gradient in the heart by repressing the expression of Kcnd2, a potassium channel gene (Costantiniet al.2005). On the basis of these observations in the heart, it is worth
noting that Kcnd2 expression is upregulated in the
utricle by 22.9-fold relative to the cochlea and saccule (over the same time period asIrx5) suggesting thatIrx5 might play a similar role in the IE.
FoxP1expression was found to be vestibular specific, as reported by the array data, and was localized to the utricle and the ampullae of the three semicircular canals (Figure 6C). This gene is known for its role in
cardiac development (Wang et al. 2004) and also in
colony stimulating factor receptor (Csf1r) and represses its expression (Shiet al. 2004). The expression ofFoxP1 itself in monocytes is initiated as a result of clustering of
a membrane-bound integrinItgam. Furthermore, lack
ofFoxP1also results in defective B-cell development and
a reduction in the levels of Rag1 and Rag2 proteins
that are involved in V(D)J recombination in these cells because FoxP1 directly controls their expression (Hu et al. 2006). There is a resident population of immune cells in the IE (Warchol1997; Bhaveet al. 1998), and it is possible thatFoxP1is involved in their differentiation. However, the fact that its expression is localized in the utricle and the three ampullae suggests a more specific role for this gene in these particular sensory structures of the IE. Another forkhead gene detected in our array data,FoxG1, was found to be overexpressed in the late cochlea by 6.3-fold relative to the utricle and saccule, even though it was still present in the latter two organs. This is consistent with previous studies in which mice lacking this gene were found to have several IE abnormalities including a shortened cochlea with
sev-eral rows of hair and support cells, defective innervation in both the cochlea and the vestibule, and absence of lateral crista (Pauleyet al. 2006).
Clusterin (Clu) also known asApoJ, has been shown to have numerous roles, which include influencing the deposition ofb-amyloid in the brain (Demattoset al. 2004), protecting heart tissue from postinflammatory tissue destruction (Mclaughlinet al. 2000), acting as a
tumor suppressor by inhibiting the NF-kB pathway
for four additional genes, all of which support the expression patterns observed with microarrays: Kcnd2
½supplemental Figure 16 (http://www.genetics.org/
supplemental/), Ttyh1 (supplemental Figure 17),
Slc2a3(supplemental Figures 18–20), andZbtb16 (sup-plemental Figure 21). A semiquantitative RT–PCR method was also employed as another independent method of validating microarray observations on eight additional genes:Irf6,Rxrg,Slc2a3,Lin28,Ttyh1,Zfp503, Fst, andPthlh (note that for two of these genes,Slc2a3 andTtyh1, RNAin situswere also carried out). Supple-mental Figure 22 and suppleSupple-mental Table 9 include this PCR data. The microarray and PCR data show excellent agreement in the observed patterns of gene expression. These independent methods of assessing gene expression not only serve to validate our array data, but also illustrate how this data set can readily pro-vide numerous new, interesting, spatially and tempo-rally regulated genes to further investigate during IE development.
Candidate genes for human deafness loci:Currently,
.110 human genomic intervals have been identified
that harbor nonsyndromic deafness loci (the Hereditary Hearing Loss home page, http://webh01.ua.ac.be/ hhh/). In many cases the pedigrees from which these locations were identified are quite small, the genomic intervals are large and contain many candidate genes. Consequently, only 40 of these loci have been
resolving exactly which mutations cause these various inherited forms of deafness.
DISCUSSION
In this article we describe the most detailed gene expression profiles and pathway information to date over the course of mouse IE organogenesis. Particular care was taken to derive high quality biological samples and to derive statistically robust expression profiles from a strain of mice (CBA/J) that does not exhibit a significant age-related hearing loss (Hunterand Willott 1987). We collected samples at half-day intervals starting at one of the earliest stages of IE development (the E9 otic cup) and separately dissected substructures up to E15, when the specialized sensory epithelia in all six sensory organs have already begun to differentiate. By profiling in duplicate 29 IE and three NIE tissues (i.e., a total of 64 individual arrays) we have obtained a first glimpse into the ‘‘tool box’’ of gene expression changes that specify the development of the complex cell types and struc-tures of the IE. Our data are freely available through the National Center for Biotechnology Information’s GEO database, and we have presented extensive analyses (including RNAin situdata) that validate their quality.
In addition to describing the derivation and quality of the data, we have attempted to analyze this large data set
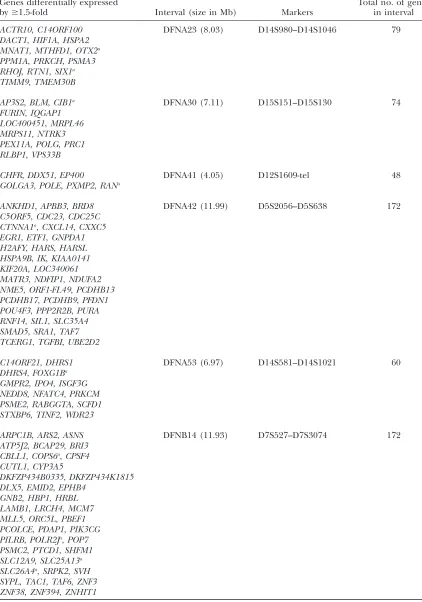
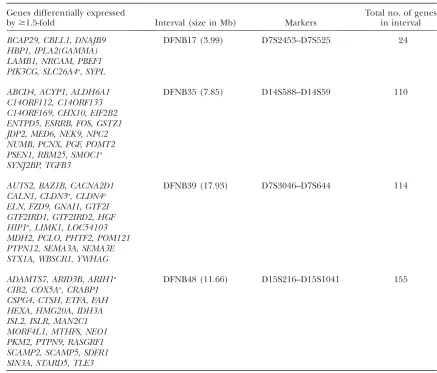
TABLE 5
Examples of 10 nonsyndromic human deafness intervals for which no causative gene has been identified to date, and candidate genes in these intervals identified in the current study
Genes differentially expressed
by$1.5-fold Interval (size in Mb) Markers
Total no. of genes in interval
ACTR10,C14ORF100 DFNA23 (8.03) D14S980–D14S1046 79
DACT1,HIF1A,HSPA2 MNAT1,MTHFD1,OTX2a
PPM1A,PRKCH,PSMA3 RHOJ,RTN1,SIX1a
TIMM9,TMEM30B
AP3S2,BLM,CIB1a DFNA30 (7.11) D15S151–D15S130 74
FURIN,IQGAP1 LOC400451,MRPL46 MRPS11,NTRK3 PEX11A,POLG,PRC1 RLBP1,VPS33B
CHFR,DDX51,EP400 DFNA41 (4.05) D12S1609-tel 48
GOLGA3,POLE,PXMP2,RANa
ANKHD1,APBB3,BRD8 DFNA42 (11.99) D5S2056–D5S638 172
C5ORF5,CDC23,CDC25C CTNNA1a,CXCL14,CXXC5
EGR1,ETF1,GNPDA1 H2AFY,HARS,HARSL HSPA9B,IK,KIAA0141 KIF20A,LOC340061 MATR3,NDFIP1,NDUFA2 NME5,ORF1-FL49,PCDHB13 PCDHB17,PCDHB9,PFDN1 POU4F3,PPP2R2B,PURA RNF14,SIL1,SLC35A4 SMAD5,SRA1,TAF7 TCERG1,TGFBI,UBE2D2
C14ORF21,DHRS1 DFNA53 (6.97) D14S581–D14S1021 60
DHRS4,FOXG1Ba
GMPR2,IPO4,ISGF3G NEDD8,NFATC4,PRKCM PSME2,RABGGTA,SCFD1 STXBP6,TINF2,WDR23
ARPC1B,ARS2,ASNS DFNB14 (11.93) D7S527–D7S3074 172
ATP5J2,BCAP29,BRI3 CBLL1,COPS6a,CPSF4
CUTL1,CYP3A5
DKFZP434B0335,DKFZP434K1815 DLX5,EMID2,EPHB4
GNB2,HBP1,HRBL LAMB1,LRCH4,MCM7 MLL5,ORC5L,PBEF1 PCOLCE,PDAP1,PIK3CG PILRB,POLR2Ja,POP7
PSMC2,PTCD1,SHFM1 SLC12A9,SLC25A13a
SLC26A4a,SRPK2,SVH
SYPL,TAC1,TAF6,ZNF3 ZNF38,ZNF394,ZNHIT1
multiple components ofWntsignaling½which is known to play a role during IE development (Dabdoubet al. 2003; Stevenset al. 2003; Kimet al. 2004; Takebayashi et al. 2004; Ohyamaet al. 2006)occur in the majority of the 28 expression patterns. However, different compo-nents of this pathway are expressed at particular stages of development. For example, four genes from theWnt pathway are upregulated only in early stages and eleven are upregulated only in late stages of IE development (supplemental Table 6). An additional example of this differential use of specific components is provided by the G1/S-phase checkpoint pathway of the cell cycle. At first glance, the cyclin-dependent kinase inhibitor genes Cdkn1B (p27Kip1), Cdkn2D (p19Ink4d), and Cdkn2B (p15Ink4b) are all upregulated in the late pattern of gene expression. This is to be expected, especially given that the first two are known to be expressed during this late time period and maintain the postmitotic state of
differentiated cochlear hair cells (Chenand Segil1999; Chenet al. 2003; Leeet al. 2006). However, according to our data set the actual expression patterns of these genes within the three tissues during late development (i.e., in the cochlea, saccule, and utricle) are not identical. Expression ofCdkn1Bdramatically increases in the cochlea (but not in the utricle or saccule) at E12.5 and peaks at E15. This expression pattern is consistent with previous immunostaining studies of the cochlea during this time period (Leeet al. 2006). On the other hand, Cdkn2D expression increases almost linearly in the saccule from E12.5 to E15. By E15, expression is 4.6 times higher in the saccule and 2.6 times higher in the utricle relative to the E15 cochlea. Cdkn2Bexpression also appears to vary by tissue during this time frame; it is highly expressed in the saccule compared to the cochlea and utricle. These specific observations are possibly due to differences in the control of cell cycle exit and the TABLE 5
(Continued)
Genes differentially expressed
by$1.5-fold Interval (size in Mb) Markers
Total no. of genes in interval
BCAP29,CBLL1,DNAJB9 DFNB17 (3.99) D7S2453–D7S525 24
HBP1,IPLA2(GAMMA) LAMB1,NRCAM,PBEF1 PIK3CG,SLC26A4a,SYPL
ABCD4,ACYP1,ALDH6A1 DFNB35 (7.85) D14S588–D14S59 110
C14ORF112,C14ORF133 C14ORF169,CHX10,EIF2B2 ENTPD5,ESRRB,FOS,GSTZ1 JDP2,MED6,NEK9,NPC2 NUMB,PCNX,PGF,POMT2 PSEN1,RBM25,SMOC1a
SYNJ2BP,TGFB3
AUTS2,BAZ1B,CACNA2D1 DFNB39 (17.93) D7S3046–D7S644 114
CALN1,CLDN3a,CLDN4a
ELN,FZD9,GNAI1,GTF2I GTF2IRD1,GTF2IRD2,HGF HIP1a,LIMK1,LOC54103
MDH2,PCLO,PHTF2,POM121 PTPN12,SEMA3A,SEMA3E STX1A,WBSCR1,YWHAG
ADAMTS7,ARID3B,ARIH1a DFNB48 (11.66) D15S216–D15S1041 155
CIB2,COX5Aa,CRABP1
CSPG4,CTSH,ETFA,FAH HEXA,HMG20A,IDH3A ISL2,ISLR,MAN2C1 MORF4L1,MTHFS,NEO1 PKM2,PTPN9,RASGRF1 SCAMP2,SCAMP5,SDFR1 SIN3A,STARD5,TLE3
The human nonsyndromic deafness intervals shown here contain mouse orthologs found in this study to be differentially expressed (listed in the first column). Refer to supplemental Table 8 for a listing of all 54 intervals.
subsequent maintenance of the quiescent state of hair and supporting cells in different organs of the IE. The general theme underlying all of these differences in gene expression is that different components of partic-ular pathways are employed in different places and at different times during IE development, and that these subtleties can be identified within our data.
Many of the pathways we have identified involve genes that are known to play key roles in IE development (e.g., Wnt, Notch, andFgfs). Our analysis not only has added many other genes that act within these pathways into our understanding of the process, but also has revealed several unexpected pathways and patterns. Examples of these are the circadian rhythm and estrogen receptor signaling pathways (among others). It is unclear what role these pathways might play in ear development. Ex-pression of CLOCK family genes is clearly not limited to regions of the nervous system that govern circadian rhythms. Cells in most peripheral tissues also contain endogenous oscillators on the basis of this same
ge-netic network (Oishi et al. 2003; Yamamoto et al.
2004; Tsinkalovskyet al. 2006). However, differential expression of this network is a novel observation in IE development. Additionally, while estrogen receptor expression has been previously observed in the adult mouse IE (Stenberget al. 1999; Stenberget al. 2002), our observation that multiple components of this sig-naling pathway are differentially expressed in the de-veloping IE is novel. It is interesting to note that in a separate study of gene expression in avian IE sensory epithelial regeneration we also observed changes in estrogen receptor signaling, including estrogen recep-tora. It is unclear what role this pathway is playing in either of these systems, but it is known from other sys-tems that activation of the pathway does not necessarily require estrogen as a ligand. Ligand-independent activation of ER can be achieved by ER phosphorylation mediated by various other signaling pathways and sig-naling molecules (Sommerand Fuqua2001).
One surprising pattern of gene expression we ob-served was the coordinate downregulation of numerous genes involved in protein synthesis,i.e., constituents of ribosomes (50 genes, see supplemental Table 5) and oxidative phosphorylation (30 genes, see supplemen-tal Tables 5 and 6) in all structures profiled at E14. This suggests that some form of overall regulatory control might underlie this coordinate change in transcripts that are so integral to cellular growth and energy metab-olism. These changes happen during a period at which many IE differentiation events are occurring, including the differentiation of sensory and nonsensory cells in the cochlea and vestibular organs. It is possible that the apparent downregulation of so many metabolic genes is in fact a reflection of the decreased proliferation and lowered energy requirements of these differentiating cells during this time period. The immediate increase in these transcripts beyond E14 may be the result of an
increase in the energy demands of specialized structures as they mature and become innervated.
Clearly, our data add a large number of interesting genes and pathways to the list of those involved in IE development. We have also identified gene expres-sion signatures for particular IE structures and/or stages of development. These clear-cut patterns of gene expres-sion provide diagnostic gene expresexpres-sion ‘‘bar codes’’ for IE development. They represent gene expression changes occurring in the sampled structure at that particular point in development and are thus a re-flection of all the regulatory interactions occurring in that time and place. As IE biologists proceed further with genomic approaches for the analysis of smaller structures and specific cell types within the IE, it is to be hoped that these larger signatures can eventually be deconstructed into a series of underlying gene expression patterns and specific interactions that will help to solve the genetic ‘‘wiring diagram’’ of this important organ.
The authors are grateful to Anne Bowcock for her critical reading of this manuscript. This work was supported by grant no. RO1DC5632 from the National Institute on Deafness and Other Communication Disorders (to M.L.).
LITERATURE CITED
Anagnostopoulos, A. V., 2002 A compendium of mouse
knock-outs with inner ear defects. Trends Genet.18:499.
Anniko, M., 1983 Cytodifferentiation of cochlear hair cells. Am.
J. Otolaryngol.4:375–388.
Avraham, K. B, 2003 Mouse models for deafness: lessons for the
hu-man inner ear and hearing loss. Ear Hear.24:332–341. Beisel, K. W., T. Shiraki, K. A. Morris, C. Pompeia, B. Kacharet al.,
2004 Identification of unique transcripts from a mouse full-length, subtracted inner ear cDNA library. Genomics83:1012–1023. Bhave, S. A., E. C. Oesterle and M. D. Coltrera, 1998
Mac-rophage and microglia-like cells in the avian inner ear. J. Comp. Neurol.398:241–256.
Bosse, A., A. Zulch, M-B. Becker, M. Torres, J. L. Gomez-Skarmeta et al., 1997 Identification of the vertebrate Iroquois homeobox gene family with overlapping expression during early develop-ment of the nervous system. Mech. Dev.69:169–181.
Brown, L. F., D. Dubi, L. Lavigne, B. Logan, H. F. Dvoraket al.,
1993 Macrophages and fibroblasts express embryonic fibronec-tins during wound healing. Am. J. Pathol.142:793–801. Bruneau, B. G., Z. Z. Bao, D. Fatkin, J. Xavier-Neto, D. G
eorgako-poulos et al., 2001 Cardiomyopathy in Irx4-deficient mice is
preceded by abnormal ventricular gene expression. Mol. Cell. Biol.21:1730–1736.
Camarero, G., C. Avendano, C. Fernandez-Moreno, A. Villar,
J. Contreras et al., 2001 Delayed inner ear maturation and
neuronal loss in postnatal Igf-1-deficient mice. J. Neurosci.19:
7630–7641.
Cantos, R., L. K. Cole, D. Acampora, A. Simeoneand D. K. Wu,
2000 Patterning of the mammalian cochlea. Proc. Natl. Acad. Sci. USA97:11707–11713.
Cecconi, F., K. A. Roth, O. Dolgov, E. Munarriz, K. Anokhinet al.,
2004 Apaf1-dependent programmed cell death is required for inner ear morphogenesis and growth. Development9:2125–2135. Chen, P., and N. Segil, 1999 p27Kip1 links cell proliferation to
mor-phogenesis in the developing organ of Corti. Development126:
1581–1590.
Chen, P., F. Zindy, C. Abdala, F. Liu, X. Liet al., 2003 Progressive
hearing loss in mice lacking the cyclin-dependent kinase inhibi-tor Ink4d. Nat. Cell Biol.5:422–426.
Chen, Z-Y., and D. P. Corey, 2002 An inner ear gene expression