SMALL SCALE SECTOR AND ITS ROLE IN THE ECONOMIC
DEVELOPMENT
Dr. Sandeep Bansal,
Associate Professor, I G N College, Ladwa, India.
ABSTRACT
Small scale sector is playing an important role in the economic development of the developing
countries. The reason being, these economies do not have adequate resources to built strong
industrial base by setting up large scale industries. Moreover, these economies lacks strong
human capital base and whatever manpower is available in the country can be better utilized in
small scale sector. This sector helps in generating gainful employment opportunities in these
economies. This sector contributes towards the export in the country. It helps in solving the
problem of balance of payment in the economy. Small scale sector maintains better rapport
between employer and employees thereby maintaining better industrial relations in the economy.
Keeping in view the significance of small scale sector, in this paper an attempt has been made to
analyze the problem of demand estimation faced by entrepreneurs. It becomes more imperative
in the era of free market economies, where tastes and preferences of the people changes rapidly.
Without strong knowledge of this area, small scale sector cannot move in the right direction.
Introduction
Small scale sector is playing an important role in the economic development of the developing
countries. The reason being, these economies do not have adequate resources to built strong
industrial base by setting up large scale industries. Moreover, these economies lacks strong
human capital base and whatever manpower is available in the country can be better utilized in
small scale sector. This sector helps in generating gainful employment opportunities in these
economies. This sector contributes towards the export in the country. It helps in solving the
between employer and employees thereby maintaining better industrial relations in the economy.
Keeping in view the significance of small scale sector, in this paper an attempt has been made to
analyze the problem of demand estimation faced by entrepreneurs. It becomes more imperative
in the era of free market economies, where tastes and preferences of the people changes rapidly.
Without strong knowledge of this area, small scale sector cannot move in the right direction.
The small scale sector has played a very important role in the socio-economic development of
the country during the past 50 years. It has significantly contributed to the overall growth in
terms of the Gross Domestic Product (GDP), employment generation and exports. The
performance of the small scale sector, therefore, has a direct impact on the growth of the overall
economy.
India witnessed a remarkable growth of small-size enterprises in India since independence. In
manufacturing sector Small and Medium Enterprises (SMEs) have a vital position because of
their creative role in employment generation and earnings and struggle against provincial
inequalities. SMEs policies have witnessed change due to New Economic Policy 1991, but even
in the early 1980’s SMEs policies were revised so to adapt with changing external environment.
Change in policies accentuated on significance of the globalization of commerce and mutual
dependence in many areas such as modernizing functions, teaching, promotion and commercial
course of action. To achieve equality in growth, SMEs have played an active role as they create
massive employment opportunities in the rural and semi-urban area and thus minimize
inequalities in different state and provinces. Small scale industries have served domestic as well
as international market at a realistic cost. Indian government to protect its newly developed
indigenous industries and to minimize import, Indian official embarked a route of trade and
industry reforms of correction in its economic policy but unremitting to shelter its small-size
enterprises. This new strategy focused on external accustom, contest and partnership with
internal and external organizations, the strategy outline confirms the latest noticeable variation in
spotlight. In view of these assumptions, we try to find out the contribution of small-size
enterprises in growth of Indian economy and to ascertain if their prospects are weakened or
History of Small Scale Industry (SSI)
During the period of 2001-02, the small scale sector was under the purview of two separate
ministries - Ministry of Small Scale Industries and Ministry of Agro and Rural Industries (SSI &
ARI). Both these ministries served as the nodal agencies for formulating policies, assisting states
and implementing the initiatives of the Centre to promote growth and development of small scale
units in an increasingly market-led economy. These two were bifurcated in 2001 from a
combined set up of Ministry of Small Scale Industries and Agro and Rural Industries (SSI &
ARI) established in 1999. Throughout this time frame, tiny and small units were constrained by
an upper limit on investment in plant & machinery. The tiny units were defined as those with an
investment of up to Rs. 25 lakhs and small units as ones with an investment of more than Rs. 25
lakhs but less than Rs. 1 crore. The inflow of foreign direct investment (FDI) was permitted only
up to a cap of 24%. Further, the ministry identified a separate list of medium enterprises
belonging to high-tech and export oriented industries, allowing them investment in plant &
machinery up to Rs. 5 crore for technological upgradation.
In 2006, the definition of SSI was elaborated with the passage of the Micro, Small and Medium
Enterprises Development (MSMED) Act. The Act aimed at providing an exclusive
comprehensive legislation for facilitating development and competitiveness of small scale
enterprises. Following the world-wide practice, this Act administered the concept of “enterprise”
constituting of manufacturing units as well as service entities to address the concerns of the
composite sector jointly. Moreover, it pioneered the task of bringing medium along with micro
and small segments under a single umbrella with the aim of integrating the three grades of
enterprises. For the units engaged in manufacturing activities, the investment limit in plant &
machinery for both small and medium units was revised upwards, keeping it same for the micro
sector. The upper limit for investment was extended from Rs. 1 crore to Rs. 5 crore for small and
from Rs. 5 crore to Rs. 10 crore for medium enterprises. Additionally, separate investment
ranges in equipment of Rs. 10 lakhs for micro, Rs. 2 crore for small, and Rs. 5 crore for medium
were defined for the service entities. The restricted cap of 24% on FDI was also abandoned,
The President under Notification 9th May 2007 has amended the Government of India
(Allocation of business) Rules 1961, Pursuant to this amended Ministry of Agro and rural
Industries (Krishi Evam Gramin Udyog Mantralay) and ministry of SSI (Laghu Udoyag
Mantralay) have been merged into a single Ministry, namely, Ministry of Micro Small &
Medium Enterprises (Suksham Laghu Aur Medium Udyam Mantralay)
MSMEs and Employment
Table: 1.1 shows that the performance of small scale units (MSMEs) in terms of employment
has been increased during the period of 1990-91 to 1999-2000. But in the year 2000-01, there
was a inclined increase of 26.19 percent and suddenly, it has an enormous decrease of 13.84
percent during the 2001-02. After that, it has increased consistently with around 4 percent
during the subsequent four years. Moreover, in the year 2006-07, the data of Micro, Small and
Medium units has been included in the small scale units and shows a steep inclined growth rate
of 101.62 percent. Finally no doubt compiling of data has some impact and this year was a
revolutionizing year in the growth of SME. After that, the employment in SSIs has showing a
constant increase of around 5 percent during the four subsequent years.
On the other hand, during the overall period of 1990-91 to 2010-11, the employment has been
increasing with significant CAGR (compound annual growth rate) 7.60 percent having
explained variance of 85.10 percent (R2 = .851). In other words, the future prediction about
employment generation is 85.10 percent correct in this model. Hence, it is concluded from the
explained variance that 14.90 percent unexplained variance arise due to economic fluctuations
which affects the establishment and locked up of SSI units because of sickness. The significant
value of slope coefficient (b1= 0.076) and F (108.889) reveal that the exponential regression and
CAGR are significant. Therefore, the future prediction of number of units is possible and
significant at 1 percent.
Table: 1.1
Performance of MSMEs in Employment
Sr. No. Year Employment % change
1 1990-91 158.34 -
2 1991-92 165.19 4.33
3 1992-93 174.84 5.84
4 1993-94 182.64 4.46
5 1994-95 191.40 4.80
6 1995-96 197.93 3.41
7 1996-97 205.86 4.01
8 1997-98 213.16 3.55
9 1998-99 220.55 3.47
10 1999-00 229.10 3.88
11 2000-01 289.09 26.19
12 2001-02 249.09 -13.84
13 2002-03 260.21 4.46
14 2003-04 271.42 4.31
15 2004-05 282.57 4.11
16 2005-06 294.91 4.37
17 2006-07 594.61 101.62
18 2007-08 626.34 5.34
19 2008-09 659.35 5.27
20 2009-10 695.38 5.46
21 2010-11 732.17 5.29
CAGR 7.60
R2 .851
Adj. R2 .844
b1 0.076*
t 10.435*
F 108.889*
Source: Economic Survey (1990-91 to 2012-13) Ministry of MSME website
*- indicates the level of significance at 1%
MSMEs in terms of Production
A close perusal of Table: 1.2 indicate that the performance of small scale units (MSMEs) in
1990-91 to 2005-06. Subsequently, in the year 2006-07, the data of Micro, Small and Medium
units has been included in the small scale units and shows a steep inclined growth rate of 42.49
percent. Finally no doubt compiling of data has some impact and this year was a revolutionizing
year in the growth of SME. After that, the investment in SSIs has showing a constant increase of
around 10-12 percent during the four subsequent years.
On the other hand, during the overall period of 1990-91 to 2010-11, the production of SSI units
has been increasing with significant CAGR (compound annual growth rate) 14.70 percent
having explained variance of 99.10 percent (R2 = .991). In other words, the future prediction
about production of SSI units is 99.10 percent correct in this model. Hence, it is concluded from
the explained variance that 0.90 percent unexplained variance arise due to economic
fluctuations which affects the establishment and locked up of SSI units because of sickness.
And the production of SSIs is more consistent. The significant value of slope coefficient (b1=
0.137) and F (2040) reveal that the exponential regression and CAGR are significant. Therefore,
the future prediction about production of SSIs is possible and significant at 1 percent.
Table: 1.2
Performance of MSMEs in terms of Production
(Rs. in crores)
Sr. No. Year Production % change
1 1990-91 78802 -
2 1991-92 80615 2.30
3 1992-93 84413 4.71
4 1993-94 98796 17.04
5 1994-95 122154 23.64
6 1995-96 147712 20.92
7 1996-97 167805 13.60
8 1997-98 187217 11.57
9 1998-99 210454 12.41
10 1999-00 233760 11.07
11 2000-01 261297 11.78
12 2001-02 282270 8.03
13 2002-03 314850 11.54
14 2003-04 364547 15.78
15 2004-05 429796 17.90
17 2006-07 709398 42.49
18 2007-08 790759 11.47
19 2008-09 880805 11.39
20 2009-10 989919 12.39
21 2010-11 1095758 10.69
CAGR 14.70
R2 .991
Adj. R2 .990
b1 0.137*
t 45.161*
F 2040*
Source: Economic Survey (1990-91 to 2012-13) Ministry of MSME website
*- indicates the level of significance at 1%
Performance of MSMEs in terms of Exports
It is concluded from Table: 1.3 that the performance of small scale units (MSMEs) in terms of
exports has increased of 52.56 percent during the period of 1991-92. This shows the clear
impact of industrial policy 1991 on exports of SSIs and after that, it has increased continuously
upto the year of 2007-08. Although, there is no impact of the year 2006-07, in which, Micro,
Small and Medium units has been included in the small scale units. Because only registered
units can exports the goods and there is large number of unregistered and unexported medium
scale units included in this category after the announcement of MSMED Act, 2006.
On the other hand, during the overall period of 1990-91 to 2010-11, the exports of SSI units has
been increasing with significant CAGR (compound annual growth rate) 17.70 percent having
explained variance of 97.80 percent (R2 = .978). In other words, the future prediction about
exports of SSI units is 97.80 percent correct in this model. Hence, it is concluded from the
explained variance that 2.20 percent unexplained variance arise due to economic fluctuations
which affects the establishment and locked up of export oriented SSI units because of sickness.
regression and CAGR are significant. Therefore, the future prediction about exports of SSI units
is possible and significant at 1 percent.
Table: 1.3
Performance of MSMEs in terms of Exports
(Rs. in crores)
Sr. No. Year Exports % change
1 1990-91 9100 -
2 1991-92 13883 52.56
3 1992-93 17784 28.10
4 1993-94 25307 42.30
5 1994-95 29068 14.86
6 1995-96 36470 25.46
7 1996-97 39248 7.62
8 1997-98 44442 13.23
9 1998-99 48979 10.21
10 1999-00 54200 10.66
11 2000-01 69797 28.78
12 2001-02 71244 2.07
13 2002-03 86013 20.73
14 2003-04 97644 13.52
15 2004-05 124417 27.42
16 2005-06 150242 20.76
17 2006-07 182538 21.50
18 2007-08 202017 10.67
19 2008-09 20 2009-10 21 2010-11
CAGR 17.70
R2 .978
Adj. R2 .976
b1 0.163*
t 26.531*
F 703.90*
Source: Economic Survey (1990-91 to 2012-13) Ministry of MSME website
MSMEs and Overall Industrial Sector
The MSE sector has maintained a higher rate of growth vis-à-vis the overall industrial sector as
would be clear from the comparative data on growth rates of production for both the sectors
during last five years as shown in the below: -
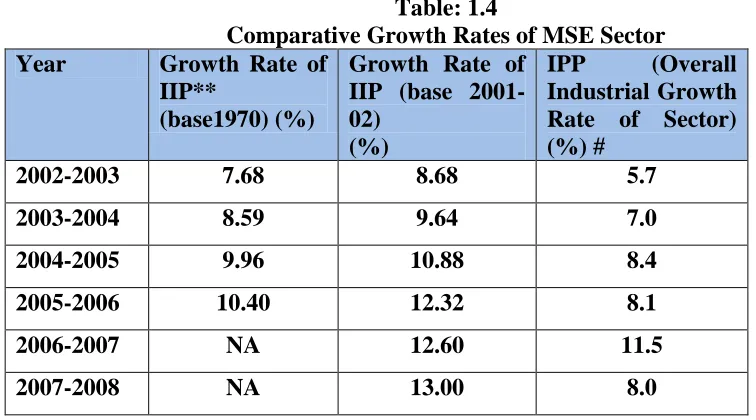
Table: 1.4
Comparative Growth Rates of MSE Sector Year Growth Rate of
IIP**
(base1970) (%)
Growth Rate of IIP (base 2001-02)
(%)
IPP (Overall Industrial Growth Rate of Sector) (%) #
2002-2003 7.68 8.68 5.7
2003-2004 8.59 9.64 7.0
2004-2005 9.96 10.88 8.4
2005-2006 10.40 12.32 8.1
2006-2007 NA 12.60 11.5
2007-2008 NA 13.00 8.0
# Source- M/o Statistics and PI website http://www.mospi.gov.in ** : IIP - Index of Industrial Production
Table 1.4 depicts that the index of Industrial production for the MSME has a gradual increase in
the industrial production from year 2002-2008. If we take 1970 as the base year then the growth
of IIP takes place from 7.68% in 2002-03 to 10.40% in 2005-06. However if we convert the
same to the base of 2001-02 then, it shows an increasing trend from 8.68% in 2002 to 12.32 % in
2005-06 and finally at 13.0 % in the year 2007-08.
One thing quite noteworthy is that although the trend of IIP shows an increasing trend from year
2004-05 to 2005-06 in both the cases but its overall contribution to IPP decreases from 8.4% in
2004-05 to 8.15 in 2005-06. Again in year 2006-07, due to compilation of data for micro, small
and medium industries it shows an increasing trend of 11.5% but in year 2007-08, it again
declines to 8%. Although the IIP was highest for year 2007-08 but its contribution to IPP was
Contribution of MSMEs in GDP
Table: 1.5 show that the total Industrial Production and its contribution in Gross Domestic
production have a continuous declining trend from 39.74% in 2000 to 38.5 in 2006.
Table: 1.5
Contribution of MSMEs in GDP
Year Total Industrial Production
(%)
Gross Domestic Product (GDP) (%)
1999-2000 39.74 5.86
2000-2001 39.71 6.04
2001-2002 39.12 5.77
2002-2003 38.89 5.91
2003-2004 38.74 5.79
2004-2005 38.62 5.84
2005-2006 38.56 5.83
2006-2007** 44.12 7.44
2007-2008** 45.00 8.00
Source: website of MSME
**The data for the period upto 2005-06 is only for small scale industries (SSI). Subsequent to 2005-06, data with reference to micro, small and medium enterprises are being reflected.
However its contribution to Gross domestic production would show varying trend. In year 2001
it shows an increasing trend to 6.04% from 5.86% in year 2000, then it again declines in year
2002 to 5.77% after which are regained momentum in year 2003 and becomes 5.91%. After
compilation of data in 2006-07 its overall contribution to GDP was 7.44% which in 2007-08
increases to 8%.
Bibliography
Ahuja, B.N. (1981), “Small-Scale Industries in India”, IIIrd edition, New Delhi: Verma
Arya, P. P. and Yesh Pal (2001), “Research Methods in Management”, New Delhi: Deep
and Deep Publications.
Bala Shashi (1984), “Management of Small-Scale Industries”, New Delhi: Deep and
Deep Publications.
Balaraju, Thaduri (2004), “Entrepreneurship Development: An Analytical Study”, New
Delhi: Akansha Publishing House.
Johnson, Richard A. and Dean W. Wichern (2003), “Business Statistics: Decision Making with Data”, Singapore: John Wiley & Sons Pvt. Ltd.
Warf, Frederick P. and Barney Stutz (2007), “The world economy: resources, location,
trade and development”, (5th ed. ed.), Upper Saddle River: Pearson.
Acs, Zoltan, Colm O’Gorman, Laszlo Szerb and Siri Terjesen (2007), "Could the Irish
Miracle be Repeated in Hungary?," Small Business Economics, Springer, 28(2): 123-142,
March.
Ahokangas, Petri (1998), “Internationalization and Resources: An analysis of Processes in Nordic SMEs”, Vasa: Vaasan Yliopisto. Doctoral dissertation.
Alagappan, V. and R.M. Nagammai (2003), “Entrepreneurs response to Financial assistance from Institutions”
Armington, Catherine and Zoltan J Acs (1999), "Job Flow Dynamics in the Service
Sector," Working Papers 99-14, Center for Economic Studies, U.S. Census Bureau.
Audretsch, David B. (1995), "The Innovation, Unemployment and Competitiveness
Challenge in Germany," CEPR Discussion Papers 1152, C.E.P.R. Discussion Papers.
Audretsch, David B. and A. Roy Thurik (1999), "Innovation, Industry Evoluation and
Employment," Tinbergen Institute Discussion Papers 99-068/3, Tinbergen Institute.
Audretsch, David B. and Roy Thurik (2001), "Linking Entrepreneurship to Growth,"
OECD Science, Technology and Industry Working Papers 2001/2, OECD Publishing.
Audretsch, David B. and Yvonne Prince and A. Thurik (1999), "Do small firms compete
with large firms?," Atlantic Economic Journal, International Atlantic Economic Society,
Autio, E., H. J. Sapienza and J. G. Almeida (2000), “Effects of age at entry, knowledge intensity, and limitability on international growth”, Academy of Management Journal,