Military Technical Academy, 31-39 Av. G. Cosbuc, 050141 Bucharest, Romania
2LGCGM (EA 3913)-INSA Rennes, UEB, 20 Av. des Buttes de Co¨esmes, 35708 Rennes, France
Abstract. This study refers to an experimental and numerical evaluation of a polyurea coating layer influence on the dynamic behaviour of OL50 specimens. Mechanical quasi-static and dynamic tensile tests were performed in axial loading conditions, for 2 mm steel plate specimens. Several metallic specimens have been previously coated with 1.5 mm and 3 mm respectively thickness polyurea layer and tested in traction. The findings results indicate that the presence of polyurea changes the loading pattern of metallic material in the necking area. In terms of polyurea coated metal specimens fracture, there was clearly observed a change of fracture limit. One possible explanation of this phenomenon is the modification of triaxiality state in the necking zone, fact proven by the numerical simulations. Test results indicate that the presence of polyurea layer delays the necking onset phenomenon which precedes the OL50 metallic specimen fracture.
1. Introduction
Defining constitutive law for all kind of materials has always been a challenging issue addressed by the international scientific community in a continuous manner. Investigating multilayer materials proves to be even a much more difficult process. However, addressing this problem is a need since numerous studies [1–8] underlined the advantages of using this kind of materials in all kind of real life applications.
The present paper focus on the behavior of OL50 steel grade coated with a polyurea layer under both static and dynamic loadings.
A detailed investigation of polyurea had been previously performed in several papers [1,3–5,7]. As a conclusion of the earliest mentioned paper one can say that the polyuria is a recent polymer with a hyper-elastic behavior and good mechanical properties. Due to its good and rapid adherence and short drying period polyurea can easily be used on walls, fabrics and metals coating.
Other interesting characteristics of polyurea refer to its viscoelastic behaviour (strain rate dependent), hysteresis and softening response to cyclic loading and also stoichiometry dependent mechanical properties.
If polyurea investigation is of a more recent interest, metals were thoroughly studied over the last century. Due to this effort, metals behavior dependency on strain, strain rate, temperature, triaxiality state and Lode angle is well known in nowadays. These aspects were addressed in numerous papers such [8,9,12–15].
A previous work on metallic-elastomer layered plates response under static, dynamic and impulsive loading had been conducted by Amini [5,6].
aCorresponding author:[email protected]
Table 1.Mechanical characteristics of steel OL50.
Quality The thickness or diameter of a, in mm
class a≤16
1a Rp0,2[N/mm2] Min Rm[N/mm2] A5(%)
290 490–610 21
The objective of the current study is twofold:
1. experimental investigations on diffuse and localized necking and fracturing of OL50 steel grade dog-bone and biaxial specimens, both in the absence and the presence of polyurea coating;
2. numerical investigations of triaxiality state in the necking area for the tested configurations.
For this study, based on the large scale applications, OL50 steel grade has been selected for investigations. In order to evaluate the change of its mechanical behavior in the presence of a polyurea layer, several dog-bone specimens were manufactured according to ISO 6892-1 standard [16].
2. Experimental part
2.1. Testing set-up
OL50 steel grade is a structural steel characterized by: 20.1·1010N/m2 Young modulus, 8.25·1010N/m2
shear modulus, 160–200 HB hardness and 24–29 kgf/mm2 fatigue strength. According to the manufacturing data sheet at room temperature other mechanical characteristics are according to the ones presented in Table1.
a b
Figure 1.a – Test assembly, b – Type of specimens.
The extra material is part of the polymer composite that is remarkable for being sticky and hyperplastic, namely polyurea brand EUROPOL.R
Laboratory tests consisted in performing several tensile trials in both quasi-static and dynamic regime. Three different geometric configurations had been selected for testing:
1. G1 - short simple specimens (50 mm active area), 2. G2 - intermediary specimens (50 mm active area):
bilayer polyureasteel (PS) and multilayer -polyurea-steel-polyurea (PSP),
3. G3 - long simple specimens (80 mm active area). In all these three configurations a 2 mm thick steel specimen was used. For G2 and G3 configurations the final thickness for the tested specimens in the active area after spraying the polyurea was about 5 mm as follows: for bilayer specimens, polyurea layer thickness had about 3 mm and for multilayer specimens 1.5 mm on each side. On the specimen length, the polyurea has been sprayed centrally on a length of 70 mm with 50 mm active area according to Fig.1b.
Tests were performed on a universal testing machine belonging to the Laboratory of Civil and Mechanical Engineering & Technological Platform of INSA Rennes (France). The tests were performed at 1 mm/s, 0.5 m/s, 1 m/s and 2 m/s regime.
Figure1presents the specimens configurations and the used clamping assembly in the experimental device.
During the tests, displacement of the machine arm and the force had been recorded via machine transducers.
Experimental biaxial tests have been also realized in static and dynamic conditions using special cruciform specimens. Unfortunately the data recorded in those tests have poor quality being extremely affected by oscillatory phenomena, which limited their classical analysis, but necessary to understand the qualitative material behavior for high strain rates.
2.2. Experimental observation
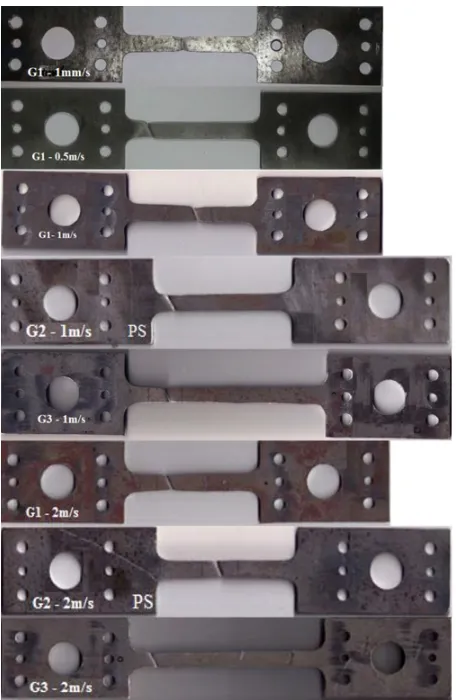
All experimental tests indicate the specific behavior of ductile metals, namely the occurrence of a necking zone before fracture moment as shown in Fig.2.
Figure 2.Necking and fracture area of specimens obtained from uniaxial tensile tests.
a b c
Ductile fracture Ductile
fracture Difusse
necking
Figure 3.PSP Multilayer specimen radiography: a, b - 1 m/s, c-2 m/s.
Necking and fracture patterns for tested specimen are presented in Fig. 2 and Fig. 3. For the G2 PSP configuration X-ray analysis was performed.
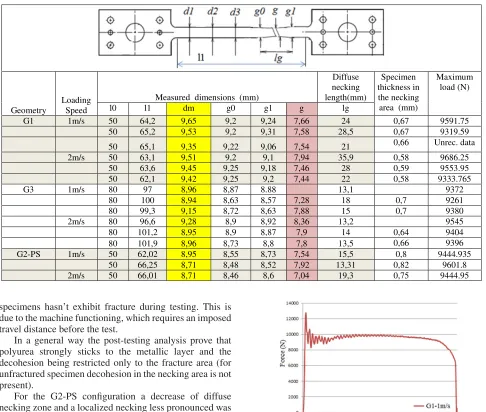
50 65,2 9,53 9,2 9,31 7,58 28,5 0,67 9319.59
50 65,1 9,35 9,22 9,06 7,54 21 0,66 Unrec. data
2m/s 50 63,1 9,51 9,2 9,1 7,94 35,9 0,58 9686.25
50 63,6 9,45 9,25 9,18 7,46 28 0,59 9553.95
50 62,1 9,42 9,25 9,2 7,44 22 0,58 9333.765
G3 1m/s 80 97 8,96 8,87 8.88 13,1 9372
80 100 8,94 8,63 8,57 7,28 18 0,7 9261
80 99,3 9,15 8,72 8,63 7,88 15 0,7 9380
2m/s 80 96,6 9,28 8,9 8,92 8,36 13,2 9545
80 101,2 8,95 8,9 8,87 7,9 14 0,64 9404
80 101,9 8,96 8,73 8,8 7,8 13,5 0,66 9396
G2-PS 1m/s 50 62,02 8,95 8,55 8,73 7,54 15,5 0,8 9444.935
50 66,25 8,71 8,48 8,52 7,92 13,31 0,82 9601.8
2m/s 50 66,01 8,71 8,46 8,6 7,04 19,3 0,75 9444.95
specimens hasn’t exhibit fracture during testing. This is due to the machine functioning, which requires an imposed travel distance before the test.
In a general way the post-testing analysis prove that polyurea strongly sticks to the metallic layer and the decohesion being restricted only to the fracture area (for unfractured specimen decohesion in the necking area is not present).
For the G2-PS configuration a decrease of diffuse necking zone and a localized necking less pronounced was observed. Furthermore the elongation increase compared with G1 configuration was noted (Fig.2).
During the test, due to used transducers presence, force vs. displacement data were recorded. An example of such data for G1 configuration and 1 m/s loading speed is plotted in Fig.4.
As one can observe in Fig. 4 that due to the dynamic behavior of the sensor and elastic deformations of the machine, the curve profiles present oscillations more or less pronounced, which required a mathematical smoothing process.
Force vs displacement data recorded during experi-mental tests were processed to true stress vs. true strain data, by the use of classical analytical model based on the assumption of tension and deformation homogeneity in the central section of the specimen. The results are presented in Fig.5.
A comparative analysis between G1 and G2 configuration test specimens in terms of force vs. displacement agrees with post-test measurements which highlighted an increase elongation in G2 configuration test specimens.
Figure 4. The experimental curve force vs. displacement evolution for test at 1 m/s.
Figure 6. The experimental force vs. displacement curve evolution for specimens G1 and G2.
Table 3.Initial values of strain rates.
Geometry Loading Speed Initial value of strain rates G1,G2 1 m/s 20 s−1
2 m/s 40 s−1
G3 1m/s 12.5 s−1
2 m/s 25 s−1
Figure 7.Ductile fracture for uniaxial specimen with detail on the area subjected to dynamic load.
3. Numerical simulation of uniaxial
tensile tests
In order to investigate by numerical means the physical phenomena occurred during uniaxial tensile tests, several simulations had been performed using LsDyna commercial software.
Numerical simulations were performed for both G1 and G2 bi-layered configurations.
For G1 configuration case the 2D numerical model involved the use of 15600 type 2 shell elements. The mesh length for active areas was 0.25 mm and 1 mm for the rest of the specimen. However, knowing that an accurate result involves smaller mesh dimensions an Adaptive Mesh triggered by shell thickness had been implemented in the
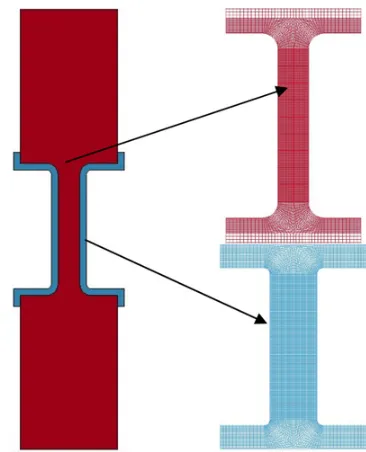
Figure 8. Dog-bone specimen mesh and details on the area subjected to dynamic load.
Figure 9.Comparison between numerical and experimental force vs. displacement curves.
numerical simulation. Two sets of nodes had been defined and constrained (one to move along Y axis (specimen top) and the other one to have no movements (specimen bottom).
For OL 50 steel grade material card a simplified Johnson Cook constitutive model, without fracture parameters, has been chosen. The material parameters were obtained by classical data processing of the quasi-static and dynamic experimental test results. The identified values for material parameters were:A=382.4 MPa,B= 226.5 MPa,C =0.019,n=0.201.
Starting from experimental dynamic tests, analysis tensile loads at constant velocity are considered. Initial values of strain rates are defined by ˙ε0 =v0/l0where (v0)
is the loading speed and (l0) is the active area. The initial
values of strain rates are presented in Table3.
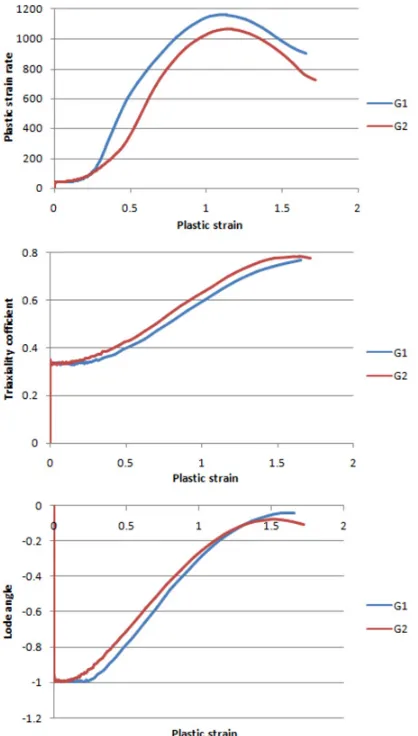
Figure 10. Parameters evolution depending on the effective plastic strain for G1 and G2.
Figure 11. Iso-values of effective strain rate and triaxiality obtained for a plastic strain value of 0.4.
simulations total length, thickness in the necking area and specimen width in the same area had been observed and compared with the measured ones in order to identify the values for the fracture strain. Also, a supplementary check was performed in order to ensure that the numerical simulation is in agreement with the real test. For this purpose force vs. displacement for the specimen top
Figure 12. Iso-values of effective strain rate and triaxiality obtained for a plastic strain value of 0.8.
Figure 13. Iso-values of effective strain rate and triaxiality obtained for a plastic strain value of 1.2.
was plotted against the numerical one showing good agreement. In Fig.7is highlighted the fracture pattern for G1 specimen during the dynamic traction.
For G2 configuration case, since polyuria was added not only on the front of the specimen but also on the sides, a 3D modeling approach seems necessary (Fig.8). For the 3D simulation the same steps as in 2D case were imposed. The only main difference was related to Adaptive Mesh card. Due to the impossibility to define such a card for hexahedron elements this line was skipped. The 3D numerical simulation involved the use of type 1 hexahedron elements. Between the two layers (steel and polyurea) a Contact Tiebreak type without considering debonding was defined since post-test observations have indicated that up to fracture polyurea remains in contact with the metallic layer.
For polyurea a hyperelastic rubber constitutive model was used. The material parameters were adopted from available scientific literature [7].
The numerical simulations allowed also performing for the necking center area a comparative analysis (between G1 and G2 test configurations) regarding strain rate, triaxiality and Lode angle evolution (Fig.10).
In Figs.11–13are presented the iso-values of effective strain rate and triaxiality for different values of plastic strain during the necking process: 0.4, 0.8 and 1.2. The information are presented in order to highlight the heterogeneity of the three studied phases: diffuse necking, localized necking and fracture. The images corespond to a 3D numerical simulation of G1 test configuration.
4. Conclusions
The experimental results show imperceptible increases of the maximum load for the coated specimens. In terms of elongation until fracture a 20% increase is observed and an 18% increase of consumed energy is computed.
Geometric analysis showed distinct changes concern-ing the neckconcern-ing area which was reduced by approximately 45% for the coated specimens. Concerning the average width of the specimens in the area unaffected by the necking this one was reduced by 7%, indicating clearly that the presence of a polyurea layer change the evolution of necking phenomenon, information that is consistent with the data presented in other scientific works as [8,9].
To improve the analysis of dynamic tensile loadings, numerical investigations were performed using the Ls-Dyna solver.
Numerical results indicate that the presence of the polyurea layer changes the loading pattern of metallic material in the necking area. In fact the polyurea takes an important role during the tensile loading and increases the material ductility. It is also observed that the stress triaxality it is influenced by the use of the polymeric layer, due to its strain hardening visco-elastic behavior. Furthermore due to strain rate increase phenomenon characterizing the necking area this behavior is even more highlighted.
In terms of fracture limit the coated specimens exhibit a clear decrease due to a different evolution of strain rate, triaxiality and Lode angle.
As a general conclusion the experimental test results indicates that the presence of a polyurea layer increases the ductility and delays the necking phenomenon due to elasto-viscoplastic properties of the polymer.
This paper has been supported in part by UEFISCDI GRANT 278/2014.
References
[1] K. Ravi-Chandar, Experimental Characterization of Nonlinear Viscoelastic and Adhesive Properties of Elastomers - Report, The University of Texas (2006)
[2] M. Feaga, The effect of projectile strike velocity on the performance of polyurea coated RHA plates under ballistic impact – Disertation, Lehigh University (2007)
[3] L. Xue, W. Mock Jr. T. BELYTSCHKO, Mechanics of Materials No.42, pp. 981–1003 (2010)
[4] J. Shim, D. Mohr, Mechanics of Materials No. 43, pp. 349–360 (2011)
[5] M.R. Amini, J. Isaacs, S. Nemat-Nasser, Mechanics of Materials,42, 6, pp. 628–639 (2010)
[6] M.R. Amini, Effect of polyurea on dynamic response and fracture resistance of steel plates under impulsive loads - Disertation, University of California (2007)
[7] C. Gamonpilas, R. McCuiston, Polymer, 53, pp. 3655–3658 (2012)
[8] Z. Xue, A. Vaziri, J.W. Hutchinson, Journal of the Mechanics and Physics of Solids,56,93–113 (2008) [9] Z. Xue, John W. Hutchinson, Mechanics of
Materials,39, 473–487 (2007)
[10] Ling Y., AMP Journal of Technology, 5, (1996)
[11] Lee Y.-W., Wierzbicki T., International Journal of Impact Engineering,31, pp. 1253–1276 (2005) [12] G.R. Johnson, W.H. Cook, Engineering Fracture
Mechanics,21, 31–48 (1985)
[13] A. Gavrus, Key Eng. Mat. 504-506, pp. 697–702 (2012)
[14] T. Wierzbicki, Y. Bao, T.-W. Lee, Y. Bail, International Journal of Mechanical Science 47 719–743 (2005)
[15] J. Barsoum, S. Faleskog, Procedia Engineering, 10, 69–75 (2011)
[16] International standard,ISO 6892-1, (2009)