CO
2-neutral fuels
A. P. H. Goede(∗)
Dutch Institute for Fundamental Energy Research DIFFER PO Box 6336, 5600 HH Eindhoven, The Netherlands
Summary.— The need for storage of renewable energy (RE) generated by photo-voltaic, concentrated solar and wind arises from the fact that supply and demand are ill-matched both geographically and temporarily. This already causes problems of overcapacity and grid congestion in countries where the fraction of RE exceeds the 20% level. A system approach is needed, which focusses not only on the energy source, but includes conversion, storage, transport, distribution, use and, last but not least, the recycling of waste. Furthermore, there is a need for more flexibility in the energy system, rather than relying on electrification, integration with other energy systems, for example the gas network, would yield a system less vulnerable to failure and better adapted to requirements. For example, long-term large-scale stor-age of electrical energy is limited by capacity, yet needed to cover weekly to seasonal demand. This limitation can be overcome by coupling the electricity net to the gas system, considering the fact that the Dutch gas network alone has a storage capacity of 552 TWh, sufficient to cover the entire EU energy demand for over a month. This lecture explores energy storage in chemicals bonds. The focus is on chemicals other than hydrogen, taking advantage of the higher volumetric energy density of hydro-carbons, in this case methane, which has an approximate 3.5 times higher volumetric energy density. More importantly, it allows the ready use of existing gas infrastruc-ture for energy storage, transport and distribution. Intermittent wind electricity generated is converted into synthetic methane, the Power to Gas (P2G) scheme, by splitting feedstock CO2and H2O into synthesis gas, a mixture of CO and H2. Syngas plays a central role in the synthesis of a range of hydrocarbon products, including methane, diesel and dimethyl ether. The splitting is accomplished by innovative means; plasmolysis and high-temperature solid oxygen electrolysis. A CO2-neutral fuel cycle is established by powering the conversion step by renewable energy and recapturing the CO2 emitted after combustion, ultimately from the surrounding air to cover emissions from distributed source. Carbon Capture and Utilisation (CCU) coupled to P2G thus creates a CO2-neutral energy system based on synthetic hydro-carbon fuel. It would enable a circular economy where the hydro-carbon cycle is closed by recovering the CO2 emitted after reuse of synthetic hydrocarbon fuel. The critical step, technically as well as economically, is the conversion of feedstock CO2/H2O into syngas rather than the capture of CO2 from ambient air.
(∗) E-mail:[email protected]
/ / 98
7KLVLVDQ2SHQ$FFHVVDUWLFOHGLVWULEXWHGXQGHUWKHWHUPVRIWKH&UHDWLYH&RPPRQV$WWULEXWLRQ/LFHQVHZKLFKSHUPLWV
C
1. – CO2-neutral fuels
1.1. What are CO2-neutral fuels? – CO2-neutral fuels are synthetic hydrocarbons
produced from recycled carbon dioxide and water. These molecules are split and sub-sequently synthesized into fuels by employing renewable energy such as wind and solar energy. After synthetic fuel combustion, the CO2 emitted is recycled. This CO2 is captured from point source initially, but eventually must include direct air capture to account for emission from inherently dispersed source such as petrol-driven motor cars, aeroplanes and gas-fired household appliances. By recapturing and re-using the CO2 emitted, the CO2 cycle is closed, establishing an equilibrium condition. This mimics the carbon cycle of the Earth System, which has been in near equilibrium for over a million years,i.e.the age of mankind, as witnessed by the Vostok ice core measurements display-ing the geological record of CO2 air concentration [1]. In contrast, the burning of fossil fuels such as coal, gas and oil, increases the CO2content of the Earth atmosphere—from 285 ppm in year 1850 to 400 ppm in year 2014—at increasing rate, currently over 2 ppm per year, which drives the Earth System out of equilibrium through enhanced greenhouse gas radiative forcing.
Fossil fuels were established much earlier in geological history when the Earth System was in a different state. For example, coal was formed during the Carboniferous period 360 to 290 Myrs ago, characterised by abundant plant growth during which CO2 levels dropped from about 1400 ppm to 360 ppm. This drop in CO2 level was followed by a cooling of the Earth surface from a global average of 20◦C to 12◦C, similar to today’s value of around 14◦C. Interestingly, this change in climate occurred abruptly, long after CO2 levels had stabilised at 360 ppm. It went along with the icing up of the Southern supercontinent Gondwanaland and a drop in sea level by several meters. It is tempting to speculate whether the present anthropogenic burst of CO2, releasing the carbon content stored during the Carboniferous period, would cause a reverse mode flip in the state of the Earth System.
Fig. 1. – CO2 evolution over the Northern Hemisphere as measured by the space instrument SCIAMACHY on the ESA Envisat. Several CO2 retrieval algorithms are compared reaching a precision of about 2.5 ppm [4]. The Japanese space instrument TANSO on GOSAT extends the SCIAMCHY dataset from 2009 onward. Source: http://www.iup.uni-bremen.de/~mreuter/ besd.php.
A ten-year record (2002–2012) of the CO2concentration distribution over the North-ern Hemisphere, measured by SCIAMACHY, shows the yearly CO2 cycle superimposed on the incremental man-made rise, see fig. 1 [5]. The capture of CO2 from the air by green leaves in spring and summer combined with water extracted from the soil, converts into hydrocarbons when energised by solar NIR photons absorbed. In autumn and winter CO2 respiration re-establishes the CO2 concentration. Bio-mass created in the process are the archetypal CO2-neutral fuel, sustainable when replanted and minerals conserved after being burnt.
1.2.Why are CO2-neutral fuels needed? – It is important to understand the driving
force behind the development of CO2-neutral fuels, and indeed Renewable Energy in general, be it depletion of natural resources, climate change or energy security, for this affects energy policy and choices made in their development. In the 1970’s after the first oil crisis, depletion of oil reserves was the driving force behind the move to develop Renewable Energy sources. The concept of sustainability was introduced. Various forms of solar energy emerged together with high-power wind machines. In the eighties the notion of climate change took hold in the scientific community resulting in the UN governed IPCC report series in the nineties. In the past decade this notion percolated into EU policy, perhaps triggered by the 2006 Stern report quantifying the economic impact of climate change, notably the cost of deferred action [6].
shale gas and oil, lignite, tar sands or methane clathrates also serves energy security, but these are fossil fuels that are not renewable and are not CO2-neutral.
Fossil energy sources, albeit finite, are still abundant in terms of world energy reserves. This is true for coal with reserves of over 300 years, particularly in China, but also gas reserves have recently expanded from 50 years to over 200 years, as a result of “fracking” a new method to release natural gas from shale beds. Fracking of shale oil has even caused a glut in the oil market. On the other hand, the demand for oil in the rich world has peaked, indeed it has fallen since 2005, in part because of efficiency increases in petrol and diesel engines (25% over the last 10 years) and the emergence of electric and hybrid cars, but also because of a switch to gas to power lorries, buses, ships as well as domestic and industrial heating systems [7].
Climate change, driven by man-made greenhouse gas emissions, is predicted to act on a much shorter time scale. So far, global mean surface temperature has risen by 0.5◦C, with a recent lull not fully understood, but believed to be due to heat stored in the depth (>700 m) of oceans [8, 9]. Most scientists and indeed world governments place a 2◦C limit on global mean warming beyond which the habitability of the Earth would be jeopardised. For the first time, the IPCC-5 report defined a carbon budget of 1000 Gt total C emission associated with the 2◦C temperature rise [10]. Already 545 Gt C has been spent during the 1750–2011 period. With a yearly emission of 10 Gt C at present, the safe limit would be reached by 2047±14 year under a business as usual scenario. Under a pro-active emission reduction scenario, this point in time would be reached by 2069±18 year [11]. Hence, the time scale for dangerous temperature rise is 30 to 50 years, an order of magnitude shorter than the fossil resource depletion scenarios.
Therefore, reining in CO2emissions, eventually reaching a CO2-neutral or carbon-free energy system, must be the main driver for moving away from fossil fuels and going for renewables. This is a global challenge. The bulk of CO2emissions so far (1850–2010) has come from the US (480 Gt CO2) and the EU (440 Gt CO2), but are now overtaken by the developing world accounting for over half of the CO2emissions [12]. In 2012 the EU share was 13% and diminishing. Hence, only concerted international effort can reduce global CO2 emissions.
1.3.How to produceCO2-neutral fuels?
modification of engines to resist corrosion.
Second-generation bio fuels hoped to avoid the food-versus-fuel debate by extracting feedstock from bio mass with no nutritional value such as agricultural waste, fast growing trees and grasses grown on otherwise unproductive land. But instead of taking off the bio fuel industry stalled. There were several problems; first breaking down woody cellulose into simple sugars and converting these into drop-in fuel required thermo-chemical or bio-chemical processes that proved costly and difficult to upscale [15]. Secondly, the food-versus-fuel debate turned into a flora-versus-fuel debate. Most important however is the fact that there is not enough biomass around to make a dent in the 2500 million litres of conventional oil that American refineries churn out each day. More than one million tonnes of biomass would be required to produce 500 million litres of bio fuel. Only certain areas in Brazil, Asia or the US would be able to produce such staggering amounts of bio mass [16].
Bio-mass is a scarce commodity. One way forward is to use bio-mass available more effectively. For example, fermentation of cattle manure produces methane (60%) and carbon dioxide (40%), the latter released as waste into the atmosphere. This CO2 emis-sion can be converted into syngas by plasmolysis followed by methanation. It boosts the overall bio-gas yield with no CO2 emission, plasmolysis being driven by renewable energy. Gasification of bio-mass heated to high temperature (∼1300◦C) in the presence of oxygen, usually preceded by pyrolysis (without oxygen at 500–600◦C), also emits CO2 as a waste. Converting this CO2stream into additional syngas and oxygen by RE driven plasmolysis again enhances bio-fuel yield. A similar approach, followed by a number of City Councils, is the gasification of municipal waste to produce syngas [17]. Such gasification-plasmolysis tandem avoids CO2 emission, whilst producing oxygen to fire the plant, enhancing syngas production for the same amount of bio-mass.
1.3.2. Solar fuels. In a broad sense, solar fuels (SF) are defined as feedstock H2O and CO2 converted into fuel by solar energy, either by converting solar photons directly into fuel, or indirectly through the intermediate of electricity. Solar fuels sometimes extend to include wind energy, inasmuch as the weather system is driven by the Sun. The direct route can be either photo-chemical or thermo-chemical, the indirect route either electro-chemical or plasma-chemical. Direct conversion of solar energy into hydrogen or hydrocarbons is commonly referred to as artificial photosynthesis [18]. In this paper, the focus is on hydrocarbons rather than hydrogen, because of the higher volumetric energy density, existing infrastructure and engine technology.
Direct conversion
Fig. 2. – a) Direct conversion of sunlight into hydrocarbons [19-24]. b) Indirect conversion of renewable energy into hydrocarbons through electricity production.
nano-particles showing photo catalytic reduction of CO2 and water vapour directly into methane [20]. The maximum attainable energy efficiency is estimated at 17%, but actual values measured are in the sub-percentage range (0.03% to 0.74%).
Indirect conversion
Although conceptually attractive, the direct conversion route has a long way to go to reach useful efficiencies. Indirect conversion technology already produces fuel at an order of magnitude higher energy efficiency. For example, photo-voltaic solar panels driving modern electrolysers produce hydrogen at ∼20% overall efficiency. Employing the re-verse water gas shift reaction to create syngas, followed by a Fischer-Tropsch reaction to produce liquid hydrocarbon fuel, reaches an overall energy efficiency of about 10% [25]. New developments improve on this result, see fig. 2b.
High-temperature (700–800◦C), high-pressure (50 bar) Solid Oxygen Electrolyser Cells (SOEC) have recently been reported to produce syngas in one step by co-electrolysis of CO2and H2O [26]. Issues include degradation of the electrodes at high-current-density operation due to chemical diffusion. The fuel cathode is made of porous nano structured Ni/YSZ (Y2O3 stabilised ZrO2), the elctolyte layer consists of YSZ (Yttria stabilised Zirconia) and the oxygen anode is a porous SrO doped LaMnO3(LSM/YSZ). Electrodes are key to performance. Alternative perovskyte oxides explored, including LSCF (Lath-anum Strotium Cobalt Ferrite) and SSC (Samarium Strontium Cobalt), show stable high electronic conductivity [27]. Direct synthesis of methane by combining co-electrolysis of CO2/H2O andin situFischer-Tropsch has also been demonstrated, albeit at low Faradaic yield [28].
Plasma-chemical conversion or plasmolysis is an effective means to split CO2. The plasma (ionised gas) serves as a vehicle to ease conditions for splitting CO2. The plasma is produced by microwaves that accelerate the electrons, which vibrational excite the CO2 molecules to a state conducive to dissociation into CO and O. Such plasma is weakly ionised (only one in 105 molecules is ionised) and relatively cold, similar to a fluorescent lamp. The vibrating molecules are not in thermal equilibrium with the gas temperature (translational motion) and hence no energy is wasted on heating the gas. The energy to produce the plasma is a relatively low factor in the energy balance. Most energy is channelled into vibrational excitation of CO2molecules [29]. By vibrational up pumping the energy of some CO2 molecules is raised, at the expense of others, to overcome the dissociation barrier.
2. – A CO2-neutral energy system
2.1. The need for energy storage. – Handling renewable energy requires a system
approach that includes energy storage. Currently this is not the case. This already causes problems with the integration of renewables in the electricity net. For example, surplus German North-South flow of wind electricity is diverted into eastern border countries causing black-outs in the Czech Republic [30]. In Denmark and the Netherlands it has led to negative electricity prices. Spain lost 90 M¤ in 2012 revenue due to wind power curtailment [31]. The need for back-up power causes countries with the highest RE share to be the largest CO2 polluters.
Fig. 3. – Power duration for various forms of electricity storage. P2G is different because gas can be used directly as energy carrier, with no need to convert back into electricity. Source DNV-KEMA.
argued that smart grids, ICT and cross-border transmission lines (copper plate Europe) could solve the problem. However, considering meteorological data on wind over Western Europe over the period January-February 2012 it is clear that peaks and lows in wind are correlated over large areas of Western Europe [32]. Hence, calm in Germany is not always compensated for by strong wind in Spain. Smart grids and ICT will not be able to solve this problem when calm or storm persist over several days to a week whilst RE penetration exceeds the 30% level. A fundamental mismatch exists between load duration curves and RE supply curves [33], which can only be overcome by large-scale seasonal energy storage. Storage capacity needed at EU level to bridge one day of electrical power demand is of the order of 10 TWh. By comparison, the EU total hydro-energy storage capacity is approximately 15 TWh. This is not sufficient to cover long term energy storage required for high penetration RE foreseen by the EU 2050 Energy Roadmap.
2.2. Energy storage in chemicals. – One feasible way to meet EU long term large
scale energy storage requirements is through storage in chemical bonds [34], the Power to Gas (P2G) scheme, converting RE electricity into gas. As compared with flywheels, batteries, compressed air (CAES) and pumped hydro, chemicals offer long-term and large-scale energy storage. In addition, gas can be directly employed as an energy vector, see fig. 3.
Fig. 4. – Volumetric energy density of gaseous and liquid hydrocarbons. Source EERA [36].
no alternative to hydrocarbon exists. Methane is widely used for domestic and industrial heating. An increasing number of buses, lorries and ships are powered by gas following the recent boom in shale gas. The existing EU gas network already provides EU wide energy storage capacity. The storage capacity of the Dutch gas network alone is 552 TWh [35], sufficient to cover EU electricity supply for over a month.
2.3.Power to gas. – Rather than strengthening the electricity grid, integration with
the existing EU gas grid would provide the required balancing of power and relieve the electricity grid from peak power. This is the Power to Gas (P2G) scheme. Capital investment in electric grid expansion is avoided and economic advantage is gained by the fact that transportation of gas is more than a factor 10 cheaper than transport of the same amount of electric energy, see table I. This fact is important in establishing a European wide energy network.
For example, Spain produces surplus wind electricity that at present is curtailed. Cross border electricity grid connection with France is limited to about 2% of Spain electric power capacity. By converting this surplus electricity into gas and piping it across the Pyrenees, rather than expanding the high voltage grid, would be cheaper, more flexible and complementary to France nuclear power generated electricity. The case is particularly interesting for balancing wind power, because wind over the Iberia peninsula, is less correlated with wind fields over N-W Europe. In general, P2G could replace electricity to meet the increasing demand for energy. In a number of EU countries energy consumption from gas already exceeds that of electricity. In the Netherlands in 2011, gas made up for more than 26% of total energy consumption against less than 13% for electricity.
TableI. – Comparison of capital investment cost per kW power transported for electricity and gas transport lines in comparable situation. Gas is a factor20cheaper. Source: Gas Unie, The Netherlands.
Power: BritNed Gas: BBL
Length 260 km 230 km
Investment 600 M¤ 500 M¤
Capacity 1 GW 20 GW
Specific investment costs ¤230/kW/100 km ¤11/kW/100 km Nord stream gas pipeline: ¤9/kW/100 km (Russia to Europe via Baltic).
A model P2G system is shown in fig. 5. Surplus electricity is converted into syngas by electrolysis or plasmolysis from feedstock CO2/H2O. Syngas is the central element in the system from which either liquid or gaseous fuel is produced. After use, the Carbon Cycle is closed by recapturing CO2 emitted, either from flue gas or directly from air.
2.4. Fuel synthesis. – Two parallel routes lead to syngas, either producing CO and
forming hydrogen by the Water Gas Shift Reaction (WGSR) or producing hydrogen followed by the reverse WGS reaction (RWGS). The CO/H2 ratio is tuned to fuel syn-thesis requirement by adjusting the WGSR and RWGS reaction respectively. The overall scheme is illustrated by fig. 6.
To produce fuel, catalysts play a crucial role. The role of a catalyst is to absorb the reactants on the catalyst surface, reshuffle and recombine the molecules into new products that then desorb from the catalyst surface. If the CO bond stays intact, methanol is formed. If the CO bond is broken higher alkanes are formed. Innovation is found in the development of new catalysts that lower pressure and/or temperature of the chemical reaction, improve product selectivity and remain stable.
Fig. 6. – Two parallel routes to syngas either by producing CO followed by WGS or by produc-ing Hydrogen followed by RWGS reaction. Conversion of Syngas into fuel requires a suitable catalyst.
WGS
The water gas shift reacts carbon monoxide with water vapour to form hydrogen and carbon dioxide:
CO + H2O↔CO2+ H2, ΔH298 K=−41.1 kJ·mol−1(WGS).
This reaction, discovered by Fontana in 1780, is exothermic yielding 41.1 kJ per mole and proceeds in two steps; (1) at 350◦C promoted by an iron chromium oxide (Fe3O4/Cr2O3) catalyst and (2) at 200◦C catalysed by copper zinc oxide supported on alumina (Cu/ZnO/Al2O3).
RWGS
The Reverse Water Gas Shift reaction is an endothermic equilibrium reaction requiring energy input to proceed to reactant formation at relatively high temperature (800◦C)
H2+ CO2↔CO + H2O, ΔH298 K= +41.1 kJ·mol−1 (RWGS).
Methanation
Methanation converts carbon oxides into methane by hydrogenation according to either one of the following highly exothermic reactions:
CO + 3H2↔CH4+ H2O, ΔH298 K=−206 kJ·mol−1 (Syngas reaction),
CO2+ 4H2↔CH4+ 2H2O, ΔH298 K=−164.9 kJ·mol−1 (Sabatier reaction).
Both reactions, known for over 100 years, have been extensively studied for thermody-namics, kinetics and deactivation mechanisms. Methanation is a commercially available technology. The process usually takes place in different adiabatic reactors coupled in series, due to conflicting kinetic and thermodynamic requirements. The temperature is decreased after each reactor and water is removed in order to produce methane com-patible with pipeline specifications. Nickel is typically used as a catalyst because of a trade-off between reaction rates and costs compared with ruthenium which is more efficient.
Methanol
Syngas is converted into methanol by the exothermic reaction:
CO + 2H2−→CH3OH, ΔH298 K=−91 kJ/mol.
This reaction is catalysed by a Cu/ZnO surface supported by Al2O3 atT = 220–275◦C and p = 50–100 bar. Excess heat produced needs to be removed in order to remain selective to methanol. Apparently, a small amount of CO2 plays a crucial role in the hydrogenation, with CO merely providing a source of CO2 [38]. Methanol can be cat-alytically combined into DME (CH3OCH3) involving dehydration.
Alkanes
Fischer and Tropsch developed this process nearly 100 years ago to convert syngas into a range of liquid hydrocarbon products and deployed during World War 2, the so-called Ersatz fuels:
(2n+ 1)H2+nCO−→CnH2n+2+nH2O, where n >1.
Fig. 7. – Residual Load [GW] of the electricity grid plotted against hours of the year (8760 hrs) with specific power load demand. The solid black line is the “must run” load. Positive Residual Load means power shortage, negative means surplus power. The various scenarios indicate how load is relieved by introducing Renewable Energy (RES) and Energy Efficiency (EFF). In order to balance supply and demand, these curves determine the energy storage capacity required. (Source ECN).
2.5. Balance of supply and demand. – High share RE scenarios yield increasing
amounts of surplus electricity. In Germany, surplus RE generated is expected to amount to 34.5 TWh per year in 2035 and between 160 and 260 TWh in 2050, depending on the RE scenario adopted [39]. For the Netherlands, approximately 1.5 TWh surplus wind energy will be generated in 2025 in a 12 GW wind scenario, in 2050 this will increase to 30–55 TWh/yr [40]. The yearly amount of wind power available to relieve the electricity load is expressed in the load duration curve. In fig. 7, these load curves are plotted for various RE penetration scenarios for the Netherlands [39]. Load surplus and load shortage are expressed as residual load over the “must run” load. Integrating under the curve determines the energy storage capacity required for balancing supply and demand of the electricity grid on a daily, weekly and seasonal basis.
Optimisation of Power to Gas (P2G) requires fast dynamic stabilisation of electric power in response to intermittent wind supply. The P2G system discussed here provides fast ramping up and down of the conversion system within seconds. The response time of the reverse Gas to Power (G2P) system for back-up electricity generation defines the lead time for the integrated energy system, which for gas turbines is around 15 min to ramp up. However, using gas directly, rather than re-converting it back into electricity, would avoid the energy efficiency penalty going with G2P. It would use synthetic gas as an energy vector directly to replace fossil fuel.
provides the basis for a business case for P2G. In addition, the capacity factor of wind turbines, defined as the ratio of wind turbine installed capacity over actual power pro-duced, presently at a 17% low in Germany 2012, is raised by P2G and capital investment accordingly reduced. Capital investment needed to strengthen the electricity grid to handle peak intermittent RE power is avoided by integration with P2G.
Nevertheless, the business case for P2G remains rather tenuous at this point in time. Market conditions are not conducive to the Emission Trading System (ETS) which sets a (too) low price on carbon, whilst the UNFCCC principle “polluter pays” does not seem to apply to CO2 emissions. Economic viability of the P2G system will much depend on future government regulation.
3. – End-to-end system
3.1. Overall concept. – A hybrid energy system converting surplus wind electricity
into gas is presented in fig. 8, the power to gas concept. Approximately 30 P2G schemes are currently under development in the EU, mainly in Germany [35, 40]. Most P2G projects produce hydrogen, only a few have methane as end product. Although carbon free, hydrogen storage and transport is limited by low energy density per volume which requires compression, liquefaction or metal hydrides for storage. Application for mobility is limited by lack of distribution infra-structure. Blending hydrogen in the natural gas network is limited by the maximum allowed hydrogen fraction. For the Dutch gas grid this limit is 0.02 vol.%. In Germany higher percentages of hydrogen are allowed (up to 10 vol.%) unless prevented by technical risk (leakage, corrosion) or safety. End to end efficiency of the P2G systems producing methane ranges from 50% including carbon capture from a point source reduced to 34% when capturing directly from atmosphere. The Combined P2G-G2P system reduces this efficiency to 26% and 18% respectively [35].
The technical Power to Gas system requirements may be summarized by:
– High-energy efficiency and high conversion ratio
– High-energy density and high flow rate for upscaling to MW level
– Fast dynamic response to intermittent electric power supply
– No scarce materials employed.
3.2.Water and carbon dioxide dissociation
3.2.1. Alkaline electrolysis. Conversion technology currently employed in P2G
Fig. 8. – Process flow of a hybrid energy system: Surplus wind electricity powers the electric converters to split water and CO2. Water and CO2 is split by two parallel routes: SOEC co-electrolysis and plasmolysis; CO and H2 produced are separated into Syngas. Feedstock CO2 is captured directly from air and water is purified. Methanation produces methane to feed into the existing gas grid.
3.2.2. PEM electrolysers are based on proton conducting Polymer Electrolyte
Mem-branes (PEM) close coupled to the electrodes. PEM is at the pre-commercial stage and, in comparison with alkaline electrolysers, offer higher power flow density (∼1 W/cm2) and higher energy efficiency allowing more compact mechanical lay-out and up-scaling to MW level. Disadvantages include degradation, life time and cost of polymer membranes and porous electrodes. The cathode employs Pt as a catalyst which is a scarce material and therefore not well suited for application in a sustainable energy system.
3.2.3. Solid oxygen electrolyser cellsoffer higher-energy efficiency, power density and
in one step [26]. SOEC operates at high temperature (700–800◦C) and therefore oper-ates with gas rather than liquid, which eases pumping requirements and avoids bubble clearing tanks. Apart from thermodynamic advantages of high-temperature operation, a low internal resistance ensures high production rates (high current density) at low energy consumption, which are sustained over a wide range of operation conditions.
SOEC is particularly interesting for the case of co-electrolysis of CO2 and H2O [41] since alkaline electrolysis requires high voltage to activate the reaction,i.e.3V to reach a current density of 100 mA/cm2 [42]. The catalyst involved in polymeric electrolysis suffer from CO poisoning. SOEC has demonstrated high efficiency at high current den-sity >1 A/cm2 at voltages of 1.6 V. Increasing the operating pressure to 50 bar allows a more efficient and less energy demanding synthesis gas production, better matched to subsequent pressure requirements for methanation and Fischer-Tropsch. High tempera-ture operation is sometimes seen as an impediment to fast dynamic response. However, leaving the device run idle at constant well-insulated high temperature, avoids thermo-mechanical issues at minimal energy penalty.
3.2.4. Plasmolysis increases power flow by more than an order of magnitude
(45 W/cm2) compared with SOEC. High gas flow rates result in high production rates and hence reduced mechanical lay-out of the reactor. No scarce materials are employed. A plasma allows fast switching (similar to a fluorescent lamp). These features allow up scaling to MW level as indeed pioneered by Russian classified work in the 1960–1970 period [43-45]. Results have not been reproduced in the West. Initial CO2 plasmolysis experiments report high energy efficiency (>50%) combined with high-energy density, rapid start-stop and no use of scarce materials. The key parameter controlling energy efficiency has been identified as the reduced electric field [29].
Plasmolysis favours splitting of CO2 rather than H2O for two reasons. It has to compete with water electrolysis already yielding high energy efficiency (SOEC>80%) and no need for separation of product gases. More fundamentally, plasmolysis of water is less efficient compared with CO2 plasmolysis, with energy efficiencies of 70% to 90% reported for CO2 against<40% for water [43]. Water does not possess a preferentially pumped vibration mode such as the asymmetric stretch mode of CO2. The linear CO2 molecule stretches the oxygen atom away from the CO molecule after being vibrational exited by low-energy electrons with high cross section >10−16cm2 [46] and excited to higher energy overtones by vibrational (V-V) pumping, thereby lowering the activation threshold. The water molecule is tightly packed, has a much lower cross-section for vibrational excitation and a high vibrational-translational (V-T) relaxation rate. This leads to lower energy efficiency for water plasmolysis compared with CO2.
3.3.Gas separation. – Separating syngas from the output gas stream constituents
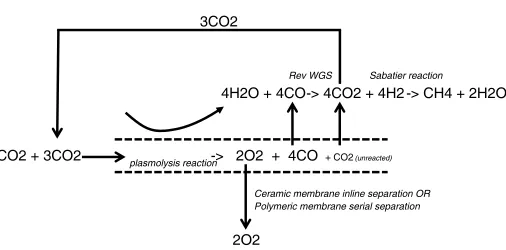
-> 2O2 + 4CO + CO2(unreacted) CO2 + 3CO2 plasmolysis reaction
Rev WGS Sabatier reaction
3CO2
4H2O + 4CO -> 4CO2 + 4H2 -> CH4 + 2H2O
2O2
Ceramic membrane inline separation OR Polymeric membrane serial separation
Fig. 9. – The sequence of O2 and CO2 separation from CO in the plasmolysis process followed by the reverse water-gas-shift reaction to produce syngas (source: Z Bornemann Tech Univ. Twente, NL).
dual-phase carbonate-based membranes and electrochemical oxygen pumps. The O2and CO2 gas separation steps needed for plasma conversion of CO2 are illustrated schemati-cally in fig. 9.
3.4.Carbon capture. – Recently, low cost carbon capture agents based on ionic solids
have been shown to exhibit high activity and selectivity [52-54]. Rather than absorption by amine based liquids, the process depends on adsorption by solids. Because they are based on a combination of anion and cation, these ionic solids can be carefully tuned to meet demands. These novel materials operate under an isothermal pressure swing cycle, rather than raising the temperature to release CO2 after capture which is energy intensive. The process will capture CO2from the atmosphere at elevated pressure under forced air flow and then release the gas through pressure reduction. At the present time related materials have been used to capture and concentrate CO2 from 12.5% simulated flue gas streams at 15 bar and release at atmospheric pressure. Scaling calculations suggest that at a 90% capture efficiency 1 kg of adsorbent in a parallel packed bed reactor will be capable of capturing up to 2 tonne CO2 per day.
Cost of CO2 capture is estimated at ¤40/tonne from point source emission and
¤400/tonne directly from air [55]. Comparing this cost with H2 generation by electrol-ysis, which costs>¤6/kg H2(excluding conventional steam reformation cost<1¤/kg H2, because methane from fossil origin is used and therefore not CO2-neutral), it shows that costs for direct air capture are an order of magnitude lower than costs for hydrogen production, hence carbon capture is no cost driver at system level.
3.5.Methanation. – Producing methane from synthesis gas is a well-established
Working at low temperatures would need a more active catalyst. A Ni-Ce tandem nano-structured catalyst is currently under investigation operating at T = 150–250 C, p= 10–30 bar [57,58]. In order to limit material requirements, ceria should be distributed on the surface of nickel rather than the support and act as a physical barrier to restrain growth of nickel nanoparticles during the process of reduction and reaction conditions at elevated pressure and temperature.
The presence of electrostatic interactions and selective deposition is key to the precipitation-deposition method [58]. The proper distribution of ceria on nickel en-hances the promotion effects of ceria, which can lead to excellent catalytic performance and stability for CO and CO2 methanation. The use of proper tandem nanoparticles of nickel-ceria is more efficient than conventional catalysts, and as a result, less material is needed reducing in this way the capital expenditure.
4. – Plasmolysis
4.1.Non-equilibrium thermodynamics. – Key to achieving high energy efficiency in
dis-sociating CO2, according to Russian theoretical and experimental work [43-45], is to chan-nel energy available in only one out of nine degrees of freedom, the asymmetric stretch mode, thereby creating a thermodynamic non-equilibrium condition between vibration and translational/rotational energy distribution of the molecule. This asymmetric vibra-tion mode, with fundamental at energy hν = 0.29 eV (λ= 4.24–4.28μm) is excited by low-energy electrons (0.4 <eV<2 eV) at high rate coefficient∼10−8cm3/s [46]. The symmetric and bend modes have lower cross section in this energy range. Direct electron impact dissociation requires much higher energy, whilst dissociative electron attachment has a lower rate coefficient at this energy. In order to get to the dissociation threshold energy, the energy of one CO2molecule is raised by vibrational-vibrational (V-V) molec-ular energy exchange, a ratchet mechanism for raising the energy of one CO2molecule at the expense of many others. The loss of vibration energy by vibration-translation (V-T) energy relaxation is low at low translation temperature [43], which is the case for the non-equilibrium state.
The reaction proceeds in two steps, starting with CO2in the1Σ+ground state, excited by electron impact to low level vibrational energy:
CO2∗(1Σ+)−→CO2∗(1B2)−→CO2∗(3B2)−→CO(1Σ+) + O(3P), (1)
ΔH = 5.451 eV net enthalpy.
Here the higher CO2 vibronic energy level1B2 is reached by molecular V-V relaxation. Activation energy is lowered by a non-adiabatic singlet1B2to triplet3B2spin transition. This happens at the point where energy level and molecular distance of the O=CO bond coincide. It allows molecular break-up at minimum 5.5 eV energy, leaving CO and O formed in the ground electronic state.
recombination of atomic oxygen into molecular oxygen at 5.2 eV:
(2) O + CO2−→CO + O2, ΔH = 0.3 eV net enthalpy.
The three-body recombination reaction of atomic oxygen to O2has a much lower rate coefficient as compared with the reaction with CO2[59]. The two reactions in succession yield a net enthalpy for the production of one CO molecule H = 5.8/2 = 2.9 eV, the limiting stage being reaction (1).
4.2.Reduced electric field. – Electrons gain energy by the applied electric field and are
scattered by CO2molecules that can be considered stationary (Lorentzian gas). A steady state electron drift sets up with velocityvDproportional to the applied electric field with proportionality constantμe, the electron mobility. The velocity acquired between colli-sions isvD= (eE/me)τen, whereτen= (n0σenvD)−1 is the collision time. Combination yields the energyUegained by electrons in between collisions
(3) Ue= 1
2mevD
2= eE 2n0σen =
1 2eEλen,
where λen is the electron-neutral mean free path. This expression yields a relation be-tween electron energy and the reduced electric field:
(4) Ue= e
2σen
E n0
.
This expression permits calculation of the reduced electric field for given electron energy. For example, the cross section for vibrational excitation of the CO2 asymmetric stretch mode peaks at an electron energy of 0.4 eV where the cross section is σen = 1.8× 10⁻¹⁶cm2 [46]. Substitution yields E/n0 = 1.4×10⁻¹⁶V cm2 for the reduced electric field value, where vibrational excitation by electrons is maximum. This value corresponds well with Russian theory [43].
Through collisions the electrons randomise and could thus be assigned a temperature albeit not Maxwellian. SinceUe= (3/2)kTethe expression for the reduced electric field yields
(5) kTe= e
3σen
E n0
.
4.3. Energy efficiency. – The energy efficiency η for CO2 splitting is defined as the energy ECO required to produce one CO molecule output over the minimum enthalpy H required,η=H/ECO. The energyEv required per incoming CO2 molecule relates to energyECOper CO molecule produced through the conversion factorα=Ev/ECO. The value ofEv is amenable to measurement through power inputW over input flow rateF according to:
(6) η=CF/W =αH/Ev.
HereC is a constant of numerical factors. The conversion factorαis determined exper-imentally from mass analysis of the exit gas stream.
4.4.Plasma balance. – Equating production and loss, the steady state particle balance
yields:
(7) 2vB=noσionvr≈
E
n,
wherevB =(2kTe/mi) is the Bohm velocity of ions crossing the plasma wall sheath,no the neutral density,σionvthe ionisation rate averaged over electron velocity distribution and r the discharge radius. The ionisation rate is determined by the reduced electric field through eq. (5). This expression shows the plasma discharge radius to contract with increasing gas pressure. This phenomenon has been confirmed experimentally.
Put differently, the loss of the plasma can be expressed in a plasma electron contain-ment timeτe:
(8)
E n0
τe≈r.
Hence, increasing electron containment - which is good because ionisation is energetically expensive - must lower the reduced electric field and thereby increase energy efficiency.
The energy balance yields an expression for the electron densityne:
(9) PRF=neΣinoσivΔεiV,
where σi represents vibration, excitation and ionisation cross sections causing electron energy loss Δεi, V is the volume of the discharge. The above equations yield basic gas discharge parameters. Typically, plasma density is in the range 1012–1013cm−3, ionisation degree 10−6to 10−5 and electron temperature in the range 1–10 eV.
4.5. Vortex flow. – Gas is injected tangentially at the entrance of the cylindrical
of typically 106g. This type of flow has been exploited in the Ranque-Hilsch cooling machine [63, 64]. In our case these effects may be adding to the stability of the plasma discharge, but quantitatively the pressure and temperature gradients are not large.
More important is the axial flow directed through a nozzle after which the gas expands and cools. When the exit pressure is low enough this flow reaches a maximum, called choked flow. Under this condition, in the throat of the nozzle, the gas velocity reaches the speed of sound MachM = 1. Beyond, the velocity increases and becomes supersonic at the exit of the reaction chamber where shock waves form.
The gas flow is governed by the Bernoulli equation, which expresses conservation of energy density along the flow lines. When applied at the exit, this allows calculation of mass flowF =ρeveAe for a certain exit areaAe and pressurepe and at a certain Mach numberMein terms of input pressure and enthalpy:
M2 e =
2 γ−1
p
o pe
γ−1
γ −1
and (10)
F = γpo (γ−1)hoMe
1 + 1
2(γ−1)M 2 e
− γ+1
2(γ−1)
Ae,
whereγ=Cp/Cvis the adiabatic index (γ= 1.22 for CO2) andho=CpTothe stagnation enthalpy which is a conserved quantity along the streamlines of the flow.
4.6.Plasma sources. – Several types of plasma source have been explored [44]
includ-ing glow, hollow cathode and arc discharges, beam-plasma discharge includinclud-ing relativistic electron beam (REB), gliding arc, direct barrier discharge (DBD) and various types of RF source [45]. An arc yields a thermal plasma not providing the desired thermodynamic non-equilibrium condition. DBD, hollow cathode, glow discharge and REB are charac-terised by a too high reduced electric field channelling energy in electronic states not effective in dissociation. RF discharges include electron cyclotron resonance, inductive RF and microwave discharge. The latter yields the desired reduced electric field value in combination with effective ionisation.
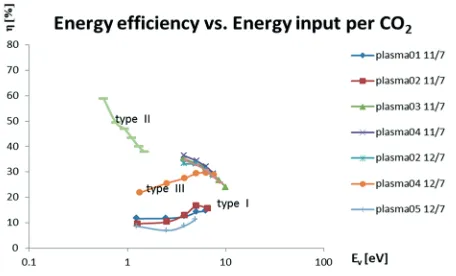
Fig. 10. – Energy efficiencyηfor CO production increases by lowering energyEvper incoming molecule CO2.
4.7.Experimental results. – Initial CO2plasmolysis experiments are conducted at the
IGVP Stuttgart plasma facility [60, 61]. Gas composition measurements are based on quadrupole mass spectrometry (QMS) and optical emission spectroscopy (OES) of CO. The CO2 gas flow is injected tangentially at the entrance of the reaction chamber, which consists of a cylindrical quartz flow tube (length 124 mm and dia. 26 mm) placed on axis of the cavity. Gas pressure is measured at the entrance and the exit of the reaction chamber. Three types of discharge have been investigated at constant input CO2 gas flow rate of 11.1 slm:
Type-I gas expansion nozzle dia. 10 mm is placed at the entrance of the cavity
ex-panding the gas into the discharge. Typical gas pressure 1 mbar is characterised by high E/n ∼ 100×10−16Vcm2. Typical energy efficiency η = 15% is found constant with power and particle conversionαincreases linearly with power. OES shows dominance of 3rd and 4th positive CO bands to increase linear with power.
Type-II gas expansion nozzle is placed at the exit of the cavity freely expanding the
converted gas stream. The high pressure 200 mbar gas discharge is characterised by low E/n ∼ 10−16V cm2. The discharge diameter contracts with higher pressure in accord with eq. (7). Typical energy efficiency η = 35% increases by reducing power. Particle conversion increases with power from 10% upward. The OES is dominated by the CO Angstrom and CO Triplet system, whilst the Swan system reveals carbon.
Type-III exit nozzle diameter has been increased in steps from 5 mm, to 10 mm, to
26 mm dia. This type of discharge is characterised by an intermediate reduced electric field regimeE/n∼10×10−16V cm2. Intermediate energy efficiencies result.
Fig. 11. – Top: Lowering the reduced electric fieldE/n is key to increased energy efficiencyη but, Bottom: goes at the expense of the conversion fractionα, consistent withEvvalues below the dissociation energy.
The E field has been calculated by Comsol Multiphysics simulation program [61]. The vacuum field strength on axis of the cavity isE[ V/cm] = 4.965√PRF[W]. Since the microwave frequency is much lower than the cut-off plasma frequency, power is absorbed by e-n collisions in the plasma. At the plasma density considered the E-field skin depth still penetrates the plasma on axis, albeit at reduced strength [62]. This aspect has been ignored in theE estimate.
The particle density has been estimated by assumingM = 1 flow at the nozzle, i.e.
flow velocity equals sound velocity scaling as √T. As a consequence, at constant flow the gas density scales n∼1/√T. The pressure is seen to increase linearly with power; hence gas temperatureT increases with power.
This result is consistent with eq. (6) and is tantamount to saying that available energy per input CO2 molecule needs to be concentrated in one out of many CO2 molecules in order to accumulate sufficient energy to attain the net 2.9 eV dissociation energy.
5. – Conclusions
CO2-neutral fuels provide a sustainable energy source based on synthetic hydrocar-bons, sustainable through recycling of the CO2 contained in the system. It takes advan-tage of existing infrastructure for energy storage, transport, distribution and use whilst combating climate change by employing renewable energy to power the system. The main challenge is economic viability of synthetic fuels produced. Economic viability heavily depends on the price of CO2, currently set at too low value by the Emission Trading Scheme (ETS) and on carbon taxation enforcing the UN “polluter pays” principle. In-novation in CO2 conversion (P2G) and direct air capture (CCU), as presented in this lecture, will be key to economic development of a CO2-neutral energy system. The time scale for development is driven by the time scale of climate change ranging from 30 to 50 years, depending on the energy scenario adopted.
For CO2 plasmolysis, the reduced electric field has been identified as the key pa-rameter explaining and improving the energy efficiency measured. The energy efficiency obtained is similar to electrolysis, but offers advantages in energy density and switching in response to intermittent power with no use of scarce material. A simple model explains the inverse relation between energy efficiency and particle conversion and relates input microwave power to CO2 gas density, plasma dimension and ionisation degree, allowing design parameters for a 100 kW demo reactor to be specified.
∗ ∗ ∗
REFERENCES
[1] Petit T.et al.,Nature,399(1999) 429.
[2] Goede A. P. H.et al., EPS Position Paper “Energy and Environment, the intimate link” EPS (2008).
[3] Goede A. P. H.et al.,Adv. Space Res.,11(1991) 243.
[4] Schneising, Buchwitz Burrowset al.,Atmos. Chem. Phys.,11(2011) 2863. [5] Dils B.et al.,Atmos. Meas. Tech.,7(2014) 1723.
[6] Stern N.,Stern Review on The Economics of Climate Change (HM Treasury, London) 2006.
[7] The Economist August 3rd, 11 (2013).
[8] Kosaka YuandXie S.-P.,Nature,501(2013) . [9] ChenandTung, Science (2014).
[10] IPCC Fifth Assessment Report, The Physical Science Basis, September (2013).
[11] Mora et al.,Nature,502 (2013) 183; see alsoStocker Th. et al., Nature, 499(2013) 160.
[12] Netherlands Environmental Assessment Agency, 2013 Report, ISBN 978-94-91506-51-2.
[13] Searchinger T. et al.,Science,319, no. 5867 (2008) 1238;van Noorden R.,Nature, 499(2013) 13.
[14] Fairley P.,Nature,474(2011) S2. [15] Peplow M.,Nature,507(2014) 152.
[16] The Economist, Technology Quarterly, September 7rd, 16 (2013). [17] Krieger K.,Nature,508(2014) 448.
[18] Thapper A.et al.,Green,3(1)(2013) 43. [19] Chen X.et al.,Science,331(2011) 746. [20] Roy S. C.et al.,ASC Nano,4(2010) 1259. [21] Chueh W. C.et al.,Science,330(2010) 1797. [22] Behrens M.et al.,Science,336(2012) 893. [23] Graciani J.et al.,Science,345(2014) 546. [24] Nzihou A.,Energy,42(2012) 121.
[25] Haije W.andGeerlings H.,Environ. Sci. Technol.,45(2011) 8609.
[26] Jensen S. H., Sun X., Ebbesen S. D., Knibbe R.andMogensen M.,Int. J. Hydrogen Energy,35(2010) 9544.
[27] Donglin Hanet al.,Solid State Ionics,181(2010) 1601. [28] Kui Xieet al.,Energy Environ. Sci.,4(2011) 2218.
[29] Goede A. P. H.et al.,EPJ Web of Conference,79(2014) 01005, DOI:10.1051/epjconf/20147901005.
[30] Boldiˇs Z.,Eur. Phys. News,44/4(2013) 16.
[31] Diaz F., Int. Workshop Energy Storage in the Grid, Barcelona (2014), private communication, seehttp://www.irec.cat/en/contact/francisco-diaz.html
[32] Bobin J.-L.,Eur. Phys. News,44(2013) 4. [33] Wagner F.,Eur. Phys. J. Plus,129(2014) 20.
[34] Weitemeyer S.et al.,EPJ Web of Conferences,79(00001) 2014. [35] Grond L. J.et al., DNV-KEMA report GCS 13.R.23579 (2013), see
www.energeia.nl/docs/P2G ECN 2014.pdf
[36] http://www.ease-storage.eu/tl files/ease-documents/Stakeholders/ES%20Roadmap%202030 /EASE-EERA%20ES%20Tech%20Dev%20Roadmap%202030%20Final%202013.03.11.pdf
[39] Gigler J.et al., Roadmap Power to Gas (2014), see
http://www.provinciegroningen.nl/fileadmin/user upload/Documenten/Brief/2014-12171bijlage.pdf
[40] Janssen A.et al.,http://www.edgar-program.com/$1223, ISSN 2213-6169. [41] Zhan Z.et al.,Energ. Fuel,23(2009) 3089.
[42] Gattrell M.et al.,Energ. Convers. Manag.,48(2007) 1255.
[43] Rusanov V. D., Fridman A. A.andSholin G. V.,Usp. Fiz. Nauk.,134(1981) 185. [44] Fridman A. A.,Plasma Chemistry(Cambridge) 2008, ISBN-13 978-0-511-39857-5. [45] Azizov R. I.et al.,Sov. Phys. Dokl.,28(7)(1983) 567.
[46] Itikawa Y.,J. Phys Chem. Ref. Data,31(2002) 749.
[47] Wang Y., Hu B., Zhu Z., Bouwmeester H. J. M.andXia C. R.,J. Mater. Chem. A, 2(2014) 136.
[48] Reijerkerk S. R., Wessling MatthiasandNijmeijer Kitt,J. Memb. Sci.,378(2011) 479.
[49] Shahid S.andKitty Nijmeijer,J. Memb. Sci.,459(2014) 33.
[50] Qi H., Han J., Xu N.andBouwmeester H. J. M.,Chem. Sus. Chem.,3(2010) 1375. [51] Chen W., Chen C. S., Bouwmeester H. J. M., Nijmeijer A.andWinnubst A. J. A.,
J. Membr. Sci.,463(2014) 166.
[52] Supatitmongkol S.andStyring P.,Energy & Env. Sci.,3(2010) 1961. [53] Armstrong K., Dowson G.andStyring P.,Catal. Rev.,26(2)(2013) 6. [54] Supasitmongkol S.andStyring P.,Catal. Sci. Technol.,4(2014) 1622. [55] Socolow R., Desmond M.et al.,APS Physics Report, June (2011),
www.aps.org/policy/reports/assessments/.../dac2011
[56] Bedel L.et al.,http://www.ceops-project.eu/simplenews/first-results.
[57] Almar L., Andreu T., Morata A., Torrell M., Yedra L., Estrad´e S., Peir´o F. andTaranc´on A.,J. Mater. Chem. A,2(2014) 3134.
[58] Epifani M., Andreu T., Abdollahzadeh-Ghom S., Arbiol J. andMorante J. R., Adv. Func. Mater,22(2012) 2867.
[59] Hadj-Zianeet al.,J. Phys. D., Appl. Phys.,25(1992) 677.
[60] Leins M.et al.,31th Int. Conf. Phen. in Ionized Gases, Granada (2013). [61] Leins M., Thesis Ch 2.3.2 (2010), Universit¨at Stuttgart.
[62] Gaiser S., private communication.
[63] Liew R., Zeegers J. C. H., Kuerten J. G. M.andMichalek W. R.,Phys. Rev. Lett., 109(2012) 054503.
![Fig. 1. – CO2precision of about 2.5 ppm [4]. The Japanese space instrument TANSO on GOSAT extends theSCIAMCHY dataset from 2009 onward](https://thumb-us.123doks.com/thumbv2/123dok_us/8172326.1364585/3.482.137.343.67.202/precision-japanese-instrument-tanso-gosat-extends-thesciamchy-dataset.webp)
![Fig. 2. – a) Direct conversion of sunlight into hydrocarbons [19-24]. b) Indirect conversion ofrenewable energy into hydrocarbons through electricity production.](https://thumb-us.123doks.com/thumbv2/123dok_us/8172326.1364585/6.482.112.369.66.382/conversion-hydrocarbons-indirect-conversion-ofrenewable-hydrocarbons-electricity-production.webp)

![Fig. 4. – Volumetric energy density of gaseous and liquid hydrocarbons. Source EERA [36].](https://thumb-us.123doks.com/thumbv2/123dok_us/8172326.1364585/9.482.129.350.74.208/volumetric-energy-density-gaseous-liquid-hydrocarbons-source-eera.webp)


![Fig. 7. – Residual Load [GW] of the electricity grid plotted against hours of the year (8760 hrs)with specific power load demand](https://thumb-us.123doks.com/thumbv2/123dok_us/8172326.1364585/13.482.110.372.69.247/residual-load-electricity-plotted-hours-specic-power-demand.webp)