Dynamic Modeling and Fuzzy Control for Solid
Oxide Fuel Cell (SOFC)
Neethu Mary1, Clint Augustine2, Shiny Joseph3, Sonsy Heartson4
M.Tech, Dept. of EIE, Vimal Jyothi Engineering College, Kannur, India1
Assistant Professor, Dept. of EIE, Vimal Jyothi Engineering College, Kannur, India 2
Associate Professor, Dept of Chemical Engineering, NIT, Calicut, India3
PhD Scholar, Dept of Chemical Engineering, NIT, Calicut, India4
ABSTRACT: Fuel cell systems offer clean and efficient energy production and are currently under intensive development by several manufacturers for both stationary and mobile applications. It is an electrochemical device that converts the chemical energy of gaseous fuel directly into electricity. This paper deals with the current status and control research on SOFC technologies. Later, the transfer function of the fuel cell is derived by integrating the electrochemical cell reactions. The derived model includes the effect of activation, concentration and ohmic losses on the dynamic performance of SOFC. Within acceptable limits, the effect of Power demand variation on output voltage and real power output are investigated by using different controllers.
KEYWORDS: SOFC, PID, FUZZY Controller.
I.INTRODUCTION
Fuel cells convert the chemical energy of gaseous fuel directly into electricity by the electrochemical combination of a fuel with an oxidant. Absolutely harmless water is received as by-product ie., it is low to zero emissions. Fuel cells feature the potential for high efficiency (35-60%), quiet operation and high reliability due to the limited number of moving parts. They produce power electrochemically by passing a hydrogen-rich gas over an anode and air over a cathode, and introducing an electrolyte in between to enable exchange of ions. The effectiveness of the fuel cell depends on the type of electrolyte employed. Based on the type of electrolyte fuel cells are categorized as Polymer electrolyte fuel cell (PEFC), Alkaline fuel cell (AFC), Phosphoric acid fuel cell (PAFC), Molten carbonate fuel cell (MCFC) and Solid Oxide Fuel Cell (SOFC). Today, PAFCs have been successfully commercialized. The 200 kW PAFC on-site plant, the PC-25, was one of the first to enter the commercial market. Second generation fuel cells (SOFCs and MCFCs) are entered in the market in 2002. PEFCs are still in the development and testing phase [3]. SOFC is a type of fuel cell that appears to be one of the most promising fuel cell systems. Similar to other type of fuel cells, SOFC requires the fuel such as hydrogen, and oxidant reactants such as oxygen or air to electronically react at high temperature and generate electrical energy. Hydrogen is normally used as the fuel since it has high electrochemical activity, but carbon monoxide can be also used as the fuel together with hydrogen. The direct use of a hydrocarbon gas instead of hydrogen or carbon monoxide is also possible when operated as internal reforming.
and ohmic losses on the dynamic performance of SOFC. Control part is discussed in section III & IV and obtained results are analyzed in V and followed by the conclusion and reference.
II. MATHEMATICAL MODELING
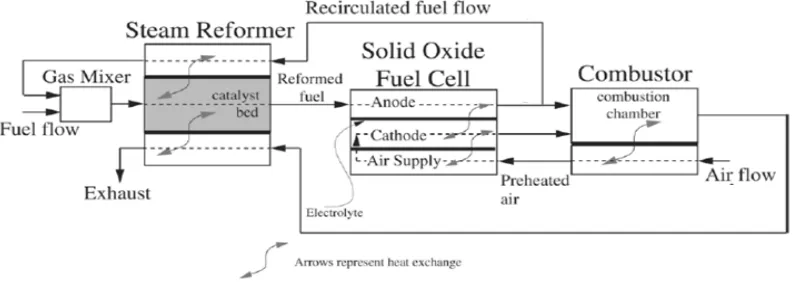
The system consists of three primary components, namely, the steam reformer, the fuel cell stack and the combustor. Methane is chosen as the fuel for the system, with a molar flow rate of . The system is presented in Fig (1). The reformer produces a hydrogen rich gas, which is supplied to the anode of the fuel cell. Electrochemical reactions occurring at the anode due to current draw results in a steam rich gas mixture at its exit. A known fraction of the anode exhaust is recirculated through the reformer into a mixing chamber where fuel is added. The mixing of the two fluid streams and pressurization is achieved in the gas mixer using an ejector or recirculating fuel pump. The steam reforming process occurring in the reformer catalyst bed is an endothermic process. The energy required to sustain the process is supplied from two sources, namely, the combustor exhaust that is passed through the reformer from two sources, namely, the combustor exhaust that is passed through the reformer and the aforementioned recirculated anode flow as shown in Fig. (1). The remaining anode exhaust is mixed with the cathode air, which has a molar flow rate of . The tubular construction of each cell causes the air to first enter the cell through the air supply tube and then reverse its direction to enter the cathode chamber. For steam reforming of methane, we consider a packed-bed tubular reformer with nickel-alumina catalyst.
Fig. (1) Schematic diagram of SOFC system. The three main reactions in steam reforming of methane are:
+ => + 3
+ => +
+ 2 => + 4
Internal reforming reactions occur in the anode due to high temperatures and the presence of nickel catalyst. The primary electrochemical process is
At Anode:
2 + 2 => 2 + 4
2 + 2 => 2 + 4
At Cathode:
+ 4 => 2
Assuming perfect gas behavior for hydrogen at the anode channel, we have =
Defining
=
Where the derivative is with respect to time (s), we get
=
Splitting the hydrogen molar flow rate into its three components- the input flow rate, the output flow rate, and the flow rate that takes part in the reaction- we have
= ( − − ) (1)
Similarly, for water vapor at the anode channel,
= (0− − ) (2)
Again, the process of oxygen inflow/ outflow/ reaction at the cathode channel is described by
= ( − − ) (3)
From the basic operation of the SOFC we know that four moles of electrons are consumed for each mole of oxygen and two moles of electrons for each mole of hydrogen. Water, however, is produced at the rate of one mole for every two moles of electrons. From electrochemical properties it follows that
=
2 = 2
=
4 =
Assuming that the molar flow of a gas through the valve is proportional to its partial pressure inside the channel, we have
= and =
At the anode, and
=
At the cathode, now, substituting for the output flow rates and reaction flow rates in equations (1) and (2), and taking Laplace transforms, we obtain the following two equations for the anode channel (the transform of f(t) is denoted by F(S)):
( ) = / ( −2 ) (4)
Similarly
( ) = / (2 ) (5)
( ) = / ( − ) (6)
Where
= , = =
The inverse transforms of equations (4)-(6) will yield the time domain expressions for the three partial pressures at
constant molar flow rate and fuel cell stack current is given below:
( ) = 1/ 2 1−exp −
( ) = 1/ − 1−exp −
At steady state condition:
( ) = 1/ −2 (7)
( ) = 1/ 2 (8)
( ) = 1/ − (9)
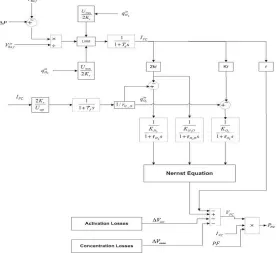
Output voltage
The open circuit emf E, of a stack of cells in series is given by Nernst’s equation:
= + 2 ln
The following types of losses (or voltage drops or irreversibility) are generally considered in the literature:
Activation loss: Activation loss caused by the slowness of the electrochemical reactions taking place on the surface of the electrode
=
∝ ln ,
Where is the electron transfer coefficient, n is the number of electrons (per mole) participating in the reaction, is the current density, and , the exchange current density.
Concentration loss: Concentration loss (or mass transport loss) that results from the change in concentration of the reactants at the surface of the electrodes as the fuel is used:
= ln 1−
,
Where n is the number of moles of electrons transferred per mole, is the current density, and , the limiting current density.
Ohmic loss: Ohmic loss due to the electrical resistance of the electrodes and the electrolyte. This resistance, represented by r, depends upon the stack temperature
= We obtain the steady-state SOFC stack terminal voltage is as:
= − − −
Fuel utilization is the ratio between the fuel flow that reacts and the input fuel flow.
=
Where
=
2 = 2
The ratio of hydrogen to oxygen flow rate is as:
=
III.CONVENTIONAL CONTROLLER
PID (Proportional, Integral and Differential) controller is the most common form of feedback. In PID controller the basic idea is the examination of signals from sensors placed in the system, called feedback signals. PID as one of widely used control approaches has many advantages such as simple control structure, easy design and inexpensive cost etc. The PID controller has been used in different control plants. However it cannot get a good control effect when controlled system is and of higher order. Let’s consider Fig. (3), the above given unity feedback system,
The PID controller is usually implemented as follows:
( ) = ( ) + ∫ ( ) + ( ) (1)
( ) = ( )− ( ) (2)
Wherek ,k, and k are the proportional, the integral, and the derivative gains respectively. The controller output, the process output, and the set point are denoted as u(t),y (t)andy (t) respectively. A proportional controller (k ) will have effect of reducing the rise time, but it never eliminates the steady-state error. An integral controller (k ) will reduce the steady-state error but may make the transient response worse. A derivative controller (k ) will have an effect on stability of the system, it reduces the overshoot, and improving the transient response.To getting the demand power from the system, we first derived the system equation then check its real time response. Then we designed a PID controller to control the close loop function. Ziegler Nichols tuning rule is used to determine the value ofk , kand k which is based on the transient step response of a plant. The obtained final values arek = 961.53,k = 41.25,andk =
987.56nonlinear
Fig. (3): system with PID controller
IV.FUZZY CONTROLLER
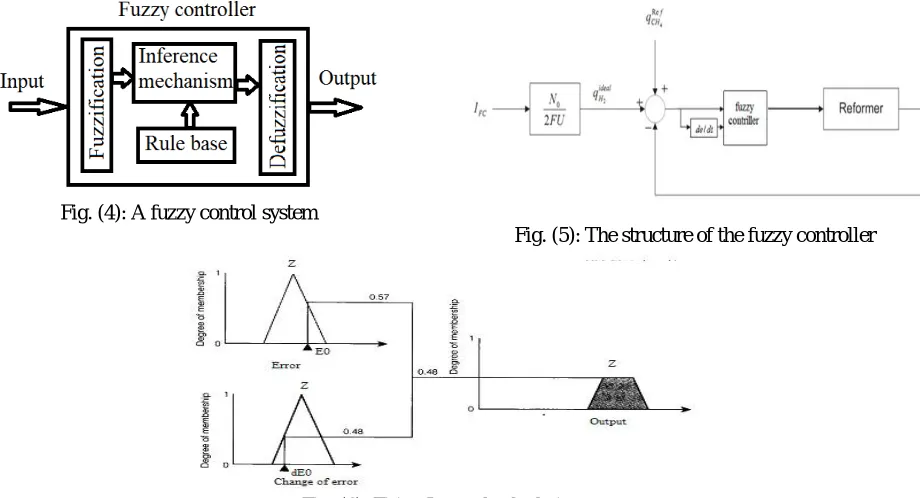
In implementation of fuzzy control, the mathematical model equations of systems are not necessary but the expert knowledge of the system behaviour is required. The performance specifications of the systems such as rise time, overshoot, settling time and error steady state can be improved by using Fuzzy controllers. LotfiZadeh, the father of fuzzy logic is extend two valued logic, defined by the binary pair {0, 1}, to the whole continuous interval [0, 1]. Fuzzy controllers use heuristic information in developing design the control of nonlinear dynamic system. A fuzzy control system is shown in Fig. (4). FLS consist fuzzifier, rules, inference engine and output processor (defuzzifier) and these are interconnected. The fuzzifier converts the crisp value into Fuzzy Sets. It is needed to activate rules that are in terms of linguistic variables. The rules are the heart of an FLS. The rules are expressed as a collection of IF-THEN statements. The IF-part of a rule represents antecedent and the THEN part represents consequent. The fuzzified inputs activate the inference engine and the rule base to produce a Fuzzy Set output. The commonly used inferential procedure is minimum and maximum implication method. Defuzzification is necessary to obtain the crisp number as the output.
Fig. (4): A fuzzy control system
All the rules that have any truth in their premises will fire and contribute to the output fuzzy set - the one that will represent the control variable in the SOFC example is shown in the Fig. (5). Suppose that at given time, t, the system sensors determine the error to be E0 and the change of error to be dE0. As the Fig. (6) shows, dE0 fall into a single
region of the change of error variable-namely Zero (Z). The Error E0 has degree of membership in Zero (Z) region.
This combination cause rule IF error is Zero and change of error is Zero THEN output control signal is Zero. The rule has somehow to be combined to form a system output. The following three-step procedure shows how: (1) For each premise expression connected by an AND, take the minimum of the truth of the expressions as the truth level of the premise. (2) Truncate the output fuzzy set being built at the truth level of the premise. (3) Copy the newly modified fuzzy set into the output variable fuzzy set. If that region is not empty, combine it with the current contents by taking the maximum of the new fuzzy region and the currently existing fuzzy region at each point in the domain.
A DESIGN OF FUZZY CONTROLLER
In fuzzy structure, there are two inputs to fuzzy inference: error ( ) and change of error ( ) and one output and contain 25 rules. The steps for designing aimed controller for the SOFC system are as follows:
a) Select the input and output parameters for the fuzzy controller. Here we choose the error signal and the change of error signal as the input parameters and output parameters for the fuzzy controller as control signal that require for the flow rate of hydrogen fuel flow.
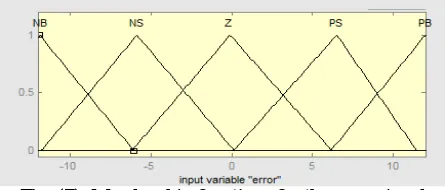
b) Then divide the universe of discourse into FSs. Fig. (7) and (8) show the input membership functions for the error signal and change of error signal respectively. Here the universe of discourse is divided as Negative Big (NB), Negative Small (NS), Zero (Z), Positive Small (PS) and Positive Big (PB). Fig. (9) show, the output membership function for the control signal, whereas the universe of discourses is divided as Negative Big (NB), Negative Small (NS), Zero (Z), Positive Small (PS) and Positive Big (PB).
c) Write the rule base for the Fuzzy controller, based on experience and it is described in the below given Table 1 correspondingly.
d) Use the algorithm of the aimed controller: Centroid defuzzification is the best technique to obtain the crisp output.
The degree of each membership function which was computed in the previous step of fuzzifications encountered by the subprogram called defuzzify and this after certain process it returns defuzzified output.
Fig. (7): Membership functions for the error signal
Fig. (9): Membership functions for the output signal. TABLE 1: RULE BASE FOR THE FORCE
Change of error signal
Error signal
NB NS Z PS PB
NB NB NB NS NS Z
NS NB NS NS Z PS
Z NS NS Z PS PS
PS NS Z PS PS PB
PB Z PS PS PB PB
V. RESULT
The simulation is done for a stand-alone SOFC system, operating with constant rated voltage 1 V and power demand 0.7 Watts. The schematic Simulink diagram is shown Fig (2). All parameters are the same as Table (2). At t=50 s, there is a step increase of power demand from 0.7 to 1.0 Watts.
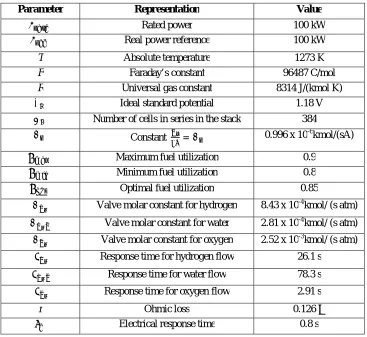
TABLE (2): PARAMETERS IN SOFC SYSTEM MODEL
Parameter Representation Value
Rated power 100 kW
Real power reference 100 kW
T Absolute temperature 1273 K
F Faraday’s constant 96487 C/mol
R Universal gas constant 8314 J/(kmol K)
Ideal standard potential 1.18 V
Number of cells in series in the stack 384
Constant = 0.996 x 10⁻⁶kmol/(sA)
Maximum fuel utilization 0.9
Minimum fuel utilization 0.8
Optimal fuel utilization 0.85
Valve molar constant for hydrogen 8.43 x 10⁻⁴kmol/ (s atm)
Valve molar constant for water 2.81 x 10⁻⁴kmol/ (s atm)
Valve molar constant for oxygen 2.52 x 10⁻³kmol/ (s atm)
Response time for hydrogen flow 26.1 s
Response time for water flow 78.3 s
Fuel processor response time 5 s
Ratio of hydrogen to oxygen 1.145
PF Power factor 1.0
, Exchange current density 20 mA/cm
2
, Limiting current density 900 mA/cm2
A Cell area 1000 cm2
α Charge transfer coefficient 0.5
n number of electrons (per mole); or
sample size in statistical tests
2
A OPEN LOOP RESPONSE
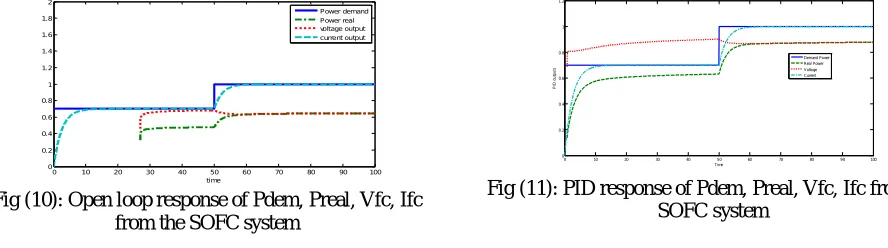
The Fig. (10) shows that the open loop response of Pdem, Preal, Vfc, Ifc (Power demand, Power real, Voltage and current output) from the SOFC system. In the first 50 sec after power demand is increased, power real has a rapid increase due to the fast electrical response time in the fuel cells. Subsequently, power real increases slowly and continuously until reaching below the required power. This is due to the slow chemical response time in the fuel processor. The total response time of power real from 0.4 to 0.6 Watts is about 10s.
Fig (10): Open loop response of Pdem, Preal, Vfc, Ifc from the SOFC system
Fig (11): PID response of Pdem, Preal, Vfc, Ifc from the SOFC system
B PID RESPONSE
The Fig. (11) shows the response of Pdem, Preal, Vfc, Ifc from the SOFC system with a PID controller. In the first 50 sec after power demand is increased, power real(change the name or mention what it means) has a rapid increase due to the short response time of voltage and current in the fuel cells. Subsequently, power real increases slowly and continuously until reaching near the required power. This is due to the slow chemical response time in the fuel processor. The total response time of power real from 0.6 to 0.85 Watts is about 10 s.
C FUZZY RESPONSE
The Fig. (12) shows that the response of fuzzy system in Pdem, Preal, Vfc, Ifc from the SOFC system. In the first 50 sec after power demand is increased, power real has a rapid increase due to the fast response of electrical system in the fuel cells. Subsequently, power real increases slowly and continuously until reaching the required power. This is due to the slow response of chemical system in the fuel processor. The total response time of power real from 0.67 to 0.85 Watts is about 10 s.
0 10 20 30 40 50 60 70 80 90 100
0 0.2 0.4 0.6 0.8 1 1.2 1.4 1.6 1.8 2 time Power demand Power real voltage output current output
Fig (12): Fuzzy response of Pdem, Preal, Vfc, Ifc from the SOFC system
VI. CONCLUSION
In this paper, the SOFC model developed in Matlab/SIMULINK environment is used to simulate the performance of the SOFC fuel cell. The response of the system to step changes in power demand are presented along with the analysis of the simulated results. It has been observed that the fluctuations in the output voltages in the power system due to demand power variations are taken care of by the SOFC (or controller)very closely. The fuel cell system reduces the cost of power generation as well as the level of pollution. The Simulation results are presented for various dynamic characteristics of the Fuel cell system. The total response time of power real from 0.67 to 0.85 Watts is about 10 s in Fuzzy controller and from 0.6 to 0.85 Watts is about 10 s in PID controller. The fuzzy controller can be considered better than PID controllers.( if both are 10 why fuzzy is better).
REFERENCES
1. NavadolLaosiripojanaa, WisitsreeWiyaratnb,WoraponKiatkittipongc, ArnornchaiArpornwichanopd, ApinanSoottitantawat, SuttichaiAssabumrungrat; Reviews On Solid Oxide Fuel Cell Technology; Engineering Journal : Volume 13 ISSUE 1 ISSN 0125-8281 : Acceptance Date, Jan. 2009
2. Y. Zhu, K. Tomsovic; Development of models for analyzing the load-following performance of microturbines and fuel cells; Electric Power Systems Research 62 (2002) 1/11
3. Ruchi Yadav, Gauri Shankar; Modelling and Simulation of Solid Oxide Fuel Cell; 2014 International Conference On Computation Of Power, Energy, Information And Communication (ICCPEIC)
4. TVVS Lakshmi, P Geethanjali and Krishna Prasad S; Mathematical modelling of solid oxide fuel cell using Matlab/Simulink; International Conference on Microelectronics, Communication and Renewable Energy (ICMiCR-2013)
5. Y. H. Li, S. S. Choi; An Analysis of the Control and Operation of a Solid Oxide Fuel-Cell Power Plant in an Isolated System; IEEE Transactions On Energy Conversion, VOL. 20, NO. 2, JUNE 2005
6. N. Prema Kumar, K. Nirmala Kumari, K.M.Rosalina; Modeling Design of Solid Oxide Fuel Cell Power System for Distributed Generation Applications; International Journal of Advanced Research in Computer Engineering & Technology (IJARCET) Volume 1, Issue 9, November 2012
7. Jaime Arriagada, Pernilla Olausson, AzraSelimovic; Artificial neural network simulator for SOFC performance prediction; Journal of Power
Sources 112 (2002) 54–60
8. Uday Kumar Chakraborty; Static and dynamic modeling of solid oxide fuel cell using genetic programming; Energy 34 (2009) 740–751
0 10 20 30 40 50 60 70 80 90 100
0 0.2 0.4 0.6 0.8 1 1.2 1.4 1.6 1.8
Time
F
u
z
z
y
o
utp
u
ts