Review on Soil Classification Methods
Sneha Pethkar1, S.V.Phakade2
PG Student, Department of E&TC Engineering P.V.P.I.T Budhgaon, Maharashtra, India1 Associate Professor, Department of E&TC Engineering P.V.P.I.T Budhgaon, Maharashtra, India2
ABSTRACT: In a number of Engineering problems, e.g. in geotechnics, petroleum engineering, etc., standard soil classification methods could be inadequate. In previous Classification methods there is requirement of an expert who observes the magnitude and trends of the signals in addition to any a priori information that might be available. In this paper an approach for automating this classification procedure is presented. There are methods available such as segmentation algorithm from which the salient features of these segments are extracted using boundary energy method. Based on the measured data and extracted features classifiers assign classes to the segments. They employ Decision Trees, ANNs and Support Vector Machines. In this firstfeatures extraction methods of image processing is applied to extract the features of soil sample images.Then database of sample images will be prepared and classification of soilwill be done Using SVM(Support Vector Machine) algorithm
KEYWORDS: Cone penetration test, CONCC, Image Processing, support vector machine.
I. INTRODUCTION
There is a necessity to classify contiguous intervals (segments) of series data (signals) in a number of engineering problems. Series data has an additional index variable (distance or time) associated with each data value. In standard classification algorithms these situations are often inadequate due to the additional contiguity constraint. Examples are from the following domains: classification of sub-soil layers using Cone Penetration Testing [2], in petroleum engineering , palaeoecology , etc. In these cases measurements are taken from a vertical bore oremploying test apparatus that is pushed down the earth and stratigraphical information is preserved in the classification. The problem is solved in two phases: firstly, a segmentation algorithm is utilize to cluster contiguous blocks of instances and then, these segments are classified by domain experts. To automating classification of soil layers from measured data is important. In civil engineering it is a prerequisite to know the soil classes up to some depths prior to any construction. The direct method to identify the soil classes by drilling boreholes and testing soil samples is very expensive. A cheaper alternative is the so-called Cone Penetration Testing (CPT). CPT is one of the most popular soil investigation methods [2] . But all these methods require manual data of soil samples and for classification using expert advice is difficult and expensive also. Different results also occurred due to different expert give result as per their knowledge . For these difficulties or to remove this limitations algorithm can be formed which work efficiently. Which is based on image processing.
II. LITERATURE SURVEY
1. CONE PENETRATION TEST
2. CONCC (Constraint Clustering and Classification)
CONCC (Constraint Clustering and Classification) can be used in automatic classification with the constraint of contiguity and includes the following two steps:
- Segmentation: to find J segments of data from a single series data (e.g. CPT);
- Classification: to build a classifier to assign classes to these segments; it is built using measured data and extracted features from segments from a number of series data from a region and trained with classes labelled by experts. This method presents classification of the found segments using three Machine Learning (ML) methodsi.e Decision Tress (DT), ANNs and Support Vector Machines (SVM).
2.1SEGMENTATION
The CONCC algorithm addresses the shortcomings of the existing segmentation algorithms. It uses fuzzy logic to address the imprecision in the measured data and uses a particular threshold-based distance measure between instances and segment centres. Initial tests of the CONCC algorithm were performed and the satisfactory performancewas achieved . This method presents the classification ofthe segments found by the CONCC algorithm. However, segments found by any other suitable segmentation algorithm, including the manual segmentation procedure of
experts, can be classified using the presented approach as well.
2.2FEATURE EXTRACTION USING BOUNDARY ENERGY
After the segments are found the following task is to assign classes to the segments. However, for different locations the mapping could be different due to the spatial variability. When data from several test locations are combined an overlap of instances of different classes is usually observed. The spatial variability has several reasons such as site-specific conditions, location and depth, measuring instruments, etc. To solve the problem it needs to be brought to a higher dimension by bringing in additional features so that a partition of the input space is possible by a classifier for assigning a class to that subset of inputs. In engineering, experts use subjective criteria, so the automated classification methods should select appropriate features and be compatible with experts. During this research several experts in geology were interviewed and their manual classification procedures were recorded. It was observed that the experts assign high importance to the shape, in addition to the magnitude of the data. This led us to conclude that in automating the classification procedure experts' perception about the shape of signals needed to beparameterized. Shapes of signals can be represented using multi-scale transforms such as Fourier transform, w-representation using Marr wavelet and Morlet wavelet, Gabor transform etc. [3]. These representations can be used to derive shape measures using multi-scale energy methods such as boundary energy, multi-scale wavelet energy, etc. In this method the boundary energy has been used in parameterizing the shape effects.
A. BOUNDARY ENERGY
Boundary energy is defined as the amount of energy required to modify the shape of a contour to its lowest energy level (a circle), with the same perimeter as the original object. The concept of boundary energy originatedfrom the theory of elasticity and was first applied in biological shape characterization [5]. Since then it has been widely used as a global shape measure for classification of a variety of shapes. Boundary energy is defined as follows:
Ba,k= ∑ ( , )2
where Ba,kdenotes the boundary energy of a signal at scale along the dimension k, c is the curvature at point n, n = 1,
III. PROPOSED METHODOLOGY AND DISCUSSION
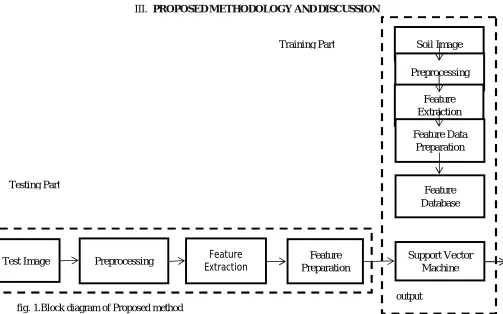
output fig. 1.Block diagram of Proposed method
In this method two parts important. First part is training part. In which database formation is important work .Second one is testing part. In which actual classification takes place.
1.Training Part
In training part, first part is to collect different types of soil sample picture. Then preprocesses apply on that soil images. Then develop an algorithm to extract the features of soil sample images using features extraction methods ,likeHsvhistogram ,Color moments-mean sd, Gabor features ,Colour auto correlogram. Then develop database with feature preparation of sample images. Develop an SVM algorithm for deciding class.
2.Testing Part
For testing purpose select any soil sample image. Which will undergoes processes like preprocessing ,Feature extraction, feature preparation. Develop an SVMalgorithm to find class of soil. Implementation of algorithm may be by using MATLAB.
In training and testing part following procedure is followed
A.Soil Image: Different types of soil samples are available. For example Peat ,Sandy soil, clay etc.
B.Preprocessing: In this section enhancement like processes carried out. Which will help for feature extraction process.
a.Enhancement
Image enhancement is the process of adjusting digital images so that the results are more suitable for display or further image analysis. We can use enhancement process to remove noise, sharpen, or brighten an image, making it easier to identify key features.
Soil Image
Preprocessing
Feature Extraction
Feature Data Preparation
Feature Database
Support Vector Machine Feature
Extraction
Feature Preparation Preprocessing
Test Image
Training Part
Testing Part
In computer graphics, the process of improving the quality of a digitally stored image by manipulating the image with software. It is easyprocesses , like to make an image lighter or darker, or to increase or decrease contrast. Advanced image enhancement software also supports many filters for altering images in various ways. Programs specialized for image enhancement are sometimes called image editors.This processing helps in maximizing clarity, sharpness and details of features of interest towards in format extraction and further analysis The objective of image enhancement is to process a given image so that the result is more suitable than the original image for a specific application. It sharpens image features such as edges, boundaries, or contrast to make a graphic display more helpful for display and analysis. The enhancement doesn't increase the inherent information content of the data, but it increases the dynamic range of the chosen features so that they can be detected easily.
Methods for enhancement is divided into two category. 1.Spacial domain method
2.Frequency domain method
a.1 Spatial domain methods
Spatial Domain isAggregate of pixels composing an image. Spatial Domain Methods equal to procedures that operate directly on these pixels, denoted by g(x,y)=T[f(x,y)], T Operator on Image f(x,y) Processed Image. g(x,y) is output Image, T can also operate on a set of Images.
Examples are Negation, Contrast stretching , Gray level slicing.
a.2 Frequency domain methods
Image enhancement in the frequency domain is straightforward. Here simply compute the Fourier transform of the image to be enhanced, multiply the result by a filter (rather than convolve in the spatial domain), and take the inverse transform to produce the enhanced image.The idea of blurring an image by reducing its high frequency components, or sharpening an image by increasing the magnitude of its high frequency components is intuitively easy to understand. However, computationally, it is often more efficient to implement these operations as convolutions by small spatial filters in the spatial domain. Understanding frequency domain concepts is important, and leads to enhancement techniques that might not have been thought of by restricting attention to the spatial domain.Examples are Low pass filter ,High pass filter
C.Feature Extraction
In this section features extraction methods ,likeHsvhistogram ,Color moments-mean sd, Gabor features ,Colour auto correlogram will use to extract features of soil.
C.1. HSV-Histogram
In image processingand photography, a color histogram is a representation of the distribution of colors in an image. For digital images, a color histogram represents the number of pixelsthat have colors in each of a fixed list of color ranges, that span the image's color space, the set of all possible colors.
The color histogram can be built for any kind of color space, although the term is more often used for three-dimensional spaces like RGB or HSV. For monochromatic images, the term intensity histogram may be used instead. For multi-spectral images, where each pixel is represented by an arbitrary number of measurements (for example, beyond the three measurements in RGB), the color histogram is N-dimensional, with N being the number of measurements taken. Each measurement has its own wavelength range of the light spectrum, some of which may be outside the visible spectrum.
Like other kinds of histograms, the color histogram is a statistic that can be viewed as an approximation of an underlying continuous distribution of colors values.
C.2 Color moment
Color moments are measures that characterize color distribution in an image in the same way that central moments uniquely describe a probability distribution. Color moments are mainly used for color indexing purposes as features in image retrieval applications in order to compare how similar two images are based on color. Usually one image is compared to a database of digital images with pre-computed features in order to find and retrieve a similar image. Each comparison between images results in a similarity score, and the lower this score is the more identical the two images are supposed to be.
1) Mean
The first color moment can be interpreted as the average color in the image, and it can be calculated by using the following formula
Ei= pij
where N is the number of pixels in the image and Pi is the value of the j-th pixel of the image at the i-th color channel.
2) Standard Deviation
3) The second color moment is the standard deviation, which is obtained by taking the square root of the variance of the color distribution.
σi= = ( ( ij –Ei)2)
where Ei is the mean value, or first color moment, for the i-th color channel of the image.
C.3 Gabor Filter
In image processing, a Gabor filter, named after Dennis Gabor, is a linear filter used for edge detection. Frequency and orientation representations of Gabor filters are similar to those of the human visual system, and they have been found to be particularly appropriate for texture representation and discrimination.Simple cells in the visual cortex of mammalian brains can be modeled by Gabor functions. Thus, image analysis with Gabor filters is thought to be similar to
perception in the human visual system.
A set of Gabor filters with different frequencies and orientations may be helpful for extracting useful features from an image. In the discrete domain, two-dimensional Gabor filters are given by,
[ , ] = ( )cos(2 ( cos + sin ))
[ , ] = ( )sin(2 ( cos + sin ))
B and C are normalizing factors to be determined. 2-D Gabor filters have rich applications in image processing, especially in feature extraction for texture analysis and segmentation. f defines the frequency being looked for in the texture. By varying θ, we can look for texture oriented in a particular direction. By varying σ, change the support of the basis or the size of the image region being analyzed.
C.4 Colour auto correlation
A new image feature called the color correlogram and use it for image indexing and comparison. This feature distills the spatial correlation of colors, and is both effective and inexpensive for content-based image retrieval. The correlogram robustly tolerates large changes in appearance and shape caused by changes in viewing positions, camera zooms, etc. Experimental evidence suggests that this new feature outperforms not only the traditional color histogram method but also the recently proposed histogram refinement methods for image indexing/retrieval.
refinement methods for image indexing/retrieval. Informally, a color correlogram of an image is a table indexed by color pairs, where the k-th entry for hi jispecifies the probability of finding a pixel of color j at a distance k from a pixel of color i in the image. Such an image feature turns out to be robust in tolerating large changes in appearance of the same scene caused by changes in viewing positions, changes in the background scene, partial occlusions, camera zoom that causes radical changes in shape, etc.
D.Feature Data Preparation:
In previous section feature extraction carried out but different features separation carried out in this section.
E.Feature Database:
In this section with the help of previous two blocks feature database formation is carried out.
F.Support Vector Machine:
For actual classification SVM i.e. support vector machine method is useful. In machine learning, support vector machines (SVMs, also support vector networks) are supervised learning models with associated learning algorithms that analyze data used for classification and regression analysis Given a set of training examples, each marked as belonging to one or the other of two categories, an SVM training algorithm builds a model that assigns new examples to one category or the other, making it a non-probabilistic binary linear classifier. An SVM model is a representation of the examples as points in space, mapped so that the examples of the separate categories are divided by a clear gap that is as wide as possible. New examples are then mapped into that same space and predicted to belong to a category based on which side of the gap they fall on.
In addition to performing linear classification, SVMs can efficiently perform a non-linear classification using what is called the kernel trick, implicitly mapping their inputs into high-dimensional feature spaces.
When data are not labeled, supervised learning is not possible, and an unsupervised learning approach is required, which attempts to find natural clustering of the data to groups, and then map new data to these formed groups. The clustering algorithm which provides an improvement to the support vector machines is called support vector clustering and is often used in industrial applications either when data is not labeled or when only some data is labeled as a preprocessing for a classification pass.
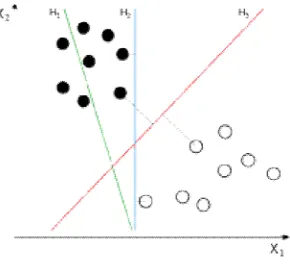
fig. 2 Example of separation of classes
From the figure 2 H1 does not separate the classes,H2 does, but only with a small margin, H3 separates them with the maximum margin.
margin, between the two classes. So we choose the hyperplane so that the distance from it to the nearest data point on each side is maximized. If such a hyperplane exists, it is known as the maximum-margin hyperplaneand the linear classifier it defines is known as a maximum margin classifier; or equivalently, the perceptron of optimal stability.
More formally, a support vector machine constructs a hyperplane or set of hyperplanes in a high or infinite-dimensional space, which can be used for classification, regression, or other tasks. Intuitively, a good separation is achieved by the hyperplane that has the largest distance to the nearest training-data point of any class (so-called functional margin), since in general the larger the margin the lower the generalization error of the classifier.
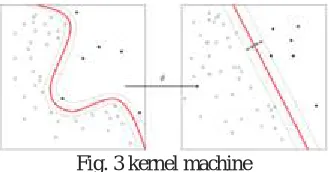
Fig. 3 kernel machine
Whereas the original problem may be stated in a finite dimensional space, it often happens that the sets to discriminate are not linearly separable in that space. For this reason, it was proposed that the original finite-dimensional space be mapped into a much higher-dimensional space making the separation easier in that space. To keep the computational load reasonable, the mappings used by SVM schemes are designed to ensure that dot products may be computed easily in terms of the variables in the original space, by defining them in terms of a kernel function k(x, y) selected to suit the problem .The hyperplanes in the higher-dimensional space are defined as the set of points whose dot product with a vector in that space is constant. The vectors defining the hyperplanes can be chosen to be linear combinations with parameters αi of images of feature vectors xi that occur in the data base. With this choice of a hyperplane, the points x in the feature space that are mapped into the hyperplane are defined by the relation: αi k(xi, x)=Constant. The
fact that the set of points x mapped into any hyperplane can be quite convoluted as a result, allowing much more complex discrimination between sets which are not convex at all in the original space.
IV. CONCLUSION
There are various methods for soil classification using different algorithms. But still soil classification with high accuracy and low cost is challenging task. So, keeping in view, proposed algorithm is useful to soil classification using SVM(Support Vector Machine).We can also use ANN method for classification. Here main objective is to classify soil sample picture with high accuracy and low cost.
REFERENCES
[1]B. Bhattacharya UNESCO-IHE Institute for Water Education D. P. Solomatine UNESCO-IHE Institute for Water Education “Machine Learning in Soil Classification” Proceedings of International Joint Conference on Neural Networks, Montreal, Canada, July 31 - August 4, 2005
[2] A. Coerts, Analysis of Static Cone Penetration Test Data for Subsurface Modelling - A Methodology (PhD Thesis), Utrecht University, The Netherlands, 1996.
[3] G.P. Huijzer, Quantitative Penetrostratigraphic Classification (PhD Thesis), Free university of Amsterdam, The Netherlands, 1992.
[4] C.H. Juang, X.H. Huang, R.D. Holtz, and J.W. Chen, "Determining relative density of sands from CPT using fuzzy sets", J. of Geotechnical Engineering, vol. 122(1), pp. 1-6, 1996.
[5] I.T. Young, and T.W. Calvert, "An analysis technique for biological shape", Information and Control, vol. 25, pp 357-370, 1974.
[6] Z. Zhang, and M. T. Tumay, "Statistical to fuzzy approach toward CPT soil classification", J of Geotechnical and Geoenvironmental Engineering, vol. 125(3), pp. 179-186, 1999.
[7] Segmentation and histogram generation using the hsvcolor space for image retrieval ShamikSural, Gang Qian and SaktiPramanik Dept. of Computer Science and Engineering,3115 Engineering Building, Michigan State University, East Lansing, MI 48824, USA.
[8] R.Shenbagavalli and K.Ramar, “ Feature extraction of soil images for retrieval based on statistics”,International Journal of Computer Applications (0975 – 8887) Volume 88 – No.14, February 2014.
[9] Support vector machine tutorial