A Review On Improved Partical Swarm Optimization For
Multi-Ojective Optical Power Flow Considering The Cost,Loss, Emission
And Voltage Stability Index
Yanapu Arun Raju
1,Dr.B.Srinivas Rao
2 ,P.Maheswara Rao
3P.G student
1,Professor
2,AssistantProfessor
3Department of Electrical and ElectronicsEngineering
VISAKHA INSTITUTE OF ENGINEERING & TECHNOLOGY
57
thDivision, Narava, Visakhapatnam, Andhra Pradesh
India
Abstract
Traditional Economic Load Dispatch deals with
minimizing generation cost while maintaining set of
equality and equality constraints. On the other
hand, the fossil fuel plants pollutes environment by
emitting some toxic gases. Thus conventional
minimum cost operation can not be the only basis
for generation dispatch; emission minimization
must also be taken care of. Power system must be
operated in such a way that both real and reactive
powers are optimized simultaneously. Reactive
powers should be optimized to provide better
voltage profile as well as to reduce system losses.
Thus the objective of reactive power optimization
problem can be seen as minimization of real power
loss over the transmission lines. Now a days large
integrated power systems are being operated under
heavily stressed conditions which imposes threat to
voltage stability. Voltage collapse occurs when a
very low voltage profile or collapses. All these four
objectives are to be met for efficient operation and
control. The results of all the four objectives are
conflicting and noncommensurable. Hence an
efficient control which meets all the specified
objectives is required.
In this project an attempt has been made to
optimize each objective individually using Particle
Swarm Optimization. The so developed algorithm
for Optimization of each objective is tested on two
systems i.e. on IEEE 30 and IEEE 57 bus system.
In this work a method has been proposed to solve
multiobjective optimization method using fuzzy
decision satisfaction method while the objectives
are minimized individually using Particle Swarm
Optimization. Simulation results of IEEE 30 bus
and IEEE 57 bus network are presented to show the
effectiveness of the proposed method
.
Key Words:PSO, Economic dispatch control
1. Introduction
Power system should be operated in such a fashion that
simultaneously real and reactive power is optimized.
Real power optimization problem is the traditional
economic
dispatch which minimizes the real power generation
cost. Reactive power should be optimized to provide
better voltage profile as well as to reduce total system
transmission loss. Thus the objective of reactive power
optimization problem can be seen as minimization of
real power loss over the transmission lines. Traditional
Economic Dispatch [1] aims at scheduling committed
minimum fuel cost while satisfying equality and
inequality constraints. On the other hand thermal power
plants (which contribute major part of electric power
generation) create environmental pollution by emitting
toxic gases such as carbon dioxide (CO2), sulphur dioxide (SO2), nitrogen oxides (NOx). Increasing public awareness against environment pollution and Kyoto
agreement has forced thermal power plants to limit these
emissions. Several strategies for minimizing these
emissions have been proposed among which dispatch of
generating units to minimize emissions as well as fuel
cost is the most attractive approach as this can be applied
to the traditional economic dispatch algorithm with slight
modification.
Initially Economic/Environmental dispatch
(EED) problem was solved by minimizing fuel cost
considering emission as one of the constraints. Different
methods have been reported in literature for solving the
multiobjective EED problem such as weighting factor
approach, εconstraint method, classical Newton
-Raphson method, goal programming approach etc.
PARTICLE SWARM OPTIMIZATION
Particle swarm optimization (PSO) is a population based
stochastic optimization technique developed by Dr.
Eberhart and Dr. Kennedy in 1995, inspired by social
behavior of bird flocking or fish schooling. [3]
PSO shares many similarities with evolutionary
computation techniques such as Genetic Algorithms
(GA). The system is initialized with a population of
random solutions and searches for optima by updating
generations. However, unlike GA, PSO has no evolution
operators such as crossover and mutation. In PSO, the
potential solutions, called particles, fly through the
problem space by following the current optimum
particles.
In past several years, PSO has been
successfully applied in many research and application
areas. It is demonstrated that PSO gets better results in a
faster, cheaper way compared with other methods. [4]
Compared to GA, the advantages of PSO are
that PSO is easy to implement and there are few
parameters to adjust. One version, with slight variations,
works well in a wide variety of applications. Particle
swarm optimization has been used for approaches that
can be used across a wide range of applications, as well
as for specific applications focused on a specific
requirement. PSO has been successfully applied in areas
like, function optimization, artificial neural network
training, fuzzy system control, and other areas where GA
can be applied.
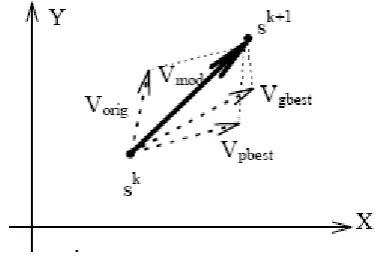
Fig 1.1.Concept of modification of a searching point.
k
S
Current Position1 k
S
Modified Positionorig
V
Current Velocitymod
V
Modified Velocitypbest
V
Velocity base onpbest
gbest
V
Velocity based ongbest
2. ECONOMIC DISPATCH USING PSO
The use of electricity is indispensable in modern age. The
quality of electricity is stated in terms of constant voltage,
constant frequency and uninterrupted power supply at
case of thermal power plants. The quantity of coal and the cost
of coal used in the generation of power in a thermal plant is
directly dependant on the power output produced. Therefore in
order to deliver the power at minimum cost, we need to reduce
the amount of fuel used. This simple solution for this is the use
of more efficient generating units. But there is certain
maximum limit for the efficiency of the generating units. So
for a particular power output the operating schedule with the
distribution of load among the various units, which results in
minimum generating cost is required. Preparation of such
appropriate schedule is nothing but our economic dispatch
problem.
In this chapter PSO algorithm is proposed to determine
the optimal dispatch of generators, such that total fuel cost
incurred is reduced. This algorithm has been tested on IEEE 30
bus and IEEE 57 bus system .
3. PROBLEM FORMULATION
The ED problem is to determine the optimal combination
of power outputs of all generating units to minimize the total
fuel cost while satisfying the load demand and operational
constraints. Since the total cost of generation is a function of
the individual generation of the sources which can take values
within certain constraints, the cost of generation will depend
upon the system constraint for a particular load demand. This
means the cost of generation is not fixed for a particular load
demand but depends upon the operational constraints of the
sources.
Broadly speaking there are two types of system
constraints: (1) Equality constraints, and (2) Inequality
constraints. Inequality constraints are two types: (a) Hard type
and (b) Soft type. The hard type are those which are definite
and specific like the tapping range of an on-load tap changing
transformer whereas soft type are those which have some
flexibility associated with them like the nodal voltages and
phase angle between the nodal voltages, etc. Soft inequality
constraints have been very efficiently handled by the penalty
function.
Objective Function
The economic dispatch problem is a constrained
optimization problem and it can be mathematically expressed
as follows:
Minimize
n
T i i
i=1
F =
F P
(3.1)
Where
F
T= Total cost of generation (Rs/hr)n = Number of generators
i
P
= Real power generation of ith generatori
f
= Fuel cost function of ith generatorsubject to a number of power systems network equality and
inequality constraints.
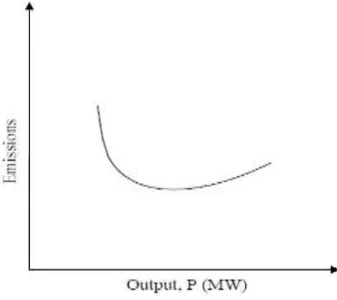
Each generator cost function establishes the relationship
between the power
injected to the system by the generator and the incurred
costs to load the machine to that capacity. Typically,
generators are modeled by smooth quadratic functions such as
to simplify y the optimization problem and facilitate the
application of classical techniques
n n
2
T i i i i i i i
i=1 i=1
F =
F (P )=
a +b P +c P
(3.2)
where, ai , biand ci are fuel cost coefficients
Fig. 3.1 Typical Fuel Cost Function of a Thermal generation Unit
The power balance constraint is an equality constraint that
reduces the power system to a basic principle of
equilibrium between total system generation and total
system loads. Equilibrium is only met when the total
system generation (
P
i) equals to the total system load (PD) plus the system losses(PLoss)
n
i D L
i=1
P =P +P
(3.3)
4.
EMISSION DISPATCH USING PSO
NOX emission is taken into account, since it is more harmful
than other pollutants. The NOX emission can be approximated
as shown in fig 4.1, a quadratic function of the active power output from the generating units.
Fig.4.1(a)NOx Emission Function
The emission dispatch problem can be defined as the following optimization problem, [9]
2
1 n
i i i i i
i
Minimize E
P
P
(4.1)
where
E : total emission release (Kg/hr)
αi, βi, γi : emission coefficients of the ith generating
unit
Subject to demand constraint (4.2) and generating capacity limits (4.3).
n
i D L
i=1
P =P +P
(4.2)
imin i imax
P
P
P
(4.3)The well know solution method to this problem using the coordination equation is
i i n n
i n
i n
dF (P )
dF (P )
PF
= ... = PF
dP
dP
(4.4)
Where i i
i
dF (P )
dP
is the incremental cost denoted byλ
=bi+2ci (4.5)
IEEE 30 bus system
The IEEE 30 bus system data is presented at appendix A. The PSO parameters used in this case study are: No of particles 60, learning factors c1=2.05, c2=2.05, weight factor
w=1.2, constriction factor K=0.7925. Maximum number of iterations=100.
4.1RESULTS
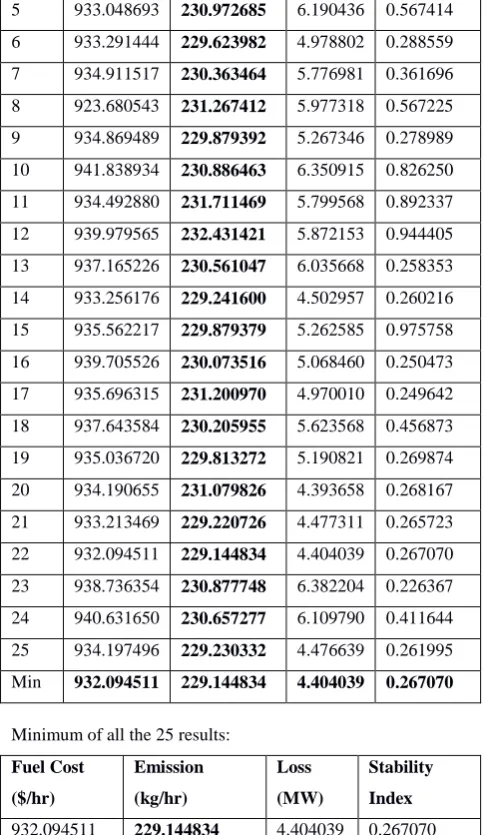
25 independent runs are made and results are given in Table
4.1(a)
Table 4.1(a)independent run results
S.No Fuel Cost
($/hr)
Emission
(kg/hr)
Loss
(MW)
Stability
Index
1 935.716224 229.830261 5.206237 0.286704
2 936.740038 229.914310 5.178947 0.241042
3 934.716287 232.397552 5.490850 0.378935
5 933.048693 230.972685 6.190436 0.567414
6 933.291444 229.623982 4.978802 0.288559
7 934.911517 230.363464 5.776981 0.361696
8 923.680543 231.267412 5.977318 0.567225
9 934.869489 229.879392 5.267346 0.278989
10 941.838934 230.886463 6.350915 0.826250
11 934.492880 231.711469 5.799568 0.892337
12 939.979565 232.431421 5.872153 0.944405
13 937.165226 230.561047 6.035668 0.258353
14 933.256176 229.241600 4.502957 0.260216
15 935.562217 229.879379 5.262585 0.975758
16 939.705526 230.073516 5.068460 0.250473
17 935.696315 231.200970 4.970010 0.249642
18 937.643584 230.205955 5.623568 0.456873
19 935.036720 229.813272 5.190821 0.269874
20 934.190655 231.079826 4.393658 0.268167
21 933.213469 229.220726 4.477311 0.265723
22 932.094511 229.144834 4.404039 0.267070
23 938.736354 230.877748 6.382204 0.226367
24 940.631650 230.657277 6.109790 0.411644
25 934.197496 229.230332 4.476639 0.261995
Min 932.094511 229.144834 4.404039 0.267070
Minimum of all the 25 results:
Fuel Cost
($/hr)
Emission
(kg/hr)
Loss
(MW)
Stability
Index
932.094511 229.144834 4.404039 0.267070
System generation =287.804039MW
Graphs of emission release, fuel cost, and total system losses
are shown in Fig 4.1(b), 4.1(c), 4.1(d) respectively
Fig 4.(b) Total Emission release versus iterations
Fig 4.1(c) Total cost losses
Fig 4.1(d) total system losses
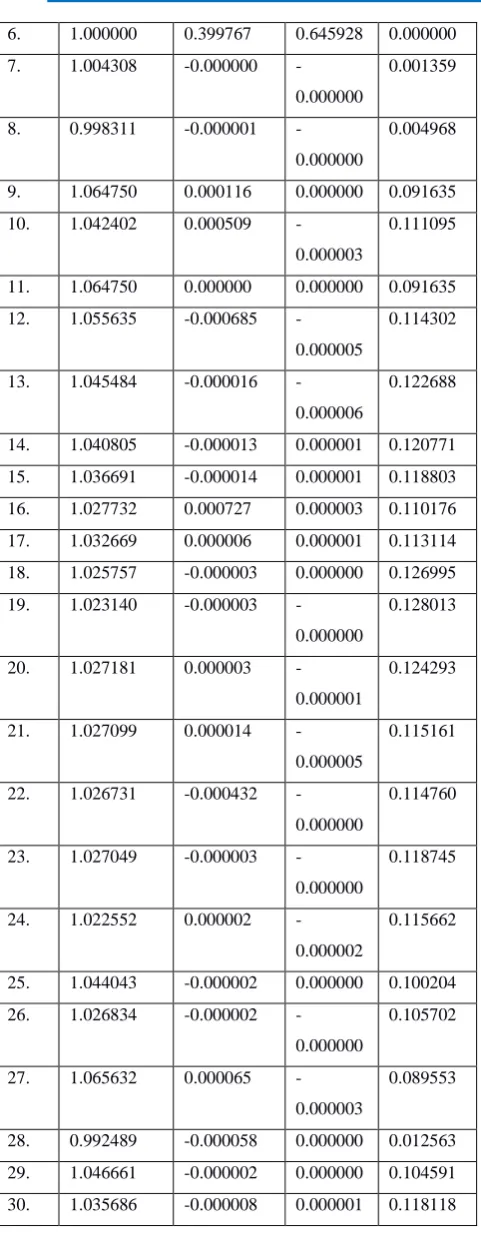
Using PSO, we get optimal dispatch of generators for
minimizing total emission release. Using these power outputs
of generators FDC load flow is made. The converged voltages,
reactive power generations at all buses and Lindex at each bus
are then obtained. Those values are shown in table 4.2(b)
Table 4.2(b) Results of FDC Load flow
S.No Voltage Pgen Qgen Lindex
1. 1.000000 0.662716
-0.287728
0.000000
2. 1.006944 0.665546 0.110742 0.000000
3. 0.992035 0.500037 0.153665 0.000000
4. 0.995768 0.349773 0.582340 0.000000
5. 1.013996 0.300004
-0.024995
0.000000
0 10 20 30 40 50 60 70 80 90 100
220 240 260 280 300 320 340
Iterations
E
m
is
io
n
i
n
K
g
/h
r
Emision Vs Iterations
0 10 20 30 40 50 60 70 80 90 100 860
870 880 890 900 910 920 930 940
Iterations
C
o
s
t
in
$
/h
r
Cost Vs Iterations
0 10 20 30 40 50 60 70 80 90 100
0 0.05 0.1 0.15 0.2 0.25 0.3 0.35 0.4 0.45
Iterations
L
o
s
s
6. 1.000000 0.399767 0.645928 0.000000
7. 1.004308 -0.000000
-0.000000
0.001359
8. 0.998311 -0.000001
-0.000000
0.004968
9. 1.064750 0.000116 0.000000 0.091635
10. 1.042402 0.000509
-0.000003
0.111095
11. 1.064750 0.000000 0.000000 0.091635
12. 1.055635 -0.000685
-0.000005
0.114302
13. 1.045484 -0.000016
-0.000006
0.122688
14. 1.040805 -0.000013 0.000001 0.120771
15. 1.036691 -0.000014 0.000001 0.118803
16. 1.027732 0.000727 0.000003 0.110176
17. 1.032669 0.000006 0.000001 0.113114
18. 1.025757 -0.000003 0.000000 0.126995
19. 1.023140 -0.000003
-0.000000
0.128013
20. 1.027181 0.000003
-0.000001
0.124293
21. 1.027099 0.000014
-0.000005
0.115161
22. 1.026731 -0.000432
-0.000000
0.114760
23. 1.027049 -0.000003
-0.000000
0.118745
24. 1.022552 0.000002
-0.000002
0.115662
25. 1.044043 -0.000002 0.000000 0.100204
26. 1.026834 -0.000002
-0.000000
0.105702
27. 1.065632 0.000065
-0.000003
0.089553
28. 0.992489 -0.000058 0.000000 0.012563
29. 1.046661 -0.000002 0.000000 0.104591
30. 1.035686 -0.000008 0.000001 0.118118
4.2 IEEE 57 bus system
The IEEE 57 bus system data is presented at appendix
B. The PSO parameters used in this case study are: No of
particles 60, learning factors c1=2.05, c2=2.05, weight factor w=1.2, constriction factor K=0.7925. Maximum number of
iterations = 100. Minimum of all 25 independent runs is given
in table 4.2(c)
Table 4.2(a) Minimum of all 25 independent runs
Fuel Cost
($/hr)
Emission
(kg/hr)
Loss (MW) Stability
Index
767.669895 144.904969 23.525670 6.67085
Total System generation = 1440.025670MW
Graph of emission release is shown in Fig 4.2(d)
Figure 4.2(a) total emission release
5
CONCLUSION
In this work an approach to solve multiobjective problem
which aims at minimizing fuel cost, real power loss, emission
release and improving stability index of the system
simultaneously has been proposed. Several system constraints
(namely limits on generator real and reactive powers output,
limits on bus voltage magnitude and angles) are taken care off.
We have successfully implemented Particle Swarm
Optimization solution for Economic Dispatch Problem. The so
algorithm has been tested on IEEE 30 bus system and IEEE 57
bus system. An attempt has been made to determine the
optimum dispatch of generators, when emission release is taken
as objective. The algorithm has been tested on IEEE 30 bus and
IEEE 57 bus system. Reactive power optimization is taken as
0 10 20 30 40 50 60 70 80 90 100
144.5 145 145.5 146 146.5 147 147.5
Iterations
e
m
is
s
io
n
K
g
/h
r
another objective and the algorithm has been developed for
minimizing the total system losses using PSO. Improving
stability index of the system is taken as another independent
objective and this improvement is done using PSO. Thus all the
four objectives are solved individually and the results from
these individual optimizations are fuzzified and final trade off
solution is thus obtained. In this work basic assumption made
is that the decision maker (DM) has imprecise or fuzzy goals of
satisfying each of the objectives, the multiobjective problem is
thus formulated as a fuzzy satisfaction maximization problem
which is basically a min-max problem.
Our proposed approach satisfactorily finds global
optimal solution within a small number of iterations. The
algorithm is fast and can be applied online. The multiobjective
problem is handled using the fuzzy decision satisfaction
maximization technique which is an efficient technique to
obtain trade off solution in multiobjective problems. But as the
evolutionary methods PSO also has the drawback of not
converging to exactly same value all the times due to stochastic
nature. But in this case PSO has almost returned the same value
for most of the cases.
.
REFERENCES
[1] H.Chowdhury, Saifur Rahrnan, “A Review of Recent
Advances in Economic Dispatch”, IEEE Trans. on Power Syst.,
Vol. 5, No. 4, pp 1248- 1259, November 1990.
[2] Allen J. Wood, Bruce F. Wollenberg, “Power
GenerationOperation, And Control”, John Wiley & Sona, Inc.,
New York, 2004
[3] J. Kennedy and R. Eberhart, “Particle swarm optimization,” in Proc. IEEE Int. Conf. Neural Networks (ICNN’95), vol. IV,
Perth, Australia, pp1942-1948, 1995.
[4] M. R. AlRashidi, Student Member, IEEE, and M. E.
El-Hawary, Fellow, IEEE“A Survey of Particle Swarm Optimization Applications in Electric Power Systems” IEEE
Trans. On Evolutionary Computation 2006
[5] Jong-Bae Park, Ki-Song Lee, Joong-Rin Shin, Kwang Y. Lee, “A Particle Swarm Optimization for Economic Dispatch
with Non-smooth Cost Functions”, IEEE Trans. on Power
Syst., Vol. 20, No.1, pp 34- 42, February 2005.
[6] Zwe-Lee Gaing, “Particle Swarm Optimization to Solving
the Economic Dispatch Considering the Generator
Constraints”, IEEE Tans. on Power Syst., Vol 18, No. 3, pp
1187- 1195, Aug. 2003.
[7] El-Keib, A.A.; Ma, H.; Hart, J.L,Economic dispatch in view
of the CleanAir Act of 1990, IEEE Trans PwrSyst, Vol. 9 (2),
May 1994, pp.-972 -978
[8]J.H.Talaq,F.El-Hawary andM.E.El-Hawary, “A Summary of
Environmental/Economic Dispatch algorithms,” IEEE Trans.
Power Syst., vol. 9, pp. 1508–1516, Aug. 1994.
[9] A. Immanuel Selva Kumar, K. Dhanushkodi, J. Jaya Kumar, C.
Kumar Charlie Paul, “Particle Swarm Optimization Solution
to Emission and Economic Dispatch Problem”, IEEE
TENCON 2003.
[10] T.Thakur, KanikSem, SumedhaSaini, and
SudhanshuSharma “A Particle SwarmOptimization Solution to
NO2 and SO2 Emissions for Environmentally Constrained Economic Dispatch Problem”,2006 IEEE PES Transmission
and Distribution Conference and Exposition Latin America,
Venezuela.
[11] Iba K. (1994) ‘Reactive power optimization by genetic algorithms’, IEEE Trans on power systems, May, Vol.9, No.2,
pp.685-692.
[12] Wu Q.H. and Ma J. T.(1995) ‘Power system optimal
reactive power dispatch using Evolutionary programming ‘IEEE Trans on Power Systems
[13] Bhagwan Das, Patvardhan C. (2003) ‘A New Hybrid
Evolutionary Strategy for Reactive Power Dispatch’, Electric
Power Research, Vol.65. pp.83-90.
[14] PapiyaDutta , A.K.Sinha- IIT Kharagpur Professor, “Environmental Economic Dispatch constrained by voltage stability using PSO “Electrical Engineering, IIT Kharagpur-IEEE
2006
[15] Hirotaka Yoshida Kenichi Kawata, Yoshikazu Fukuyama Yosuke Nakanishi “A Particle Swarm Optimization For
Reactive Power And Voltage Control Considering Voltage Stability” IEEE International Conference on IntelligentSystem
Applications to Power Systems (ISAP'99),Rio de Janeiro, April
4-8, 1999
[16] Wen Zhang, Yutian Liu, Senior Member, IEEE “Reactive
Power Optimization Based on PSO in a Practical Power
[17] P.Kundur“Power System Stability and Control”
McGraw-Hill, New York, 1994
18] C. Barbier and J.-P. Barret ”An analysis of phenomena of voltage collapse on transmission system”, Revue Gdndrale de l’dlectricit6, Special CIGRE issue, pp321, July 1980.
[19]“Fast Calculation of Voltage Stability Index”PA L6f T
SmedGAndersson,Transactions on Power Systems, Vol. 7,
No.1 February 1992
[20] J.C. Chow, R. Fischl and H. Yan “On the Evaluation of
Voltage Collapse Criteria” IEEE Trans., PWRS-5, pp.
612-620, May 1990
[21] Claudia Reis, F.P. Maciel Barbosa” A Comparison of Voltage Stability Indices,” IEEE MELECON 2006, May
16-19, Benalmádena (Málaga), Spain
[22] M.A. Abido, A novel multiobjective evolutionary
algorithm for environmental/ economic power dispatch,
Electric Power Syst. Res. 65 (2003) 71–81.
[23] Y.H. Song, G.S. Wang, P.V. Wang, A.T. Johns, “Environmental/economic dispatch using fuzzy logic controlled genetic algorithms”, IEE Proceedings of
Generation,Transmission, Distribution, vol. 144, no. 4, 1997,