FUEL
CELL
FUEL
CELL
FUEL
CELL
Fourth Edition
November 1998
Fuel Cell Handbook
Fuel Cell Handbook
Fourth Edition
November 1998
DOE/FETC-99/1076 by
J.H. Hirschenhofer, D.B. Stauffer, R.R. Engleman, and M.G. Klett Parsons Corporation
Reading, PA 19607
Under Contract No. DE-AC21-94MC31166 for
U.S. Department of Energy Office of Fossil Energy
Contents
Disclaimer
List of Figures
List of Tables and Examples
1.
Technology Overview
2.
Fuel Cell Performance
3.
Phosphoric Acid Fuel Cell
4.
Molten Carbonate Fuel Cell
5.
Solid Oxide Fuel Cell
6.
Polymer Electrolyte Fuel Cell
7.
Fuel Cell Systems
8.
Sample Calculations
9.
Appendix
This report was prepared as an account of work sponsored by an agency of the United States Government. Neither the United States Government nor any agency thereof, nor any of their employees, makes any warranty, express or implied, or assumes any legal liability or responsibility for the accuracy, completeness, or usefulness of any information, apparatus, product, or process disclosed, or represents that its use would not infringe privately owned rights. Reference herein to any specific commercial product, process, or service by trade name, trademark, manufacturer, or otherwise does not necessarily constitute or imply its endorsement, recommendation, or favoring by the United States Government or any agency thereof. The views and opinions of authors expressed herein do not necessarily state or reflect those of the United States Government or any agency thereof.
Available to DOE and DOE contractors from the Office of Scientific and Technical Information, P.O. Box 62, 175 Oak Ridge Turnpike, Oak Ridge, TN 37831; prices available at (423) 576-8401, fax C (423) 576-5725, E-mail C [email protected]
Section Title Page
1. TECHNOLOGY OVERVIEW...1-1 1.1 FUEL CELL DESCRIPTION...1-1
1.2 CELL STACKING...1-7
1.3 FUEL CELL PLANT DESCRIPTION...1-8
1.4 CHARACTERISTICS...1-9
1.5 ADVANTAGES/DISADVANTAGES...1-11
1.6 APPLICATIONS, DEMONSTRATIONS, AND STATUS...1-13
1.6.1 Stationary Electric Power ...1-13 1.6.2 Vehicle Motive Power ...1-20 1.6.3 Space and Other Closed Environment Power...1-21 1.6.4 Derivative Applications ...1-22 1.7 REFERENCES...1-22
2. FUEL CELL PERFORMANCE...2-1 2.1 PRACTICAL THERMODYNAMICS...2-1
2.1.1 Ideal Performance ...2-1 2.1.2 Actual Performance...2-4 2.1.3 Fuel Cell Performance Variables ...2-9 2.1.4 Cell Energy Balance ...2-16 2.2 SUPPLEMENTAL THERMODYNAMICS...2-17
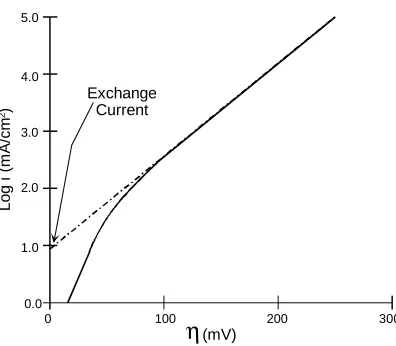
2.2.1 Cell Efficiency ...2-18 2.2.2 Efficiency Comparison to Heat Engines ...2-19 2.2.3 Gibbs Free Energy and Ideal Performance ...2-20 2.2.4 Polarization: Activation (Tafel) and Concentration or Gas Diffusion Limits...2-24 2.3 REFERENCES...2-27
3. PHOSPHORIC ACID FUEL CELL ...3-1 3.1 CELL COMPONENTS...3-2
3.1.1 State-of-the-Art Components ...3-2 3.1.2 Development Components ...3-5 3.2 PERFORMANCE...3-10
3.2.1 Effect of Pressure...3-10 3.2.2 Effect of Temperature ...3-11 3.2.3 Effect of Reactant Gas Composition and Utilization...3-12 3.2.4 Effect of Impurities ...3-14 3.2.5 Effects of Current Density ...3-18 3.2.6 Effects of Cell Life...3-19 3.3 SUMMARY OF EQUATIONS FOR PAFC...3-19
3.4 REFERENCES...3-20
4. MOLTEN CARBONATE FUEL CELL ...4-1 4.1 CELL COMPONENTS...4-4
4.1.1 State-of-the-Art...4-4 4.1.2 Development Components ...4-9 4.2 PERFORMANCE...4-13
4.2.5 Effects of Current Density ...4-29 4.2.6 Effects of Cell Life...4-29 4.2.7 Internal Reforming ...4-30 4.3 SUMMARY OF EQUATIONS FOR MCFC ...4-33
4.4 REFERENCES...4-37
5. SOLID OXIDE FUEL CELL ...5-1 5.1 CELL COMPONENTS...5-3
5.1.1 State-of-the-Art...5-3 5.1.2 Cell Configuration Options...5-6 5.1.3 Development Components ...5-11 5.2 PERFORMANCE...5-15
5.2.1 Effect of Pressure...5-16 5.2.2 Effect of Temperature ...5-17 5.2.3 Effect of Reactant Gas Composition and Utilization...5-19 5.2.4 Effect of Impurities ...5-22 5.2.5 Effects of Current Density ...5-23 5.2.6 Effects of Cell Life...5-24 5.3 SUMMARY OF EQUATIONS FOR SOFC40...5-25
5.4 REFERENCE...5-25
6. POLYMER ELECTROLYTE FUEL CELL ...6-1 6.1 CELL COMPONENTS...6-1
6.1.1 Water Management ...6-2 6.1.2 State-of-the-Art Components ...6-3 6.1.3 Development Components ...6-6 6.2 PERFORMANCE...6-9
6.3 DIRECT METHANOL PROTON EXCHANGE FUEL CELL...6-12
6.4 REFERENCE...6-13
7. FUEL CELL SYSTEMS...7-1 7.1 SYSTEM PROCESSES...7-2
7.1.1 Fuel Processors ...7-2 7.1.2 Rejected Heat Utilization ...7-7 7.1.3 Power Conditioners and Grid Interconnection...7-8 7.1.4 System and Equipment Performance Guidelines ...7-10 7.2 SYSTEM OPTIMIZATIONS...7-12
7.2.1 Pressurization ...7-12 7.2.2 Temperature...7-14 7.2.3 Utilizations...7-15 7.2.4 Heat Recovery...7-16 7.2.5 Miscellaneous ...7-17 7.2.6 Concluding Remarks on System Optimization...7-17 7.3 FUEL CELL SYSTEM DESIGNS - PRESENT...7-18
7.4.2 Natural Gas Fueled Multi-Stage MCFC System ...7-33 7.4.3 Coal Fueled SOFC System (Vision 21)...7-33 7.4.4 Coal Fueled Multi-Stage SOFC System (Vision 21)...7-37 7.4.5 Coal Fueled Multi-Stage MCFC System (Vision 21)...7-37 7.5 RESEARCH AND DEVELOPMENT...7-37
7.5.1 Natural Gas Fueled Pressurized SOFC System ...7-37 7.5.2 UltraFuelCell, A Natural Gas Fueled Multi-Stage Solid State Power Plant System ...7-38 7.5.3 Natural Gas Fueled Multi-Stage MCFC System ...7-41 7.5.4 Coal Fueled Multi-Stage SOFC System (Vision 21)...7-41 7.5.5 Coal Fueled Multi-Stage MCFC System (Vision 21)...7-41 7.6 REFERENCE...7-41
8. SAMPLE CALCULATIONS...8-1 8.1 UNIT OPERATIONS...8-1
8.1.1 Fuel Cell Calculations ...8-1 8.1.2 Fuel Processing Calculations ...8-16 8.1.3 Power Conditioners ...8-20 8.1.4 Others...8-20 8.2 SYSTEM ISSUES...8-21
8.2.1 Efficiency Calculations...8-21 8.2.2 Thermodynamic Considerations...8-23 8.3 SUPPORTING CALCULATIONS...8-27
8.4 COST CALCULATIONS...8-35
8.4.1 Cost of Electricity ...8-35 8.4.2 Capital Cost Development ...8-36 8.5 COMMON CONVERSION FACTORS...8-37
8.6 REFERENCES...8-38
9. APPENDIX...9-1
9.1 EQUILIBRIUM CONSTANTS...9-1
9.2 CONTAMINANTS FROM COAL GASIFICATION...9-2
9.3 SELECTED MAJOR FUEL CELL REFERENCES, 1993 TO PRESENT...9-4
9.4 LIST OF SYMBOLS...9-7
Figure Title Page
Figure 1-1 Schematic of an Individual Fuel Cell...1-1 Figure 1-2 External Reforming and Internal Reforming MCFC System Comparison...1-6 Figure 1-3 Expanded View of a Basic Fuel Cell Repeated Unit in a Fuel Cell Stack (1) ...1-8 Figure 1-4 Fuel Cell Power Plant Major Processes...1-9 Figure 1-5 Relative Emissions of PAFC Fuel Cell Power Plants Compared to Stringent Los Angeles Basin
Requirements...1-10 Figure 1-6 Combining the SOFC with a Gas Turbine Engine to Improve Efficiency ...1-18 Figure 2-1 H2/O2 Fuel Cell Ideal Potential as a Function of Temperature...2-4 Figure 2-2 Ideal and Actual Fuel Cell Voltage/Current Characteristic ...2-5 Figure 2-3 Contribution to Polarization of Anode and Cathode...2-8 Figure 2-4 Flexibility of Operating Points According to Cell Parameters ...2-9 Figure 2-5 Voltage/Power Relationship...2-10 Figure 2-6 Dependence of the Initial Operating Cell Voltage of Typical Fuel Cells on
Temperature ...2-12 Figure 2-7 The Variation in the Reversible Cell Voltage as a Function of Reactant Utilization ...2-15 Figure 2-8 Example of a Tafel Plot...2-25 Figure 3-1 Improvement in the Performance of H2-Rich Fuel/Air PAFCs ...3-5 Figure 3-2 Advanced Water-Cooled PAFC Performance (16)...3-7 Figure 3-3 Effect of Temperature: Ultra-High Surface Area Pt Catalyst. Fuel: H2, H2 + 200 ppm
H2S and Simulated Coal Gas (37)...3-12 Figure 3-4 Polarization at Cathode (0.52 mg Pt/cm2) as a Function of O2 Utilization, which is
Increased by Decreasing the Flow Rate of the Oxidant at Atmospheric Pressure 100% H3PO4, 191°C, 300 mA/cm2, 1 atm. (38) ...3-13 Figure 3-5 Influence of CO and Fuel Gas Composition on the Performance of Pt Anodes in
100% H3PO4 at 180°C. 10% Pt Supported on Vulcan XC-72, 0.5 mg Pt/cm 2
Dew Point, 57°
Curve 1, 100% H2; Curves 2-6, 70% H2 and CO2/CO Contents (mol%) Specified (21)...3-17 Figure 3-6 Effect of H2S Concentration: Ultra-High Surface Area Pt Catalyst (37)...3-17 Figure 3-7 Reference Performances at 8.2 atm and Ambient Pressure (16) ...3-20 Figure 4-1 Dynamic Equilibrium in Porous MCFC Cell Elements (Porous electrodes are
depicted with pores covered by a thin film of electrolyte)...4-3 Figure 4-2 Progress in the Generic Performance of MCFCs on Reformate Gas and Air (11,12) ...4-5 Figure 4-3 Effect of Oxidant Gas Composition on MCFC Cathode Performance at 650°C,
(Curve 1, 12.6% O2/18.4% CO2/69.0% N2; Curve 2, 33% O2/67% CO2)
(49, Figure 3, Pg. 2712) ...4-14 Figure 4-4 Voltage and Power Output of a 1.0/m2 19 cell MCFC Stack after 960 Hours at
965°C and 1 atm, Fuel Utilization, 75% (50) ...4-14 Figure 4-5 Influence of Cell Pressure on the Performance of a 70.5 cm2 MCFC at 650°C
(anode gas, not specified; cathode gases, 23.2% O2/3.2% CO2/66.3% N2/7.3% H2O and 9.2% O2/18.2% CO2/65.3% N2/7.3% H2O; 50% CO2, utilization at 215 mA/cm2)
(53, Figure 4, Pg. 395) ...4-17 Figure 4-6 Influence of Pressure on Voltage Gain (55)...4-18 Figure 4-7 Effect of CO2/O2 Ratio on Cathode Performance in an MCFC, Oxygen Pressure is
0.15 atm (20, Figure 5-10, Pgs.. 5-20)...4-21 Figure 4-8 Influence of Reactant Gas Utilization on the Average Cell Voltage of an MCFC Stack
Figure 4-11 IIR/DIR Operating Concept, Molten Carbonate Fuel Cell Design (42)...4-31 Figure 4-12 CH4 Conversion as a Function of Fuel Utilization in a DIR Fuel Cell...4-32 Figure 4-13 Voltage Current Characteristics of a 3kW, Five Cell DIR Stack with 5,016 cm2
Cells Operating on 80/20% H2/CO2 and Methane (85) ...4-33 Figure 4-14 Performance Data of a 0.37m2 2 kW Internally Reformed MCFC Stack at 650°C
and 1 atm (12)...4-33 Figure 4-15 Average Cell Voltage of a 0.37m2 2 kW Internally Reformed MCFC Stack at 650°C
and 1 atm. Fuel, 100% CH4, Oxidant, 12% CO2/9% O2/77% N2 (12)...4-34 Figure 4-16 Model Predicted and Constant Flow Polarization Data Comparison (94) ...4-36 Figure 5-1 Solid Oxide Fuel Cell Designs at the Cathode ...5-2 Figure 5-2 Solid Oxide Fuel Cell Operating Principle (2) ...5-2 Figure 5-3 Cross Section (in the Axial Direction of the +) of an Early Tubular Configuration
for SOFCs [(8), Figure 2, p. 256] ...5-8 Figure 5-4 Cross Section (in the Axial Direction of the Series-Connected Cells) of an Early "Bell
and Spigot" Configuration for SOFCs [(15), Figure 24, p. 332] ...5-8 Figure 5-5 Cross Section of Present Tubular Configuration for SOFCs (2) ...5-9 Figure 5-6 Gas-Manifold Design for a Tubular SOFC (2)...5-9 Figure 5-7 Cell-to-Cell Connections Among Tubular SOFCs (2)...5-10 Figure 5-8 Single Cell Performance of LSGM Electrolyte (500 µm thick) (34) ...5-14 Figure 5-9 Effect of Pressure on AES Cell Performance at 1000°C [(24) 2.2 cm diameter,
150 cm active length] ...5-16 Figure 5-10 Two Cell Stack Performance with 67% H2 + 22% CO + 11% H2O/Air (20) ...5-17 Figure 5-11 Two Cell Stack Performance with 97% H2 and 3% H2O/Air (41) ...5-19 Figure 5-12 Cell Performance at 1000°C with Pure Oxygen (o) and Air (∆) Both at 25%
Utilization (Fuel (67% H2/22% CO/11%H2O) Utilization is 85%) (42)...5-20 Figure 5-13 Influence of Gas Composition of the Theoretical Open-Circuit Potential of SOFC at
1000°C [(8) Figure 3, p. 258]...5-21 Figure 5-14 Variation in Cell Voltage as a Function of Fuel Utilization and Temperature
(Oxidant (o - Pure O2; ∆ - Air) Utilization is 25%. Currently Density is 160 mA/cm 2
at
800, 900 and 1000°C and 79 mA/cm2 at 700°C) (42) ...5-22 Figure 5-15 SOFC Performance at 1000°C and 350 mA/cm,2 85% Fuel Utilization and 25% Air
Utilization (Fuel = Simulated Air-Blown Coal Gas Containing 5000 ppm NH3, 1 ppm HCl
and 1 ppm H2S) (47) ...5-23 Figure 5-16 Voltage-Current Characteristics of an AES Cell (1.56 cm Diameter, 50 cm
Active Length) ...5-24 Figure 6-1 PEFC Schematic (19)...6-4 Figure 6-2 Performance of Low Platinum Loading Electrodes (23)...6-5 Figure 6-3 Multi-Cell Stack Performance on Dow Membrane (31)...6-7 Figure 6-4 Effect on PEFC Performances of Bleeding Oxygen into the Anode Compartment (6) ...6-9 Figure 6-5 Evolutionary Changes in PEFCs Performance [(a) H2/O2, (b) Reformate Fuel/Air,
(c) H2/Air)] [(14, 37, 38)]...6-10 Figure 6-6 Influence of O2 Pressure on PEFCs Performance (93°C, Electrode Loadings of
Figure 7-7 Schematic for a 4.5 MW Pressurized SOFC ...7-26 Figure 7-8 Schematic for a 4 MW UltraFuelCell Solid State System ...7-30 Figure 7-9 Schematic for a 500 MW Class Coal Fueled Pressurized SOFC...7-34 Figure 9-1 Equilibrium Constants (Partial Pressures in MPa) for (a) Water Gas Shift,
(b) Methane Formation, (c) Carbon Deposition (Boudouard Reaction), and (d) Methane Decomposition (J.R. Rostrup-Nielsen, in Catalysis Science and Technology, Edited by
Table Title Page
Table 1-1 Summary of Major Differences of the Fuel Cell Types ...1-5 Table 1-2 Summary of Major Fuel Constituents Impact on PAFC, MCFC, SOFC, and PEFC...1-11 Table 2-1 Electrochemical Reactions in Fuel Cells...2-2 Table 2-2 Fuel Cell Reactions and the Corresponding Nernst Equations ...2-3 Table 2-3 Ideal Voltage as A Function of Cell Temperature ...2-4 Table 2-4 Outlet Gas Composition as a Function of Utilization in MCFC at 650°C...2-16 Table 3-1 Evolution of Cell Component Technology for Phosphoric Acid Fuel Cells ...3-2 Table 3-2 Advanced PAFC Performance ...3-6 Table 3-3 Dependence of k(T) on Temperature ...3-15 Table 4-1 Evolution of Cell Component Technology for Molten Carbonate Fuel Cells ...4-4 Table 4-2 Amount in Mol% of Additives to Provide Optimum Performance (39)...4-11 Table 4-3 Qualitative Tolerance Levels for Individual Contaminants in Isothermal Bench-Scale Carbonate
Fuel Cells (46, 47, and 48)...4-13 Table 4-4 Equilibrium Composition of Fuel Gas and Reversible Cell Potential as a Function of
Temperature ...4-19 Table 4-5 Influence of Fuel Gas Composition on Reversible Anode Potential at 650°C
(68, Table 1, Pg. 385) ...4-23 Table 4-6 Contaminants from Coal Derived Fuel Gas and Their Potential Effect on MCFCs
(70, Table 1, Pg. 299) ...4-25 Table 4-7 Gas Composition and Contaminants from Air-Blown Coal Gasifier After Hot Gas
Cleanup, and Tolerance Limit of MCFCs to Contaminants...4-26 Table 5-1 Evolution of Cell Component Technology for Tubular Solid Oxide Fuel Cells ...5-4 Table 5-2 K Values for ∆VT...5-18 Table 7-1 Typical Steam Reformed Natural Gas Product...7-3 Table 7-2 Typical Partial Oxidation Reformed Fuel Oil Product (1)...7-5 Table 7-3 Typical Coal Gas Compositions for Selected Oxygen-Blown Gasifiers ...7-7 Table 7-4 Equipment Performance Assumptions ...7-11 Table 7-5 Stream Properties for the Natural Gas Fueled Pressurized SOFC ...7-20 Table 7-6 Operating/Design Parameters for the NG fueled PAFC ... 21 Table 7-7 Performance Summary for the NG fueled PAFC ... 21 Table 7-8 Stream Properties for the Natural Gas Fueled MC Power ER-MCFC...7-22 Table 7-9 Performance Summary for the NG Fueled ER-MCFC...7-23 Table 7-10 Operating/Design Parameters for the NG Fueled IR-MCFC ...7-25 Table 7-11 Overall Performance Summary for the NG Fueled IR-MCFC...7-25 Table 7-12 Stream Properties for the Natural Gas Fueled Pressurized SOFC ...7-26 Table 7-13 Operating/Design Parameters for the NG Fueled Pressurized SOFC ...7-28 Table 7-14 Overall Performance Summary for the NG Fueled Pressurized SOFC ...7-28 Table 7-15 Heron Gas Turbine Parameters...7-28 Table 7-16 Example Fuel Utilization in a Multi-Stage Fuel Cell Module ...7-29 Table 7-17 Stream Properties for the Natural Gas Fueled UltraFuelCell Solid State Power
Robust progress has been made in fuel cell technology since the previous edition of the Fuel Cell Handbook was published in January 1994. Uppermost, polymer electrolyte fuel cells, molten carbonate fuel cells, and solid oxide fuel cells have been demonstrated at commercial size in power plants. The previously demonstrated phosphoric acid fuel cells have entered the marketplace with approximately 185 power plants ordered. Highlighting this commercial entry, the phosphoric acid power plant fleet has demonstrated 95+% availability and several units have passed 40,000 hours of operation.
Early expectations of very low emissions and relatively high efficiencies have been met in power plants with each type of fuel cell. Fuel flexibility has been demonstrated using natural gas, propane, landfill gas, anaerobic digester gas, military logistic fuels, and coal gas, greatly expanding market opportunities. Transportation markets worldwide have shown remarkable interest in fuel cells; nearly every major vehicle manufacturer in the U.S., Europe, and the Far East is supporting development.
Still in its infancy, fuel cell technology development offers further opportunities for significant performance and cost improvements. To achieve 100% successful commercial-scale demonstration, more aggressive pre-testing may be needed to ensure more robust cell technologies. Deficiencies in funding for research and development and for commercial demonstration place tremendous pressure on fuel cell developers.
The authors of this edition of the Fuel Cell Handbook acknowledge the cooperation of the fuel cell community for their contributions to this Handbook. Many colleagues provided data, information, references, valuable suggestions, and constructive comments that were incorporated into the Handbook. In particular, we would like to acknowledge the contributions of the following individuals: R. Kumar of ANL, M. Kristan of Ballard Power Systems, H. C. Maru and M. Farooque of Energy Research Corporation, J. M. King of International Fuel Cells Corporation, S. Gottesfeld of Los Alamos National Laboratory, M. R. Tharp of McDermott Technology, Inc., R. O. Petkus of M-C Power Corporation, and S. C. Singhal and S. E. Veyo of Siemens Westinghouse STC.
NEW-BOLD Enterprises, Inc., of Fairmont, West Virginia, provided technical editing and final layout of the Handbook.
The authors wish to thank Mr. Thomas J. George and Dr. Mark C. Williams of the U.S. Department of Energy, Federal Energy Technology Center, for their support and encouragement, and for providing the opportunity to write this Handbook.
1.1
Fuel Cell Description
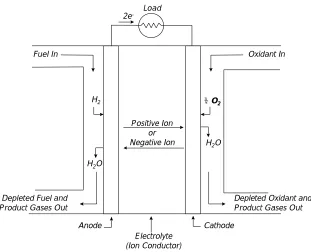
Fuel cells are electrochemical devices that convert the chemical energy of a reaction directly into electrical energy. The basic physical structure or building block of a fuel cell consists of an electrolyte layer in contact with a porous anode and cathode on either side. A schematic representation of a fuel cell with the reactant/product gases and the ion conduction flow directions through the cell is shown in Figure 1-1.
Load 2e
-Fuel In Oxidant In
Positive Ion or Negative Ion
Depleted Oxidant and Product Gases Out Depleted Fuel and
Product Gases Out
Anode Cathode
Electrolyte (Ion Conductor) H2
H2O
H2O
[image:15.612.151.462.355.607.2]½ O2
Figure 1-1 Schematic of an Individual Fuel Cell
energy available is determined by the amount of chemical reactant stored within the battery itself. The battery will cease to produce electrical energy when the chemical reactants are consumed (i.e., discharged). In a secondary battery, the reactants are regenerated by recharging, which involves putting energy into the battery from an external source. The fuel cell, on the other hand, is an energy conversion device that theoretically has the capability of producing electrical energy for as long as the fuel and oxidant are supplied to the electrodes. In reality, degradation, primarily corrosion, or malfunction of components limits the practical operating life of fuel cells.
Note that the ion specie and its transport direction can differ, influencing the site of water production and removal, a system impact. The ion can be either a positive or a negative ion, meaning that the ion carries either a positive or negative charge (surplus or deficit of electrons). The fuel or oxidant gases flow past the surface of the anode or cathode opposite the electrolyte and generate electrical energy by the electrochemical oxidation of fuel, usually hydrogen, and the electrochemical reduction of the oxidant, usually oxygen. Appleby and Foulkes (1) have noted that in theory, any substance capable of chemical oxidation that can be supplied continuously (as a fluid) can be burned galvanically as the fuel at the anode of a fuel cell. Similarly, the oxidant can be any fluid that can be reduced at a sufficient rate. Gaseous hydrogen has become the fuel of choice for most applications, because of its high reactivity when suitable catalysts are used, its ability to be produced from hydrocarbons for terrestrial applications, and its high energy density when stored cryogenically for closed environment applications, such as in space. Similarly, the most common oxidant is gaseous oxygen, which is readily and economically available from air for terrestrial applications, and again easily stored in a closed environment. A three phase interface is established among the reactants, electrolyte, and catalyst in the region of the porous electrode. The nature of this interface plays a critical role in the electrochemical performance of a fuel cell, particularly in those fuel cells with liquid electrolytes. In such fuel cells, the reactant gases diffuse through a thin electrolyte film that wets portions of the porous electrode and react electrochemically on their respective electrode surface. If the porous electrode contains an excessive amount of electrolyte, the electrode may "flood" and restrict the transport of gaseous species in the electrolyte phase to the reaction sites. The consequence is a reduction in the electrochemical performance of the porous electrode. Thus, a delicate balance must be maintained among the electrode, electrolyte, and gaseous phases in the porous electrode structure. Much of the recent effort in the development of fuel cell technology has been devoted to reducing the thickness of cell components while refining and improving the electrode structure and the electrolyte phase, with the aim of obtaining a higher and more stable electrochemical performance while lowering cost.
The electrolyte not only transports dissolved reactants to the electrode, but also conducts ionic charge between the electrodes and thereby completes the cell electric circuit, as illustrated in Figure 1-1. It also provides a physical barrier to prevent the fuel and oxidant gas streams from directly mixing.
catalytic function of electrodes is more important in lower temperature fuel cells and less so in high-temperature fuel cells because ionization reaction rates increase with temperature. It is also a corollary that the porous electrodes must be permeable to both electrolyte and gases, but not such that the media can be easily "flooded" by the electrolyte or "dried" by the gases in a one-sided manner (see latter part of next section).
A variety of fuel cells are in different stages of development. They can be classified by use of diverse categories, depending on the combination of type of fuel and oxidant, whether the fuel is processed outside (external reforming) or inside (internal reforming) the fuel cell, the type of electrolyte, the temperature of operation, whether the reactants are fed to the cell by internal or external manifolds, etc. The most common classification of fuel cells is by the type of electrolyte used in the cells and includes 1) proton exchange membrane (polymer) electrolyte fuel cell (PEFC), 2) alkaline fuel cell (AFC), 3) phosphoric acid fuel cell (PAFC), 4) molten carbonate fuel cell (MCFC), and 5) solid oxide fuel cell (SOFC). These fuel cells are listed in the order of approximate operating temperature, ranging from ~80°C for PEFC, ~100°C for AFC, ~200°C for PAFC, ~650°C for MCFC, and 800°C to 1000°C for SOFC. The operating temperature and useful life of a fuel cell dictate the physicochemical and thermomechanical properties of materials used in the cell components (i.e., electrodes, electrolyte, interconnect, current collector, etc.). Aqueous electrolytes are limited to temperatures of about 200°C or lower because of their high water vapor pressure and/or rapid degradation at higher temperatures. The operating temperature also plays an important role in dictating the type of fuel that can be utilized in a fuel cell. The low-temperature fuel cells with aqueous electrolytes are, in most practical applications, restricted to hydrogen as a fuel. In high-temperature fuel cells, CO and even CH4 can be used because of the inherently rapid electrode kinetics and the lesser need for high catalytic activity at high temperature. However, descriptions later in this section note that the higher temperature cells can favor the conversion of CO and CH4 to hydrogen, then use the equivalent hydrogen as the actual fuel.
A brief description of various electrolyte cells of interest follows. A detailed description of these fuel cells may be found in References (1) and (2).
Polymer Electrolyte Fuel Cell (PEFC): The electrolyte in this fuel cell is an ion exchange membrane (fluorinated sulfonic acid polymer or other similar polymers) that is an excellent proton conductor. The only liquid in this fuel cell is water; thus, corrosion problems are minimal. Water management in the membrane is critical for efficient performance; the fuel cell must operate under conditions where the byproduct water does not evaporate faster than it is produced because the membrane must be hydrated. Because of the limitation on the operating temperature imposed by the polymer, usually less than 120°C, and because of problems with water balance, an H2-rich gas with minimal or no CO (a poison at low temperature) is used. Higher catalysts loading (Pt in most cases) than those used in PAFCs is required in both the anode and cathode.
of CO2 in air must be considered with the alkaline cell.
Phosphoric Acid Fuel Cell (PAFC): Concentrated to 100% phosphoric acid is used for the electrolyte in this fuel cell, which operates at 150 to 220°C. At lower temperatures, phosphoric acid is a poor ionic conductor, and CO poisoning of the Pt electrocatalyst in the anode becomes severe. The relative stability of concentrated phosphoric acid is high compared to other common acids; consequently the PAFC is capable of operating at the high end of the acid temperature range (100 to 220°C). In addition, the use of concentrated acid (100%) minimizes the water vapor pressure so water management in the cell is not difficult. The matrix universally used to retain the acid is silicon carbide (1), and the electrocatalyst in both the anode and cathode is Pt.
Molten Carbonate Fuel Cell (MCFC): The electrolyte in this fuel cell is usually a combination of alkali carbonates or combination (Na and K), which is retained in a ceramic matrix of LiAlO2. The fuel cell operates at 600 to 700°C where the alkali carbonates form a highly conductive molten salt, with carbonate ions providing ionic conduction. At the high operating temperatures in MCFCs, Ni (anode) and nickel oxide (cathode) are adequate to promote reaction. Noble metals are not required.
Solid Oxide Fuel Cell (SOFC): The electrolyte in this fuel cell is a solid, nonporous metal oxide, usually Y2O3-stabilized ZrO2. The cell operates at 650 to 1000°C where ionic conduction by oxygen ions takes place. Typically, the anode is Co-ZrO2 or Ni-ZrO2 cermet, and the cathode is Sr-doped LaMnO3.
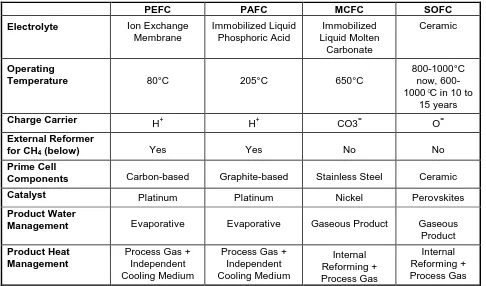
Table 1-1 Summary of Major Differences of the Fuel Cell Types
PEFC PAFC MCFC SOFC
Electrolyte Ion Exchange Membrane Immobilized Liquid Phosphoric Acid Immobilized Liquid Molten Carbonate Ceramic Operating
Temperature 80°C 205°C 650°C
800-1000°C now, 600-1000°C in 10 to
15 years
Charge Carrier H+
H+ CO3= O=
External Reformer
for CH4 (below) Yes Yes No No
Prime Cell
Components Carbon-based Graphite-based Stainless Steel Ceramic
Catalyst Platinum Platinum Nickel Perovskites
Product Water
Management Evaporative Evaporative Gaseous Product Gaseous
Product
Product Heat Management
Process Gas + Independent Cooling Medium
Process Gas + Independent Cooling Medium Internal Reforming + Process Gas Internal Reforming + Process Gas
Cleanup
Cleanup Anode
Cathode
Water
Reformer
Burner Exhaust
Gas
Air Natural
Gas
H2
Cleanup
Cleanup
Anode
Cathode Burner
Water
Natural Gas
Exhaust Gas
Air
[image:20.612.123.490.77.473.2]CH4
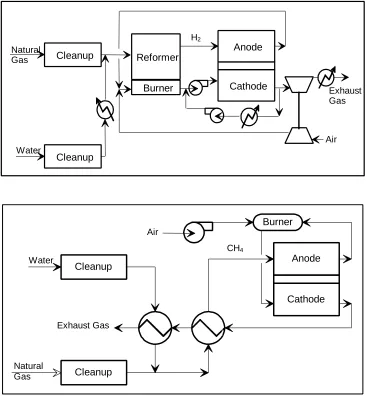
Figure 1-2 External Reforming and Internal Reforming MCFC System Comparison
The porous electrodes used in low-temperature fuel cells consist of a composite structure that contains platinum (Pt) electrocatalyst on a high surface area carbon black and a PTFE (polytetrafluoroethylene) binder. Such electrodes for acid and alkaline fuel cells are described by Kordesch et al. (3). In these porous electrodes, PTFE is hydrophobic (acts as a wet proofing agent) and serves as the gas permeable phase, and carbon black is an electron conductor that provides a high surface area to support the electrocatalyst. Platinum serves as the electrocatalyst, which promotes the rate of electrochemical reactions (oxidation/reduction) for a given surface area. The carbon black also has a certain degree of hydrophobicity, depending on the surface properties of the material. The composite structure of PTFE and carbon establishes an extensive three-phase interface in the porous electrode, which is the benchmark of PTFE bonded electrodes. Some interesting results have been reported by Japanese workers on higher performance gas diffusion electrodes for acid fuel cells (see Section 3.1.2).
In MCFCs, which operate at relatively high temperature, no materials are known that wet-proof a porous structure against ingress by molten carbonates. Consequently, the technology used to obtain a stable three-phase interface in MCFC porous electrodes is different from that used in PAFCs. In the MCFC, the stable interface is achieved in the electrodes by carefully tailoring the pore structures of the electrodes and the electrolyte matrix (LiA1O2) so that the capillary forces establish a dynamic equilibrium in the different porous structures. Pigeaud et al. (4) provide a discussion of porous electrodes for MCFCs.
In an SOFC, there is no liquid electrolyte present that is susceptible to movement in the porous electrode structure, and electrode flooding is not a problem. Consequently, the three-phase interface that is necessary for efficient electrochemical reaction involves two solid phases (solid electrolyte/electrode) and a gas phase. A critical requirement of porous electrodes for SOFC is that they are sufficiently thin and porous to provide an extensive electrode/electrolyte interfacial region for electrochemical reaction.
1.2
Cell Stacking
Figure 1-3 Expanded View of a Basic Fuel Cell Repeated Unit in a Fuel Cell Stack (1)
1.3
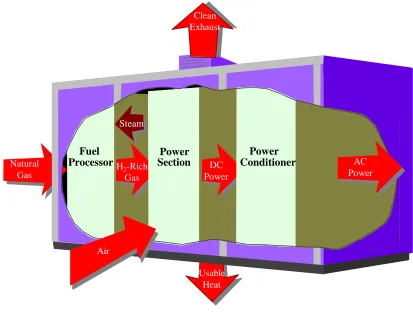
Fuel Cell Plant Description
Clean Exhaust
Fuel
Processor SectionPower
Power Conditioner
Air
AC Power H2-Rich
Gas
DC Power
Usable Heat Natural
Gas
Steam
[image:23.612.98.511.76.388.2]Clean Exhaust
Figure 1-4 Fuel Cell Power Plant Major Processes
1.4
Characteristics
Fuel cells have many characteristics that make them favorable as energy conversion devices. Two that have been instrumental in driving the interest for terrestrial application of the technology are the combination of relatively high efficiency and very low environmental intrusion (virtually no gaseous or solid emissions). Efficiencies of present fuel cell plants are in the range of 40 to 55% based on the lower heating value (LHV) of the fuel. Hybrid fuel cell/reheat gas turbine cycles that offer efficiencies up to 70%, LHV, using demonstrated cell performance, have been proposed. Figure 1-5 illustrates demonstrated low emissions of installed PAFC units compared to the Los Angeles Basin (South Coast Air Quality Management District) requirements, the strictest requirements in the US. Measured emissions from the PAFC unit are < 1 ppm of NOx, 4 ppm of CO, and <1 ppm of reactive organic gases (non-methane) (5). In addition, fuel cells operate at a constant temperature, and the heat from the electrochemical reaction is available for cogeneration applications. Because fuel cells operate at nearly constant efficiency, independent of size, small fuel cell plants operate nearly as efficiently as large ones.1 Thus, fuel cell power plants can be configured in a wide range of electrical output, ranging from watts to megawatts. Fuel cells are quiet and even though fuel flexible, they are sensitive to certain fuel contaminants that must be minimized in the fuel gas. Table 1-2 summarizes the impact of the major constituents within fuel
gases on the various fuel cells. The reader is referred to Sections 3 through 6 for detail on trace contaminants. The two major impediments to the widespread use of fuel cells are 1) high initial cost and 2) high-temperature cell endurance operation. These two aspects are the major focus of manufacturers’ technological efforts.
NOx CO
L.A. Basin Stand
Fuel Cell Power Plant
Reactive Organic Gases
Figure 1-5 Relative Emissions of PAFC Fuel Cell Power Plants Compared to Stringent Los Angeles Basin Requirements
Other characteristics that fuel cells and fuel cell plants offer are
• Direct energy conversion (no combustion).
• No moving parts in the energy converter.
• Quiet.
• Demonstrated high availability of lower temperature units.
• Siting ability.
• Fuel flexibility.
• Demonstrated endurance/reliability of lower temperature units.
• Good performance at off-design load operation.
• Modular installations to match load and increase reliability.
• Remote/unattended operation.
• Size flexibility.
• Rapid load following capability.
General negative features of fuel cells include
• Market entry cost high; Nth cost goals not demonstrated.
• Endurance/reliability of higher temperature units not demonstrated.
• Unfamiliar technology to the power industry.
Table 1-2 Summary of Major Fuel Constituents Impact on PAFC, MCFC, SOFC, and PEFC
Gas Species PAFC MCFC SOFC PEFC
H2 Fuel Fuel Fuel Fuel
CO Poison (>0.5%) Fuela Fuel Poison (>10 ppm)
CH4 Diluent Diluent
b
Fuela Diluent
CO2 & H2O Diluent Diluent Diluent Diluent
S as (H2S & COS) Poison
(>50 ppm)
Poison (>0.5 ppm)
Poison (>1.0 ppm)
No studies to date (11)
a - In reality, CO, with H2O, shifts to H2 and CO2, and CH4, with H2O, reforms to H2 and CO faster than
reacting as a fuel at the electrode. b - A fuel in the internal reforming MCFC.
1.5
Advantages/Disadvantages
The fuel cell types addressed in this handbook have significantly different operating regimes. As a result, their materials of construction, fabrication techniques, and system requirements differ. These distinctions result in individual advantages and disadvantages that govern the potential of the various cells to be used for different applications.
PEFC: The PEFC, like the SOFC, below, has a solid electrolyte. As a result, this cell exhibits excellent resistance to gas cross-over. In contrast to the SOFC, the cell operates at a low 80°C. This results in a capability to bring the cell to its operating temperature quickly, but the rejected heat cannot be used for cogeneration or additional power purposes. Test results have shown that the cell can operate at very high current densities compared to the other cells. However, heat and water management issues may limit the operating power density of a practical system. The PEFC tolerance for CO is in the low ppm level.
amount of CO2 within the air, coupled with purification of the hydrogen, was not cost effective and that terrestrial application of the AFC could be limited to special applications, such as closed environments, at best.
PAFC: The CO2 in the reformed fuel gas stream and the air does not react with the electrolyte in an acid electrolyte cell, but is a diluent. This attribute and the relatively low temperature of the PAFC made it a prime, early candidate for terrestrial application. Although its cell performance is somewhat lower than the alkaline cell because of the cathode's slow oxygen reaction rate, and although the cell still requires hydrocarbon fuels to be reformed into an H2-rich gas, the PAFC system efficiency improved because of its higher temperature environment and less complex fuel conversion (no membrane and attendant pressure drop). The need for scrubbing CO2 from the process air is also eliminated. The rejected heat from the cell is high enough in temperature to heat water or air in a system operating at atmospheric pressure. Some steam is available in PAFCs, a key point in expanding cogeneration applications.
PAFC systems achieve about 37 to 42% electrical efficiency (based on the LHV of natural gas). This is at the low end of the efficiency goal for fuel cell power plants. PAFCs use high cost precious metal catalysts such as platinum. The fuel has to be reformed external to the cell, and CO has to be shifted by a water gas reaction to below 3 to 5 vol% at the inlet to the fuel cell anode or it will poison the catalyst. These limitations have prompted development of the alternate, higher temperature cells, MCFC and SOFC.
MCFC: Many of the disadvantages of the lower temperature as well as higher temperature cells can be alleviated with the higher operating temperature MCFC (approximately 650°C). This temperature level results in several benefits: the cell can be made of commonly available sheet metals that can be stamped for less costly fabrication, the cell reactions occur with nickel catalysts rather than with expensive precious metal catalysts, reforming can take place within the cell provided a reforming catalyst is added (results in a large efficiency gain), CO is a directly usable fuel, and the rejected cell heat is of sufficiently high temperature to drive a gas turbine and/or produce a high pressure steam for use in a steam turbine or for cogeneration. Another advantage of the MCFC is that it operates efficiently with CO2-containing fuels such as bio-fuel derived gases. This benefit is derived from the cathode performance enhancement resulting from CO2 enrichment.
SOFC: The SOFC is the fuel cell with the longest continuous development period, starting in the late 1950s, several years before the AFC. Because the electrolyte is solid, the cell can be cast into flexible shapes, such as tubular, planar, or monolithic. The solid ceramic construction of the cell also alleviates any cell hardware corrosion problems characterized by the liquid electrolyte cells and has the advantage of being impervious to gas cross-over from one electrode to the other. The absence of liquid also eliminates the problem of electrolyte movement or flooding in the electrodes. The kinetics of the cell are fast, and CO is a directly useable fuel as it is in the MCFC. There is no requirement for CO2 at the cathode as with the MCFC. At the temperature of presently operating SOFCs (~1000°C), fuel can be reformed within the cell. The temperature of an SOFC is significantly higher than that of the MCFC. However, some of the rejected heat from an SOFC is needed for preheating the incoming process air.
The high temperature of the SOFC has its drawbacks. There are thermal expansion mismatches among materials, and sealing between cells is difficult in the flat plate configurations. The high operating temperature places severe constraints on materials selection and results in difficult fabrication processes. The SOFC also exhibits a high electrical resistivity in the electrolyte, which results in a lower cell performance than the MCFC by approximately 100 mV. Researchers would like to develop cells at a reduced temperature of 650°C, but the electrical resistivity of the presently used solid electrolyte material would increase.
Developers are using the advantages of fuel cells to identify early applications and addressing research and development issues to expand applications (see Sections 3 through 6).
1.6
Applications, Demonstrations, and Status
The characteristics, advantages, and disadvantages summarized in the previous section form the basis for selection of the candidate fuel cell types to respond to a variety of application needs. The major applications for fuel cells are as stationary electric power plants, including cogeneration units; as motive power for vehicles; and as on-board electric power for space vehicles or other closed environments. Derivative applications will be summarized.
1.6.1
Stationary Electric Power
Operation of complete, self-contained, stationary plants has been demonstrated using PEFC, PAFC, MCFC, and SOFC technology. Demonstrations of these technologies that occurred before 1994 were addressed in previous editions of the Fuel Cell Handbook and in the literature of the period. Recent U.S. manufacturer experience with these various fuel cell technologies has produced timely information. A case in point is the 200 kW PAFC on-site plant, the PC-25, that is the first to enter the commercial market. The plant was developed by International Fuel Cells Corporation (IFC) and is built by the ONSI Corporation, both independent subsidiaries of United Technologies Corporation (UTC). The Toshiba Corporation of Japan and Ansaldo SpA of Italy are partners with UTC in IFC. The on-site plant is proving to be an economic and beneficial addition to the operating systems of commercial buildings and industrial facilities because it is superior to conventional technologies in reliability, efficiency, and ease of siting. Because the PC-25 is the first available commercial unit, it serves as a model for fuel cell application. Because of its attributes, the PC-25 is being installed in various applications, such as hospitals, hotels, large office buildings, manufacturing sites and institutions, to meet the following requirements:
• On-site energy
• Continuous power - backup
• Uninterrupted power supply
• Premium power quality
• Independent power source
During the last several years, 150 to 170 PC-25s have been placed in service in 14 countries; 115 plants are operating presently. As of May 20, 1997, 185 plants had been ordered (6). Characteristics of the plant are as follows:
• Power Capacity 0 to 200 kW with natural gas fuel (-30 to 45°C, up to 150 m)
• Voltage and Phasing 480/277 volts at 60 Hz ; 400/230 volts at 50 Hz
• Thermal Energy 740,000 kJ/hour at 60°C (700,000 Btu/hour heat at 140°F); (Cogeneration) Mod provides 369,000 kJ/hour at 120°C (350,000 Btu/hour at
250°F) and 369,000 kJ/hour at 60°C
• Electric Connection Grid-connected for on-line service and grid-independent for on-site premium service
• Power Factor Adjustable between 0.85 to 1.0
• Transient Overload None
• Grid Voltage Unbalance 1%
• Grid Frequency Range +/-3%
• Voltage Harmonic Limits <3%
• Plant Dimensions 3 m (10 ft) wide by 3 m (10 ft) high by 5.5 m (18 ft) long, not including a small fan cooling module (5)
• Plant Weight 17,230 kg (38,000 lb)
35,000 hours. The longest continuous run stands at 9500 hours for a unit purchased by Tokyo Gas for use in a Japanese office building (10). This plant ended its duration record because it had to be shut down because of mandated maintenance by regulation. It is estimated at this time that cell stacks can achieve a life of 5 to 7 years. The fleet has attained an average of over 95% availability. The latest model, the PC-25C, is expected to achieve over 96%. The plants have operated on natural gas, propane, butane, land fill gas (11, 12), hydrogen (13), and gas from anaerobic digestors (14). Emissions are so low (see Figure 1-5) that the plant is exempt from air permitting in the South Coast and Bay Area (CA) Air Quality Management Districts, which have the most stringent limits in the U.S. The sound pressure level is 62 dBA at 9 meters (30 feet) from the unit. The PC-25 has been subjected to ambient conditions varying from -32°C to +49°C and altitudes from sea level to 1600 meters (~1 mile). Impressive ramp rates result from the solid state electronics. The PC-25 can be ramped at 10 kW/sec up or down in the grid connected mode. The ramp rate for the grid independent mode is idle to full power in ~one cycle or essentially one-step instantaneous from idle to 200 kW. Following the initial ramp to full power, the unit can adjust at an 80 kW/sec ramp up or down in one cycle.
The unit price of the latest PC-25s is approximately $3000/kW. Installation costs have been mentioned at $85,000 up (~$40/kW up), depending on the complexity of the installation. Recent customers have obtained a Federal Grant rebate of $1000/kW as the result of the Clean Air Act Program. The PC-25 program also has received the support of the U.S. military, which has developed a program to install 30 units at government facilities.
The fuel cell stacks are made and assembled into units at an 80,000 ft2 facility located in South Windsor, Connecticut, U.S.. Low cost/high volume production depends on directly insertable sub-assemblies as complete units and highly automatic processes such as robotic component handling and assembly. The stack assembly is grouped in a modified spoke arrangement to allow for individual manufacturing requirements of each of the cell components while bringing them in a continuous flow to a central stacking elevator (15).
Ballard Generation Systems, a subsidiary of Ballard Power Systems, has produced the only PEFC stationary on-site plant to date. It has these characteristics:
• Power Capacity 250 kW with natural gas fuel
• Electric Efficiency 40% LHV
• Thermal Energy 854,600 kJ/hour at 74°C (810,000 Btu/hour at 165°F)
• Plant Dimensions 2.4 m (8 ft) wide by 2.4 m (8 ft) high by 5.7 m (18.5 ft) long
• Plant Weight 12,100 kg (26,700 lb)
An Energy Research Corporation (ERC) 2 MW utility scale plant demonstration, a joint private sector/government program, began operation in April 1996 at a City of Santa Clara (California) Municipal Electric site. This demonstration was the largest plant test to date based on MCFC technology. The plant included 16 atmospheric, internal reforming MCFC stacks, each rated at 125 kW.
Specific project criteria (17) that were successful included rated output, peak operation (reached peak of 1.93 MW AC), voltage harmonic power quality, 2 ppm NOx, undetectable SOx, and operation within noise limits (<60 dBA at 100 feet from the power equipment). The plant achieved an efficiency of 44% LHV. Because this was the first test of a large MCFC plant, supplemental fuel was used to ensure stability. This fuel would not be required in a commercial setting, and efficiency would improve to 49% without it (18). The ramp rate was 3.3% power per minute (maximum 4.8%).
There were problems with this first-of-a-kind plant. After 550 hours of operation, peculiar electric behavior was observed. Dielectrics in the piping system used to insulate the fuel cell stacks’ high voltage had been damaged. This was attributed to a glue that was used to attach thermal insulation to the stacks, feed and exit process lines, and dielectric insulators. It carbonized and became electrically conductive during elevated temperature operation. As a result, the dielectrics and some piping had to be replaced. The plant was restarted at a power level of 1.0 MW ACnet, but it soon had to be reconfigured to operate with the eight stacks that were not damaged. After maintenance, the plant was brought back on line at 500 kW, because of lower operating temperatures and the impact of adverse thermal gradients in the stack. Total operating time reached 6900 hours with 4900 hours of hot time when the test was concluded in March 1997 (19). The plant operated 3400 hours in a grid connected mode.
The focus of the utility demonstration and ERC’s fuel cell development program is the commercialization of a 2.8 MW MCFC plant. Characteristics of the internal reforming ERC early commercial MCFC plant are (20) as follows:
• Power Capacity 2.8MW net AC
• Electric efficiency ~58% (LHV) on natural gas
• Voltage and Phasing Site dependent, Voltage is site dependent, 3 phase, 60 Hz
• Thermal energy ~4.2 million kJ/hour (~4 million Btu/hour)
• Availability 95%
A demonstration of the commercial prototype is being planned at a site to be determined (19). ERC is also participating in the commercialization of a 300 kW MCFC cogeneration unit with MTU Friedrichshafen, an affiliate of Diamler Benz. This power plant has been demonstrated at a MTU facility; an improved utility demonstration is imminent. ERC has a licensing agreement with MTU to manufacture and market the plants in North America.
• Capacity 274 kW ACnet
• NOx <1ppm
• SOx <0.01 ppm
• Efficiency 44.4% electric, 54.4% cogeneration.
• Pressure 60 psia Steam out 157 kg/hour (346 lb/hour) at (338°F or 115 psia.
Testing of the Miramar plant commenced on January 10, 1997, and the plant achieved power on January 24. It operated until May 12, accumulating 2350 hours, 1566 hours of which was on load. The maximum power of the generator was 206 kW.
The test demonstrated system integration and operational control. It verified the mathematical model for predicting performance by test. The fuel cell stack exhibited a uniform voltage distribution, averaging 720 mV ± 20 mV/cell. Other results were as follows: no electrolyte pumping; reliable pressure operation; excellent flat plate reformer operation that met output, conversion efficiency, and energy efficiency; and production of cogeneration steam for the air station’s district heating system (160 kg/hour/350 lb/hour of 8.5 atmosphere steam/315°C).
Not all operation was satisfactory. There were problems with the recycle gas blower, turbocharger, and inverter. It was found that the turbocharger and recycle blower were not robust. Inverter shut downs occurred frequently at the start of testing because of a susceptibility of the logic board to electromotive interference and incorrect inverter control logic. A loose set of AC power connections within the inverter cabinet caused random over-voltage transients. The plant had to be shut down each time there was an inverter problem because there was no place to dump the electric load. This was corrected later in the test when a DC load bank was installed. Afterwards, the voltage problem could be isolated, then corrected. The control logic of the inverter was incorrectly set at first to constant power rather than constant current. This caused voltage drops when the fuel cell load was increased. Once these problems were corrected, the inverter responded well during the balance of testing. The numerous shutdowns had an impact on fuel cell performance. Because of the inverter problems, it was not possible to raise the power level above 125 kW.
The eventual early commercial goal is to commercialize two generators, one at 500 kW and one at 1 MW. The 500 kW unit is expected to achieve an efficiency of 52% LHV electric-only, a cogeneration efficiency of 67% or, with modification, 80 to 85%.
There are two current SOFC demonstrations operating on user sites. Both of these units were produced by Siemens Westinghouse Power Corporation, with headquarters in Orlando, Florida. The Power Generation Unit of the Westinghouse Corporation, which included the Westinghouse SOFC Program, was purchased recently by Siemens AG. The capacity of the two plants is respectively 25 kW and 100 kW. The 25 kW unit is on test at the University of California’s National Fuel Cell Research Center located in Irvine, California. The unit typically operates at 21.7 kW DC and 173 amperes. The unit has realized a cumulative operating time of over 9500 hours (includes 5580 hours previous testing while installed at Southern California Edison’s Highgrove Station). An interesting aspect of the plant is that it sat dormant and unattended for two years between sites.
The nominal 100 kW 50 Hz unit is presently operating at the NUON District Heating site in Westvoort, The Netherlands. The unit is sponsored by EDB/ELSAM, a consortium of Dutch and Danish Energy distribution companies. Site acceptance was completed by February 6, 1998. Since then, this system has operated unattended, delivering 105 kW ac to the grid for over 4000 hours. The electric only efficiency is 45%, plus the plant supplies 85 kW of hot water at 110°C to the local district heating system. The plant, which consists of three major systems, measures 8.42 m long by 2.75 m wide by 3.58 m high.
The Siemens Westinghouse SOFC commercialization plan is focused on an initial offering of a hybrid fuel cell/gas turbine plant. The fuel cell module replaces the combustion chamber of the gas turbine engine. Figure 1-6 shows the benefit behind this combined plant approach. Additional details are provided in Section 7. As a result of the hybrid approach, the 1 MW early commercial unit is expected to attain ~60% efficiency LHV when operating on natural gas.
100 90 80 70 60
50 40 30 20 10 0
Advanced Gas Turbine
System
High Temperature
Fuel Cell
Gas Turbine/ Fuel Cell Combined Cycle
EFFICIENCY (%)
The military finds certain characteristics of fuel cell power plants desirable for field duty. Foremost, a fuel cell unit is quiet so it can be close to the front line. It has a low heat trace, and it can be scaled to various sizes, from a few kW backpack to larger mobile power plant. The main drawback for the military is that a logistic fuel infrastructure exists. Logistic fuels (defined as easily transportable and stored, and compatible with military uses) are difficult to convert to hydrogen for fuel cell use. The burden of changing the fuel infrastructure to accommodate lighter fuels, normally used in fuel cells, is far greater than the benefits fuel cells offer the military. The Advanced Research Projects Agency of DOD funded several projects to investigate adapting logistics fuels to fuel cell use.
IFC conducted testing of a 100 kW mobile electric power plant (MEP) with the logistic fuels of JP-8 and DF-2. An auto-thermal reformer that achieved 98% conversion was used to convert the logistic fuel to a methane rich fuel.
ERC tested a lab-scale carbonate fuel cell stack on a model diesel-like fuel (Exxsol) using an adiabatic pre-reformer to convert the liquid fuel to methane in 1991 to 1993. In 1995 and 1996, ERC verified a 32 kW MCFC stack operation on jet fuel (JP-8) and diesel (DF-2) in system integrated tests using the diesel-to-methane adiabatic pre-reformer approach. Test results showed that there was a 5% power derating compared to natural gas operation.
The 25 kW SOFC power unit (see Siemens Westinghouse, above) was fitted with a similar pre-reformer to the ERC and operated with JP-8 (766 hours) and DF-2 (1555 hours) while the unit was installed at SCE’s Highgrove Station.
SOFCo, a limited partnership of Babcock and Wilcox (a MeDermott International company) and Ceramatec (an Elkem company), has tested a planar SOFC unit for the MEP program that will operate on logistic fuels.
All three demonstrations showed that fuel cell units can be operated with military logistic fuels (22).
Plaquemine, LA, site on coal gas as well as pipeline gas. The test included 1500 hours of operation using 9142 kJ/m3 syngas from a slip stream of a 2180 tonne/day Destec entrained-bed gasifier. The fuel processing system incorporated cold gas cleanup for bulk removal of H2S and other contaminants allowing the 21 kW MCFC stack to demonstrate that the ERC MCFC technology can operate on either natural gas or coal gas.
User groups have organized in conjunction with each of the manufacturers stationary plant development programs. The groups are listed below:
• PAFC, ONSI The North American Fuel Cell Owners Group
• MCFC, ERC and M-C Power Respectively: The Fuel Cell Commercialization Group and The Alliance to Commercialize Carbonate Technology
• SOFC, Siemens Westinghouse SOFC Commercialization Association (SOCA)
These groups provide invaluable information from a user viewpoint about fuel cell technology for stationary power plant application. They can be contacted though the manufacturers.
A series of standards is being developed to facilitate the application of stationary fuel cell technology power plants. Standard development activities presently underway are
• Design and Manufacturing Standard ANSI Z21.83/CGA 12.10
• Interconnect Standards for Interfacing Revive/Revise ANSI/IEEE Std 1001-1988
• Performance Test ASME PTC50, Fuel Cell Performance Code Committee
• Emergency Generator Standards NFPA 70,110
• Installation Standard Review NFPA TC 850
1.6.2
Vehicle Motive Power
In the early 1970s, K. Kordesch modified a 1961 Austin A-40 two-door, four-passenger sedan to an air-hydrogen fuel cell/battery hybrid car (27). This vehicle used a 6-kW alkaline fuel cell in conjunction with lead acid batteries, and operated on hydrogen carried in compressed gas cylinders mounted on the roof. The car was operated on public roads for three years and about 21,000 km.
In 1994 and 1995, H-Power (Belleville, New Jersey) headed a team that built three PAFC/battery hybrid transit buses (28, 29). These 9 meter (30 foot), 25 seat (with space for two wheel chairs) buses used a 50 kW fuel cell and a 100 kW, 180 amp-hour nickel cadmium battery.
Recently, the major activity in transportation fuel cell development has focused on the polymer electrolyte fuel cell (PEFC). In 1993, Ballard Power Systems (Burnaby, British Columbia, Canada) demonstrated a 10 m (32 foot) light-duty transit bus with a 120 kW fuel cell system, followed by a 200 kW, 12 meter (40 foot) heavy-duty transit bus in 1995 (30). These buses use no traction batteries. They operate on compressed hydrogen as the on-board fuel. In 1997, Ballard provided 205 kW (275 HP) PEFC units for a small fleet of hydrogen-fueled, full-size transit buses for demonstrations in Chicago, Illinois, and Vancouver, British Columbia. Working in collaboration with Ballard, Daimler-Benz built a series of PEFC-powered vehicles, ranging from passenger cars to buses (31). The first such vehicles were hydrogen-fueled. A methanol-fueled PEFC A-class car unveiled by Daimler-Benz in 1997 has a 640 km (400 mile) range. Plans are to offer a commercial vehicle by 2004. A hydrogen-fueled (metal hydride for hydrogen storage), fuel cell/battery hybrid passenger car was built by Toyota in 1996, followed in 1997 by a methanol-fueled car built on the same RAV4 platform (32).
Other major automobile manufacturers, including General Motors, Volkswagen, Volvo, Honda, Chrysler, Nissan, and Ford, also have announced plans to build prototype polymer electrolyte fuel cell vehicles operating on hydrogen, methanol, or gasoline (33). IFC (7) and Plug Power in the U.S., and Ballard Power Systems of Canada (16), are participating in separate programs to build 50 to 100 kW fuel cell systems for vehicle motive power. Other fuel cell manufacturers are involved in similar vehicle programs. Some are developing fuel cell-powered utility vehicles, golf carts, etc. (34, 35).
1.6.3
Space and Other Closed Environment Power
1.6.4
Derivative Applications
Because of the modular nature of fuel cells, they are attractive for use in small portable units, ranging in size from 5 W or smaller to 100 W power levels. Examples of uses include a Ballard fuel cell demonstrating 20 hour operation of a portable power unit (36) and an IFC military backpack. There also has been technology transfer from fuel cell system components. The best example is a joint IFC and Praxair, Inc., venture to develop a unit that converts natural gas to 99.999% pure hydrogen based on using fuel cell reformer technology and a pressure swing adsorption process.
1.7
References
1. A.J. Appleby, F.R. Foulkes, Fuel Cell Handbook, Van Nostrand Reinhold, New York, NY, 1989.
2. Report of the DOE Advanced Fuel-Cell Commercialization Working Group, Edited by S.S. Penner, DOE/ER/0643, prepared by the DOE Advanced Fuel Cell Working Group (AFC2WG) or the United States Department of Energy under Contract No. DEFG03-93ER30213, March 1995.
3. K. Kordesch, J. Gsellmann, S. Jahangir, M. Schautz, in Proceedings of the Symposium on Porous Electrodes: Theory and Practice, Edited by H.C. Maru, T. Katan, M.G. Klein, The Electrochemical Society, Inc., Pennington, NJ, p. 163, 1984.
4. A. Pigeaud, H.C. Maru, L. Paetsch, J. Doyon, R. Bernard, in Proceedings of the Symposium on Porous Electrodes: Theory and Practice, Edited by H.C. Maru, T. Katan, M.G. Klein, The Electrochemical Society, Inc., Pennington, NJ, p. 234, 1984.
5. J.M. King, N. Ishikawa, "Phosphoric Acid Fuel Cell Power Plant Improvements and Commercial Fleet Experience," Nov. 96 Fuel Cell Seminar.
6. www.hamilton-standard.com/ifc-onsi/ifc/news/may203.htm.
7. AOL News, "Fuel Cells Deliver Two Million Hours of Green Power; More than 160 PC25™ Fuel Cell Power Plants Now Operating Worldwide," July 1, 1998.
8. K. Yokota, et al., "GOI 11 MW FC Plant Operation Interim Report," in Fuel Cell Program and Abstracts, 1992 Fuel Cell Seminar, Tucson, AZ, November 29-December 2, 1992. 9. Communications with IFC, September 21, 1998.
10. ONSI Press Release, "Fuel Cell Sets World Record; Runs 9,500 Hours Nonstop," May 20, 1997.
11. Northeast Utilities System Press Release, "Converting Landfill Gas into Electricity is an Environmental Plus," June 24, 1996.
12. "Groton’s Tidy Machine," Public Power, March-April 1997.
13. ONSI Press Release, "World’s First Hydrogen Fueled Fuel Cell Begins Operation in Hamburg, Germany," November 7, 1997.
14. "Anaerobic Gas Fuel Cell Shows Promise," Modern Power Systems, June 1997.
15. E.W. Hall, W.C. Riley, G.J. Sandelli, "PC25 Product and Manufacturing Experience," IFC, Fuel Cell Seminar, November 1996.
16. www.ballard.com, 1998.
Society, May 1997.
20. Information supplied by ERC for the Fuel Cell Handbook, 1998.
21. R.O. Petkus, "Successful Test of a 250 kW Molten Carbonate Fuel Cell Power Generator at NAS Miramar," Power-Gen International ’97, Dallas, TX, December 10, 1997.
22. M.M. Piwetz, J.S. Larsen, T.S. Christensen, "Hydrodesulfurization and Pre-reforming of Logistic Fuels for Use in Fuel Cell Applications," Fuel Cell Seminar Program and Abstracts, Courtesy Associates, Inc., November 1996.
23. Westinghouse Electric Corporation, Bechtel Group, Inc., "Solid Oxide Fuel Cell Repowering of Highgrove Station Unit 1, Final Report," prepared for Southern California Edison Research Center, March 1992.
24. ERC, "Effects of Coal-Derived Trace Species on the Performance of Molten Carbonate Fuel Cells," topical report prepared for U.S. DOE/METC, DOE/MC/25009-T26, October 1991. 25. N. Maskalick, "Contaminant Effects in Solid Oxide Fuel Cells," in Agenda and Abstracts,
Joint Contractors Meeting, Fuel Cells and Coal-Fired Heat Engines Conference, U.S. DOE/METC, August 3-5, 1993.
26. D.M. Rastler, C. Keeler, C.V. Chang, "Demonstration of a Carbonate on Coal Derived Gas," Report 15, in An EPRI/GRI Fuel Cell Workshop on Technology Research and Development. Stonehart Associates, Madison, CT, 1993.
27. K.V. Kordesch, "City Car with H2-Air Fuel Cell and Lead Battery," 6th Intersociety Energy
Conversion Engineering Conference, SAE Paper No. 719015, 1971.
28. A. Kaufman, "Phosphoric Acid Fuel Cell Bus Development," Proceedings of the Annual Automotive Technology Development Contractors' Coordination Meeting, Dearborn, MI, October 24-27, 1994, SAE Proceedings Volume P-289, pp. 289-293, 1995.
29 R.R. Wimmer, "Fuel Cell Transit Bus Testing & Development at Georgetown University," Proceedings of the Thirty Second Intersociety Energy Conversion Engineering Conference, July 27-August 1, 1997, Honolulu, HI, pp. 825-830, 1997.
30. N.C. Otto, P.F. Howard, "Transportation Engine Commercialization at Ballard Power Systems," Program and Abstracts 1996 Fuel Cell Seminar, November 17-20, 1996, Orlando, FL, pp. 559-562.
31. F. Panik, "Fuel Cells for Vehicle Application in Cars - Bringing the Future Closer," J. Power Sources, 71, 36-38, 1998.
32. S. Kawatsu, "Advanced PEFC Development for Fuel Cell Powered Vehicles," J. Power Sources, 71, 150-155, 1998.
33. Fuel-Cell Technology: Powering the Future, Electric Line, November/December 1996. 34. M. Graham, F. Barbir, F. Marken, M. Nadal, "Fuel Cell Power System for Utility Vehicle,"
Program and Abstracts 1996 Fuel Cell Seminar, November 17-20, 1996, Orlando, FL, pp. 571-574.
35. P.A. Lehman, C.E. Chamberlin, "Design and Performance of a Prototype Fuel Cell Powered Vehicle," Program and Abstracts 1996 Fuel Cell Seminar, November 17-20, 1996, Orlando, FL, pp. 567-570.
The purpose of this section is to provide the framework to understand the chemical and thermodynamic operation of fuel cells, i.e., how operating conditions affect the performance of fuel cells. The impact of variables, such as temperature, pressure, and gas constituents, on fuel cell performance needs to be assessed to predict how the cells interact with the power plant system supporting it. Understanding of the impact of these variables allows system analysis studies to "engineer" a specific fuel cell application. The first part of this section is intended for those who need to understand the practical thermodynamics that lead to a description of cell operation and performance. Practical cell thermodynamics is the link between fuel cell design, Section 1, and cell performance variables, Section 3 through Section 6. The second part of the section, Supplemental Thermodynamics, is a limited expansion of the Practical Thermodynamics to apprise interested readers and students of additional fundamentals. Neither of these topics is intended to provide a rigorous or detailed explanation of fuel cell thermodynamics. Numerous fuel cell books and scientific papers are available to provide additional details, (see General Fuel Cell References, Section 9.3).
Readers interested only in understanding systems incorporating fuel cells should proceed directly to the systems section, Section 7.
2.1
Practical Thermodynamics
A logical first step in understanding the operation of a fuel cell is to define its ideal performance. Once the ideal performance is determined, losses can be calculated and then deducted from the ideal performance to describe the actual operation. Section 2.1.1 is a description of the thermodynamics that characterize the ideal performance. Actual performance is addressed in Section 2.1.2. Section 2.1.3 provides a lead-in to the development of equations in Section 3 through Section 6 that quantify the actual cell performance as a function of operating conditions for PAFC, PEFC, MCFC, and SOFC, respectively.
2.1.1
Ideal Performance
cells, but it serves as a potential source of H2 in high-temperature fuel cells where non-noble metal catalysts such as nickel (Ni) are used.
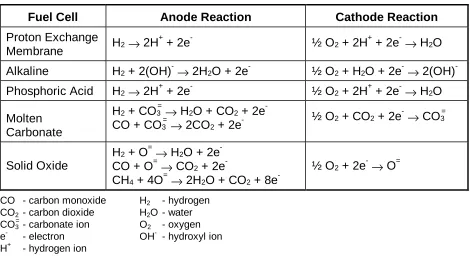
[image:39.612.72.542.392.650.2]Note that H2, CO, and CH4 are shown in Table 2-1 as undergoing anodic oxidation. In actuality, insignificant direct oxidation of the CO and CH4 may occur. It is common system analysis practice to assume that H2, the more readily oxidized fuel, is produced by CO and CH4 reacting, at equilibrium, with H2O through the water gas shift and steam reforming reactions, respectively. The H2 calculated to be produced from CO and CH4, along with any H2 in the fuel supply stream, is referred to as equivalent H2. The temperature and catalyst of present MCFCs provide the proper environment for the water gas shift reaction to produce H2 and CO2 from CO and H2O. An MCFC that reacts only H2 and CO is known as an external reforming (ER) MCFC. In an internal reforming (IR) MCFC, the reforming reaction to produce H2 and CO2 from CH4 and H2O can occur if a reforming catalyst is placed in proximity to the anode to promote the reaction. The direct oxidation of CO and CH4 in a high-temperature SOFC is feasible without the catalyst, but again the direct oxidation of these fuels is favored less than the water gas shift of CO to H2 and reforming of CH4 to H2. These are critical arguments in determining the equations needed to describe the electrical characteristics and the energy balance of the various type cells. It is fortunate that converting CO and CH4 to equivalent H2, then reacting within the cell simplifies analysis while accurately predicting the electrochemical behavior of the fuel cell.
Table 2-1 Electrochemical Reactions in Fuel Cells
Fuel Cell Anode Reaction Cathode Reaction
Proton Exchange
Membrane H2→ 2H
+
+ 2e- ½ O2 + 2H
+
+ 2e-→ H2O
Alkaline H2 + 2(OH)
-→ 2H2O + 2e
-½ O2 + H2O + 2e
-→ 2(OH)
-Phosphoric Acid H2→ 2H
+
+ 2e- ½ O2 + 2H
+
+ 2e-→ H2O
Molten Carbonate
H2 + CO3 =
→ H2O + CO2 + 2e
-CO + -CO3
=
→ 2CO2 + 2e
- ½ O2 + CO2 + 2e
-→ CO3 =
Solid Oxide
H2 + O =
→ H2O + 2e
-CO + O=→ CO2 + 2e
-CH4 + 4O =
→ 2H2O + CO2 + 8e
- ½ O
2 + 2e
-→ O=
CO - carbon monoxide H2 - hydrogen
CO2 - carbon dioxide H2O - water
CO3 =
- carbonate ion O2 - oxygen
e- - electron OH- - hydroxyl ion
H+ - hydrogen ion
equation provides a relationship between the ideal standard2 potential3 (E°) for the cell reaction and the ideal equilibrium potential (E) at other temperatures and partial pressures of reactants and products. Once the ideal potential at standard conditions is known, the ideal voltage can be determined at other temperatures and pressures through the use of these equations. According to the Nernst equation, the ideal cell potential at a given temperature can be increased by operating at higher reactant pressures, and improvements in fuel cell performance have, in fact, been observed at higher pressures (see Sections 3 through 6).
The reaction of H2 and O2 produces H2O. When a carbon-containing fuel is involved in the anode reaction, CO2 is also produced. For MCFCs, CO2 is required in the cathode reaction to maintain an invariant carbonate concentration in the electrolyte. Because CO2 is produced at the anode and consumed at the cathode in MCFCs, and because the concentrations in the anode and cathode feed streams are not necessarily equal, the Nernst equation in Table 2-2 includes the CO2 partial pressure for both electrode reactions.
Table 2-2 Fuel Cell Reactions and the Corresponding Nernst Equations
Cell Reactionsa Nernst Equation
2 2 2
H + ½O → H O1 E = E + (RT/ 2 ) ln [P° H2/ PH O2 ] + (RT/ 2 ) ln [P ]O2
½
2
2 2 2 (c)
2 2 (a)
H + O + CO
H O + CO
½ →
3
E = E + (RT/ 2 ) ln [P / P (P ) ] +
(RT/ 2 ) ln [P (P ) ]
2 2 2
2 2
H H O CO (a) O CO ( )
°
½
c
4
CO + ½O 2 → CO2 E = E + (RT/ 2 ) ln [P° CO/ PCO2] + (RT/ 2 ) ln [P ]O2
½
5
4 2 2
2
CH + 2 O 2 H O