ADOPTION OF INFORMATION MANAGEMENT SYSTEMS AND PERFORMANCE OF ORTHODOX TEA PROJECT IN KENYA TEA
DEVELOPMENT AGENCY
MARTIN MWARANGU
D53/OL/20471/2012
A RESEARCH PROJECT SUBMITTED TO THE SCHOOL OF BUSINESS IN PARTIAL FULFILMENT OF THE REQUIREMENTS FOR THE AWARD OF
DEGREE OF MASTER OF BUSINESS ADMINISTRATION (PROJECT MANAGEMENT) OF KENYATTA UNIVERSITY
ii
DECLARATION
This project is my original work and has not been presented for a degree in any other University
Signature: ... Date: ...
MARTIN MWARANGU REG NO: D53/OL/20471/2012
This project is submitted for examination with my approval as the university supervisor
Signature: ... Date: ...
DR. PAUL K SANG LECTURER
iii
DEDICATION
iv
ACKNOWLEDGEMENT
I am greatly indebted to my supervisor Dr. Paul Sang for his invaluable guidance and enlightening suggestions without which this research proposal cannot be a reality.
I am grateful to all lecturers and colleagues in school of business for their undying support and guidance. My fellow students especially in the management sciences department for their patience guidance and moral support, patience without them I would have struggled to complete this project.
v
TABLE OF CONTENTS
DECLARATION ... ii
DEDICATION ... iii
ACKNOWLEDGEMENT ... iv
TABLE OF CONTENTS ... v
LIST OF TABLES ... x
LIST OF FIGURES ... xi
OPERATIONAL DEFINITION OF TERMS ... xii
ABBREVIATIONS AND ACRONYMS ... xiii
ABSTRACT ... xiv
CHAPTER ONE: INTRODUCTION ... 1
1.1 Background ... 1
1.1.1 Project Performance ... 2
1.1.2 Information Management Systems ... 3
1.1.3 Orthodox Tea Project ... 6
1.2 Statement of the Problem ... 7
1.3 Objectives of the Study ... 8
1.3.1 Broad Objective ... 8
1.3.2 Specific Objectives ... 8
1.4 Research Questions ... 9
1.5 Significance of the study ... 10
1.6 Scope of the study ... 10
1.7 Limitations and Delimitations of the Study ... 10
1.8 Assumptions of the study ... 11
vi
CHAPTER TWO: LITERATURE REVIEW ... 13
2.1 Introduction ... 13
2.2 Theoretical Review ... 13
2.2.1 Technology-Organization-Environment Theory... 14
2.2.1.1 Technological context... 14
2.2.1.2 Organizational context ... 15
2.2.1.3 Environmental context ... 16
2.3 Empirical Review ... 18
2.3.1 System applications and Processes (SAP) Enterprise Resource planning system (SAP-ERP) and performance of orthodox tea project ... 18
2.3.2 Electronic Weighment System (EWS) and performance of orthodox tea project ... 20
2.3.3 Electronic Document Management System (EDMS) and performance of orthodox tea project ... 21
2.3.4 Automated Fleet Management System (AFMS) and performance of orthodox tea project ... 22
2.4 Research Gaps ... 24
2.5. Conceptual framework ... 25
CHAPTER THREE: RESEARCH METHODOLOGY ... 27
3.1 Introduction ... 27
3.2 Research Design ... 27
3.3 Target Population ... 28
3.4 Sampling ... 29
3.4.1 Sample Design ... 29
3.4.2 Sample Size ... 29
3.5 Data Collection Instrument and Procedure ... 30
3.5.1 Questionnaires ... 30
vii
3.6 Pilot Test ... 31
3.7 Validity of the Instrument ... 32
3.7.1 Reliability of the Instrument... 32
3.8 Data Presentation and Analysis ... 33
3.9 Ethical Consideration ... 34
CHAPTER FOUR: RESEARCH FINDINGS AND DISCUSIONS ... 36
4.1 Introduction ... 36
4.2 Response Rate ... 36
4.3 Background Information ... 37
4.3.1 Gender distribution ... 37
4.3.2: Age Distribution in KTDA... 38
4.3.3 Job Designations in KTDA ... 38
4.3.4 The Highest Level of Education Attained ... 39
4.3.5 Department the respondent work ... 40
4.3.6: Length of Service in Years in KTDA ... 40
4.4 ICT Literacy in KTDA ... 41
4.4.1 Employees Training on IMS Systems...42
4.4.2 Use MIS to manage orthodox tea project in KTDA ...42
4.4.3 Provision of right equipment to access the MIS to manage orthodox tea project ... 43
4.4.4 Availability of support when your equipment/MIS systems fail... 43
4.5 Descriptive Statistics ... 44
4.5.1 Extent to which adoption of System applications and Processes (SAP) Enterprise Resource Planning system improved the project performance of orthodox tea project in KTDA ... 44
viii
4.5.3 The effect of adoption of EDMS on the management of orthodox
tea project in KTDA. ... 46
4.5.4 Effect of adoption of Automated Fleet Management System (AFMS) had improved management of transport logistics in Orthodox tea project in KTDA ... 47
4.5.5 Influence of Management Information System on improving performance Orthodox tea project in KTDA... 48
4.6 Inferential Statistics ... 49
4.6.1 Correlation Analysis ... 49
4.6.2: Regression Analysis ... 51
4.6.3 ANOVA Analysis ... 52
4.6.4 Coefficients ... 53
4.7 Rating MIS functions in relation to management of orthodox tea project in KTDA ... 54
4.8 Areas of MIS need to be improved in managing orthodox tea project in KTDA ... 54
CHAPTER FIVE: SUMMARY, CONCLUSIONS AND RECOMMENDATIONS . 56 5.1 Introduction ... 56
5.2 Summary ... 56
5.2.1 Summary on Effects of System Applications and Processes (SAP) Enterprise Resource planning system on performance of orthodox tea project in KTDA ... 57
5.2.2 Summary of Effects of Electronic Weighment System (EWS) on performance of orthodox tea project in KTDA ... 57
5.2.3 Summary of effects of Electronic document management system (EDMS) on performance of orthodox tea project in KTDA ... 58
5.2.4 Summary on Effects Automated Fleet Management System (AFMS) on improving the performance of orthodox tea project in KTDA ... 58
5.3 Conclusion ... 59
ix
5.3.2 Effect of adoption of System Applications and Processes (SAP) Enterprise Resource Planning System on project performance of
orthodox tea project in KTDA ... 59
5.3.3 Effect of adoption of Electronic Weighment Information System (EWS) on performance of orthodox tea project in KTDA ... 60
5.3.4 Effect of adoption of Electronic Document Management System (EDMS) on project performance of orthodox tea project in KTDA ... 60
5.3.5 Effect of adoption of Automated Fleet Management System (AFMS) MIS system on project performance of orthodox tea project in KTDA .. 60
5.4 Recommendations... 61
5.4.1 Recommendation on adoption of MIS and project performance of orthodox tea project ... 61
5.4.2 Recommendations on adoption of System Applications and Processes (SAP) Enterprise Resource Planning system MIS and project performance of orthodox tea project ... 61
5.4.3 Recommendations on adoption of Electronic Weighment Information System (EWS) on improving project performance of orthodox tea project ... 61
5.4.4 Recommendations on adoption of Automated Fleet Management System (AFMS) on improving project performance of orthodox tea project ... 62
5.5 Recommendations for further studies ... 62
REFERENCE ... 63
APPENDICES ... 68
APPENDIX 1: Letter for Introduction ... 68
x
LIST OF TABLES
Table 3.1 Target population ... 28
Table 3.2: Sample population ... 30
Table 3.3: Reliability Results ... 33
Table 4.1: Rate of response ... 36
Table 4.2 Demographic information ... 37
Table 4.3: Age Distribution in KTDA ... 38
Table 4.4: Job designation in KTDA ... 39
Table 4.5: Highest Level of Education ... 39
Table 4.6: Department the respondent(s) work in ... 40
Table 4.7 : Period in (Years) in KTDA ... 41
Table 4.8: Percentage of Employees Trained on IMS Systems ... 42
Table 4.9: Frequency of use of MIS to manage orthodox tea project ... 42
Table 4.10: provision for the right MIS equipment ... 43
Table 4.11: Adequacy of MIS system equipment ... 43
Table 4.12: Availability of support when MIS/ Equipment fail ... 44
Table 4.13: Extent to which adoption of SAP Enterprise Resource Planning system have improved the project performance of orthodox tea project ... 44
Table 4.14: Electronic weighment system improvement on orthodox tea project ... 45
Table 4.15: Effect of EDM system on digitization of documents ... 46
Table 4.16 Importance of AFMS managing transport and logistics ... 47
Table 4.17: The Influence of MIS on improving the performance of Orthodox tea project in KTDA ... 48
Table 4.18: Correlation ... 50
Table 4.19: Coefficient of determination ... 51
Table 4.20: ANOVA... 52
Table 4.21: Coefficients ... 53
xi
LIST OF FIGURES
Figure 2.1 Conceptual framework ... 26
xii
OPERATIONAL DEFINITION OF TERMS
Adoption: Refers to the use of ICT day to day operations in an institution.
Performance: Refers to the degree to which the objectives of an institution have been achieved
Information Management System: Refers to the planned system of collecting, storing and disseminating data in the form of information needed to carry out the functions of management.
Orthodox Tea: Refers to a major export cash crop grown in Kenyan Highlands.
Enterprise Resource Scheduling: Refers to a software solution that integrates business functions and data into a single system
to be shared within a company.
Electronic Weighment: Refers to an electronic devices used to measure weight or mass.
Electronic document management: Refers to the management of different kinds of documents in an organization using computer
xiii
ABBREVIATIONS AND ACRONYMS AFMS - Automated fleet management system
BI - Business Intelligence (Reporting)
EDMS - Electronic document management system
ERP - Enterprise resource planning
EWS - Electronic weighment system
FICO - Financial & control
GP - Grower Payments
HCM - Human Capital Management
IMS - Information Management systems
KTDA - Kenya Tea Development Agency
MM - Material Management
PM - Plant Maintenance
PP - Production planning
SAP - Systems applications and processes
SD - Sales & distribution
xiv ABSTRACT
1
CHAPTER ONE
INTRODUCTION
1.1Background
Performance of the project is considered as a source of concern to both public and private sector clients. Project success requires creating a well-planned project schedule as well as understanding of the key success factors also. It helps the project manager and the stakeholders to take the right decisions and act towards the project success. Most popular determinants of project successes accepted by research community are-project mission, top management support, project schedule plan, client consultation, personnel, technology to support the project, client acceptance, monitoring and feedback, channels of communication, troubleshooting expertise (Serrador & Turnner 2014).
2
between the departments. Fairbank, et al (2006) observed that the organisations both in manufacturing and in provision of services should adopt information management systems into their operations so as to enhance competitiveness and consequently encourage the growth, success and visibility.
Although various organisations have varying information needs, as they try to attain competitive advantage and continuously improve their products and processes they do adopt different information management systems.
1.1.1 Project Performance
Project performance refers to the degree to which results have been achieved (Krzysztof, Potkańsk, & Stanisław, 2011). Indicators of project performance consists
of timeliness, number of deliverables achieved, number of activities, number of satisfied customers and cost of project (Acharya, Kumar, Satyamurti, & Tandon, 2006). Information on all these sub-components of project performance, are interestingly considered at project planning design. During project implementation, all that is done is monitoring whether an activity has been done on schedule and if not evaluation provides a reason why and project management on the other hand can adjust the project plan accordingly.
3
vital significance that projects be adequately managed in organizations so that they can achieve their performance objectives ( Ngari & Ndiritu, 2017).
According to Raymond (2008), it is paramount for organizations to adequately manage their projects if they are to achieve their performance objectives. He further observes that project performance remains highly a problematic endeavor since most projects are either not completed on time or exceed the budget. For instance, the Athens Olympic Games Stadium exceeded its budget by 9 billion Euros while the Canadian Arms Registry was completed 10 years later.
1.1.2 Adoption of Information Management Systems
Information management systems are developed using Information technology to assist people in performing their tasks(Ali, Anbari & Money, 2008). Project Management Information System is an example of these Information Systems and is widely regarded as an important building block in project management. These systems have continued to evolve from just being planning, scheduling and resource management information systems to complex, distributed, multi-functional systems that can easily generate information necessary to make decisions, improve the efficiency of implementation among other functions within life cycle of the project. What sets Project Management Information System apart from other classes of information system is the volatility nature of their usage, context that is project environments, and as such they need to be more customizable in their functionality than most other enterprise information systems (Ali et al, 2008).
4
shareholders who are farmers and also its customers. System applications and Processes (SAP) Enterprise Resource Planning system, Electronic weighing system, Electronic document management system and automated fleet management systems were proposed. The committee of experts was formed to evaluate the viability of the project and by the year 2012, the board of management of KTDA together with the major tea stakeholders and the ministry of agriculture in Kenya unanimously agreed on its implementation. The system roll out commence in 2014.
System applications and Processes (SAP) Enterprise Resource Planning system, was implemented to solve the following challenges that was experienced by the organization in the management of the Orthodox tea project, Reporting challenges where reports meant for decision making cannot be generated real-time, Processes for the diversified business not supported in the old systems, Changing business dynamics e.g. interaction with suppliers and customers at systems level not supported, Consolidation of group business and monitoring /evaluation function through system were not being supported, Compliance with best practice and Support challenges which included The Informix system which went down in may 2015 after a heavy downpour and we could not get support locally. Offshore support did not help either due to unavailability (Aging technology). This involved implementation of the Core SAP ERP with the following functional modules; Financial & control (FICO); Human Capital Management (HCM); Grower Payments( New development) (GP) and Business Intelligence (Reporting)
Electronic document management system was implemented to provide workflow system, for the organization to digitize the orthodox tea project’s manual documents
5
business processes efficiency and reduce cost. The major objective of the system roll out was to digitize and electronically archive manual documents, provide complete and auditable records for decision-making, Real-time notifications and tracking of documents and records, automate, streamline and optimize business processes, eliminates duplication and challenges of lost documentation,enhance security and management of enterprise information, provide complete document and user audit trails, hasten access to related business documents, shorten processes cycle times while enabling better decision making and provide unified view of actions and history related to an issue.
Electronic Weighing System was developed by KTDA in partnership with Virtual City and Amity Inc. to automate the green leaf procurement process meant for the processing of orthodox teas. The initial project phase addressed green leaf weighing, collection and reception. EWS phase one implementation was a successful and celebrated innovation. However, over the passage of time there was a need to enhance features in the EWS concept and address emerging needs, trace-ability; tracking of made tea from the factory to the warehouse, customer satisfaction; through efficient and effective service delivery to the farmers, costs identification and management, reduce falsification; though product monitoring, real time communication, align business with emerging technologies and empower farmers through provision of financial services
6
would minimize idle time, improve vehicle turnaround and minimize leaf collection delays from the field as well as minimize/eliminate fleet misuse by ensuring that fleet is only used for the designated and approved purposes. Also control driving beyond approved speed limits and minimize vehicle wear/tear associated with bad driving habits and also eliminate manual keying of data hence help minimize chances of data manipulation.
1.1.3 Orthodox Tea Project
Green orthodox and green CTC teas were first processed on experimental basis in the month of December 2003 and later on produced for commercial basis. The services of Mr. David Walker and Charles K. Wang’oe both of Tea Technology Associates were engaged. The first trial run processing was on 7th March 2002 and the rotor vane orthodox style of manufacture was used. Green orthodox and green CTC teas were first processed on experimental basis in the month of December 2003 and later on produced for commercial basis. Construction of the TVAP current facility commenced in earnest from the month of April 2002 in the three factories and the first orthodox machinery installation followed and was completed by mid January 2003.
7
have great potential. The character of grades is affected by the standard of green leaf used in manufacture. Fine plucking, to a high standard of two leaves and a bud, makes for tea of good appearance and liquor. Correct and skillful withering, rolling, fermentation and firing also play a critical part in the teas overall quality. Orthodox tea is rolled as opposed to cut in CTC type tea. Orthodox tea is for markets where tea is taken without milk/cream. Orthodox tea is leaf teas and mostly sold as loose teas as opposed to CTC teas that are mostly in teas bag. All green teas are not oxidized and are at times referred to as unoxidized teas. Green teas may be processed in orthodox or CTC styles. Purple tea is made from a recently released clone of tea rich in athocynins. To maximize on the value of the athocynins purple tea is processed like green tea.
1.2 Statement of the Problem
Performance of the project has always been an important and critical issue for any
business worldwide. The Orthodox Tea Projects often experience poor performance in
8
direct relationship between IMS, competitive advantage and organization performance. Fairbank et al. (2006) suggested that the information management systems performance relationship is so complex that the answer may well hinge upon examinations of practices and procedures within certain companies.
Empirical evidence shows that very little effort has been put to establish and explain the influence of information management systems on the performance of orthodox tea project implemented by Kenya Tea Development Agency in Kenya. There is unjustifiable knowledge that IMS is cost centers in organizational project. For the last ten years, KTDA has invested heavily on information management systems such as Electronic weighment system to automate orthodox tea project leaf buying in factories, Electronic document management system to achieve a paperless office, automated fleet management system for vehicle tracking and fuel monitoring and others, SAP-ERP for integrating various business processes at the factories which have cost the shareholder millions of money. A host of benefits have been realized out of these projects but there has been raging debate over whether the overall organizational project efficiency has been achieved.
1.3 Objectives of the Study
1.3.1 General Objective
The general objective of this study was to assess the effect of adoption of information management systems on the performance of orthodox tea project in Kenya Tea Development Agency.
1.3.2 Specific Objectives
9
i. To determine the influence of adoption of System Applications on Processes (SAP) Enterprise Resource Planning on performance of orthodox tea project in Kenya tea development agency.
ii. To assess the influence of adoption of Electronic Weighment on performance of orthodox tea project in Kenya tea development agency.
iii. To establish the effects of adoption of Electronic Document Management on performance of orthodox tea project in Kenya tea development agency.
iv. To evaluate the influence of adoption of Automated Fleet Management on performance of orthodox tea project in Kenya tea development agency.
1.4 Research Questions
i. What is the influence of adoption of System Applications and Processes Enterprise Resource Planning information system on performance of orthodox tea project in Kenya tea development agency?
ii. What is the influence of the adoption of Electronic Weighment Information System project on performance of orthodox tea project in Kenya tea development agency?
iii. What is the effect of the adoption of Electronic Document Management Information System on performance of orthodox tea project in Kenya tea development agency?
10 1.5 Significance of the study
The study will be beneficial to the directors, board of trustee and the management staff of Kenya Tea Development Agency as they use information management systems in implementing Orthodox tea project. Further, the study will be useful to other organizations in agricultural sector that have adopted IMS in the management of their projects. The study would assist them when implementing MIS systems in their organizations.
The study was also beneficial to researchers as it would provide them with a background for conducting research related to the subject in future with the aim of providing detailed insights. Students and other academicians would also get a platform to pursue the subject in awards of various academic awards and qualifications.
1.6 Scope of the study
The scope of the study focused on IMS such as SAP-ERP, EWS, EDMS and AFMS that were implemented within the First phase of the Orthodox tea project. Secondly, the study was conducted in Kirinyaga County where the Orthodox tea project was based.
1.7 Limitations and Delimitations of the Study
11
some designated staff as well as receiving their response. Managers were mostly tied up in meetings while designated staff especially in logistic and ICT department spent most of their time in the field. The researcher had to request the human resource department to assist, send the questionnaire online via email and also exercised a lot of patience. Some respondents misplaced the questionnaire and the researcher or his assistance had to reissue hence increasing the cost and time taken in data collection. Some respondents were unwilling and very uncooperative to answer the questionnaire. This was overcome by using convincing them the questionnaire was only meant for academic purposes.
1.8 Assumptions of the study
The researcher made the following assumptions:
i. That the respondents provided honest responses to the items in the questionnaire.
ii. That there is poor performance of projects within Orthodox Tea Project.
iii. That adoption of information management system had the ability to improve project performance.
1.9 Organization of the study
12
Chapter Two presents review of related literature as per the objectives of the study namely; including adoption of System Applications and Processes (SAP) Enterprise Resource Planning information system, adoption of Electronic Weighment Information System, adoption of Electronic Document Management Information System and adoption of Automated Fleet Management Information System on project performance of orthodox tea project in Kenya tea development agency. Further, the chapter entails theoretical framework, conceptual framework and research gaps in the reviewed literature.
Chapter Three encompasses research design, target population, sample size and sampling technique, research instruments, instrument validity, instrument reliability, data collection procedure and analysis techniques.
Chapter Four comprises research findings and discussions.
13
CHAPTER TWO
LITERATURE REVIEW
2.1 Introduction
This chapter reviews scholarly work on issues relating to the relationship between IMS and the performance of projects implemented by various organizations. The section examined various relevant theories which relates to independent and dependent variables under the study. Critical empirical review was conducted. Conceptual framework was developed to show the relationship between the independent and dependent variable and also looks at the research gaps.
2.2 Theoretical Review
14
decline in market share or profits or both. They argued many firms within the industry concentrates on improving their IT infrastructure more than their products hence compromising the quality of their products.
2.2.1 Technology-Organization-Environment Theory
Technology-Organization-Environment (TOE) was developed by Tornatzky and Fleischer’s in (1990). According to the TOE theory, there are three separate contexts
that influence the adoption and implementation of technological innovations in a business set up, namely; technological context, organizational context and environmental context.
2.2.1.1 Technological context
Technological context describes both internal and external technologies that are relevant to the firm (Tornatzky & Fleischer, 1990). Internal technologies relate to practices and technologies which have been embraced by the firm. External technologies refer to the set of technologies available on the market. This implies that the focus of the technological context is about how technology characteristics themselves influence the adoption process. In discussions on the decisions about the adoption of innovative technologies, Rogers (1983) posits that organizations typically assess five characteristics of the technologies, including compatibility, complexity, observability, trialability and relative advantage. Tornatzky and Klein (1982) also identified the above five characteristics in their meta-analysis study of 75 prior studies on innovation adoption. Although these five attributes were usually considered as technological factors affecting firms’ decision on adopting new technologies, the
15
and Tam (1997) as well as Kuan and Chau (2001) solely included relative advantage and operationalized it into two dimensions of perceived benefits in their studies of the adoption of EDI systems by small organizations. Perceived direct benefits refer to the recognition of improvements on the internal functioning of an organization apparent in everyday activities, such as improving operation efficiency, improving data accuracy and reducing clerical errors.
Perceived indirect benefits relate to the recognition of improvements in external relationships with customers and competitors, which include improving customer services, relationships with business partners and competitive advantage. In the context of the present study, improving operational efficiencies and customer satisfaction have long been the key contributing factors for survival and success in the long term (Jones, 1999). Since ICT offers various tools to improve employee performance, enhance business coordination, enhance customer satisfaction and increase market share (Karadag, Cobanoglu, & Dickinson, 2009), it can be assumed that the acknowledgement of both direct and indirect benefits offered by ICT is also an important driver of initial and continued adoption of ICT.
2.2.1.2 Organizational context
16
organizations, Iacovou, Benbasat, and Dexter (1995) added that two dimensions of organizational readiness, which are financial readiness and technological readiness, are of particular significance to an organization’s adoption of technology innovation.
Financial readiness refers to the financial resources available for installing and implementing the technology, while technological readiness is related to the level of sophistication of technology usage and management in a firm (Iacovou et al., 1995). Swatman and Swatman (1992) found that the availability of financial resources within an organization is a fundamental ingredient that drives the adoption of innovative technologies. Kuan and Chau (2001) also reported that perceived technical competence, which is conceptually the same as technological readiness, is relatively higher among those adopter firms than non adopter firms. Drawing on the findings from previous studies, it can be postulated that financial readiness and technological readiness are determinants affecting ICT adoption and usage in an organization.
In addition to organizational readiness, top management support is another facilitator of the organizational adoption of ICT (Racherla & Hu, 2008; Wang et al., 2010). Thong (1999) noted that top management can stimulate change by communicating and reinforcing value and articulating vision for the organization. Lee and Kim (2007) also argued that the vision, support and commitment by top management can effectively create a supportive climate for technological innovation.
2.2.1.3 Environmental context
17
external forces. Perceived pressure from industry, denoting the level of technological capability of the firm’s industry as well as its competitors, has been identified as the
most important technological factor of technology adoption (Fuchs, Höpken, Föger, & Kunz, 2010; Ramdani et al., 2013; Wang et al., 2010).
Wang and Qualls (2007) suggested that competitor-oriented firms often feel pressured when they see more competitors in the industry adopting the technology. To maintain their competitive position and avoid lagging behind their competitors, this type of firm typically recognizes the need and has a higher intention to adopt new technologies. Several studies found that pressure from trading partners would influence a firms’ inclination to adopt new technologies (Grandon & Pearson, 2004;
Hong & Zhu, 2006). Iacovou et al. (1995) described three strategies that powerful partners may pursue to induce their small partners to adopt new technologies. Recommendation strategy means providing small partners with information describing what they can benefit from. Promise strategy refers to convincing small partners to follow their technological strategies via the provision of incentives. Threat strategy represents the application of negative sanctions if small partners do not follow their technological strategies.
18
and ease of use information management systems can impact on performance of orthodox tea project in Kenya Tea Development Agency.
2.3 Empirical Review
The independent variables of the study are; System applications and Processes (SAP) Enterprise Resource Planning system (SAP-ERP), Electronic weighment system (EWS), Electronic document management system (EDMS) and automated fleet management system (AFMS). These independent variables collectively or single contribute to the performance of orthodox tea project in Kenya Tea Development Agency (KTDA). Performance of orthodox tea project in KTDA managed tea factories in Kirinyaga County in Kenya is the dependent variable of the study. Several researchers have undertaken several studies on these independent variables as outlined below;
2.3.1 System applications and Processes (SAP) Enterprise Resource planning system (SAP-ERP) and project performance
19
customers order hence achieving greater customer satisfaction and loyalty. Gupta et al. (2004) and Galbraith, J. R. (2010), also concurred with Kogut B. and Zander U. (2003) that SAP-ERP system also increases efficiency and effectiveness in transfer of information and reduces lead time in delivery of the products hence providing more customer satisfaction.
Although a lot of existing literature seems to agree ERP improves performance, some scholars still express some concern. Hitt et al. (2002) argued in some cases there have been notable drop in performance in pre and post implementation of EPS system. Authors such as Montverde, K. and Teee, D. J. (1992), tried to give a reason to this by suggesting that in services-sector business (like financial institutions, transport (airlines)) they adopt ERP system with anticipation to gain more effectiveness than efficiency. Therefore quality of information and business processes might not be of great importance as compared to reduction of cost and increasing productivity. Huang, et al. (2009), suggested ERP system may result to negative relationship between the quality of the product if business enterprise uses efficiency and productivity measurements to evaluate the impact of ERP in the organization. This have negative effect to the general performance of the enterprise in the market because customers’ satisfaction will be compromised resulting to customer churn.
20
some specific areas- such as departments, sections and operations in the organization but not the overall project performance.
System applications and Processes (SAP) Enterprise Resource Planning system, was implemented to solve the following challenges that was experienced by the orthodox tea project; Reporting challenges where reports meant for decision making cannot be generated real-time, Processes for the diversified business not supported in the old systems, Changing business dynamics for example interaction with suppliers and customers at systems level not supported, Consolidation of group business and monitoring /evaluation function through system not supported, Compliance with best practice and Support challenges which included The Informix system went down in may 2015 after a heavy downpour and we could not get support locally. Offshore support did not help either due to unavailability (Aging technology). This involved implementation of the Core SAP ERP with the following functional modules; Financial & control (FICO); Human Capital Management (HCM); Material Management(MM); Production planning(PP); Plant Maintenance (PM); Sales & distribution (SD); Grower Payments( New development) (GP) and Business Intelligence (Reporting)
2.3.2 Electronic Weighment System (EWS) and project performance
21
productivity. In this system, the data is usually transmitted instantly through mobile virtual private network, and also via Personal Data Assistant (PDA) to the farmer’s factory. A printer relying on Bluetooth transmission spot churns out a receipt for the farmer at real-time. AKS Amity therefore eludes to the fact that electronic weighment of green leaf, therefore, helps in increasing productivity.
2.3.3 Electronic Document Management System (EDMS) and project performance
Hung et al, (2009), commented most private organizations and government institutions all over the world are now developing and adopting information technology to keep abreast with progression of information technology development as well as offer satisfactory products and services to their clients. Dashmir, I. et al. (2013), suggested that, government agencies are adopting and implementing IT with aim of delivering better services to the citizen and businesses and customers; as well as to support the modernization of their institution and businesses respectively. Electronic Document Management Systems (EDMS) is being adopted by the organizations to enable them improve in convenience, efficiency and provide quality services to the citizen, customers and any other stakeholder (Jones, 2012).
22
memory of the organization. They further added well-kept documents are a clear signal that the organization understand how the business is done, its operations, its customers, competitors as well as the environment in which it is operating in. Information/document management is the primary mechanism of conducting business and it is central to its functioning.
Electronic Document Management System facilitates to advancement the management of information, thereby improving the levels of support and productivity for managers, speeds up communications, increases the productivity of business processes, and improving the flow of information. Electronic Document Management System is a virtual constituent in creating a virtual working environment and transforming capabilities of an organisation and its workforce (Fairbank, et al. 2006). Benjamin, R. et al. (1996), noted that the organizations which had adopted EDMS are able to monitor its activities, reduces a lot of cost associated to paperwork and information is available on time. Hence this improves efficiency in the organization.
23
rules of competition in the market place. Automated fleet management system may offer new value-added and integrated services that previous paper-based fleet or transport management could not. Secondly, automated fleet management system may create relative competitive advantage in terms of efficiency, effectiveness and the cost hence giving the firm a new competitive edge. Automated fleet management system which is implemented through ICT systems does ultimately call for need to change the existing organization structure and processes. It rather facilitates execution of business operations within the current business model.
24
efficiency through the ongoing implementation of information or automation technologies in accordance with their business characteristics.
Overally Pokharel (2009) summarises the influence of IMS adoption by asserting that they perform a supplementary and supportive role to employees activities, enhances organisational efficiency and effectiveness. According to Delone, W., and McLean, E. (1992), IMS also helps the employees to execute their activities faster, supports management in decision making processes, enables efficiency in distributive operations and achieves higher logistics efficiency. Petter, S. and McLean, E. R. (2013) added that IT also improves transparency to the stakeholders and leads to the adoption of better business practices to meet the customer service levels. IMS increases organisational ability to respond to a dynamic business environment and reduces the cost of organization operations by as much as 40% over traditional practices.
2.4 Research Gaps
The literature reviewed showed that the advent of high-tech ICT technologies has created room for adoption of the technologies in various aspects of organizational and project management. While the main challenge of the modern organization projects implementation alongside the myriad operations that go along with the organization’s existence is to improve efficiency and cut costs of operations, strategies adopted by any organization should be aligned toward achievement of efficiency in operations.
25
leaving a great gap in the specific influence of information technologies to the specific organisational setting.
In spite the importance of how the Information Management Systems or changes in technology affect project performance to various stakeholders, studies are not precise on what is known or unknown about the subject. Past studies and theories indicate varying conclusions on relationship between Information Technology and project performance. Some studies shows negative relationship while others positive. Therefore, it is imperative to investigate how the technologies impact the project in light of the fact that organizations are increasingly adopting the IT-based platforms with the hope that the move will have a positive impact on the various target processes.
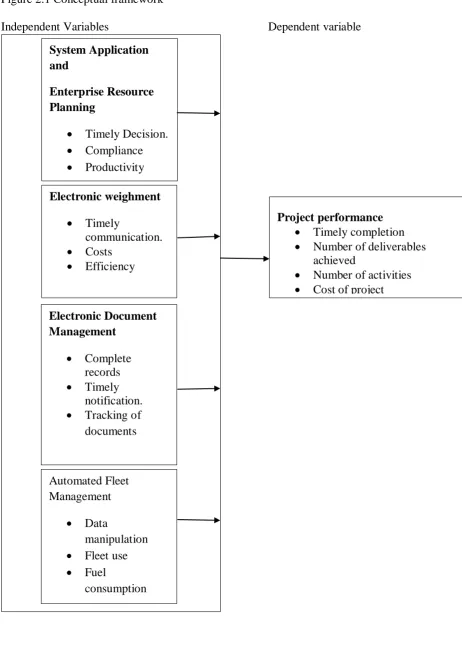
2.5. Conceptual Framework
The aim of the study was to analyse the influence of information management systems on implementation and performance of orthodox tea project in KTDA in Kenya. This therefore forms independent variables which include; SAP-ERP, EWS, EDMS and AFMS information management systems where any change in one may result in change in the dependent variable which is performance of orthodox tea project.
26 Figure 2.1 Conceptual framework
Independent Variables Dependent variable Dependent Variable Electronic Document Management
Complete records Timely
notification. Tracking of
documents
Automated Fleet Management
Data
manipulation Fleet use Fuel
consumption
Project performance Timely completion Number of deliverables
achieved
Number of activities Cost of project Number of satisfied
customers System Application
and
Enterprise Resource Planning
Timely Decision. Compliance Productivity
Electronic weighment Timely
communication. Costs
27
CHAPTER THREE
RESEARCH METHODOLOGY
3.1 Introduction
This chapter describes the methodology of the study. The researcher critically discusses the research design, the target population, the research site, target population, sampling methods and sample size. It also focuses on data collection instruments, data collection procedure, data analysis and presentation testing the data collection instrument for reliability and validity as well as the ethical considerations. The research was carried out at Kenya Tea Development Agency headquarters and managed tea Factories in Kirinyaga County in Kenya.
3.2 Research Design
28
According to Yousaf (2018), explanatory research design focuses on explaining the aspects a study in a detailed manner. It is meant to provide details where a small amount of information exists for a certain product in mind of that researcher.
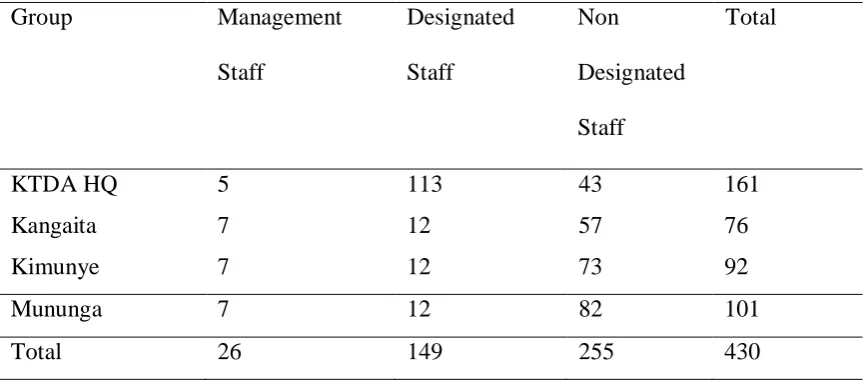
3.3 Target Population
The target population comprised of 430 employees of KTDA Headquaters and three KTDA managed tea factories in Kirinyaga County. Specifically, the target population comprised of 26 members of management, 149 designated staff and 255 non-designated staff of KTDA head quarters and managed tea factories in Kirinyaga County
Table 3.1: Target population
Group Management
Staff
Designated Staff
Non Designated Staff
Total
KTDA HQ 5 113 43 161
Kangaita 7 12 57 76
Kimunye 7 12 73 92
Mununga 7 12 82 101
Total 26 149 255 430
29 3.4 Sampling
3.4.1 Sample Design
Cooper and Schindler (2003) referred sampling design as the method which the researcher would use to select the respondent. Sampling is done if the elements target population is big in number. Neuman (2004) argued that the best sample design should select a sample which is a true representative of the whole target population. He also suggested the important factor to consider in determining the sample size is the need to keep it manageable enough, derive detailed data using available and affordable resource in terms of cost, time, and human resource. A sample of 30% of a population was selected. Cooper and Schindler (2006) argued that well-chosen sample of 30 percent was ideal in a descriptive design research study especially if the target population is not too large. In this study a multistage sampling method was adopted. McQueen & Knussen (2010) says multistage sampling combines several methods of sampling. In this study, the researcher used stratified and simple random sampling methods. In this case the staff from the head office and three factories from Kirinyaga County were subdivided into management, designated staff or non-designated staff. Out of each Stratum, simple random sampling using random numbers was used to select the respondent.
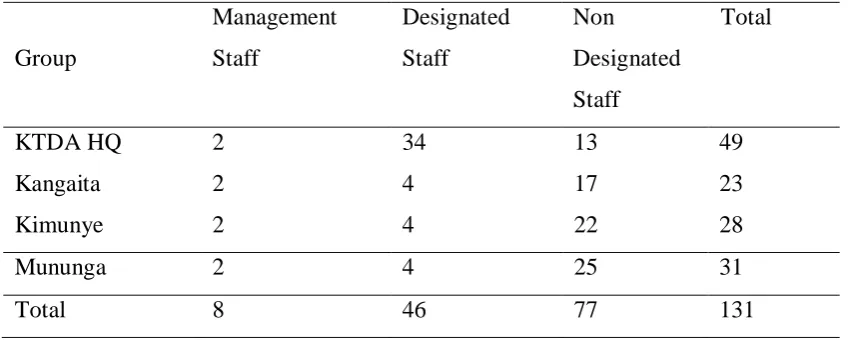
3.4.2 Sample Size
30
17 from Kangaita, 22 from Kimunye and 25 Mununga tea factories.
Table 3.2: Sample population
Group
Management Staff
Designated Staff
Non Designated Staff
Total
KTDA HQ 2 34 13 49
Kangaita 2 4 17 23
Kimunye 2 4 22 28
Mununga 2 4 25 31
Total 8 46 77 131
(Source: Researcher 2018)
3.5 Data Collection Instrument and Procedure
3.5.1 Questionnaires
31
questionnaire response rate of 50% is adequate for analysis and reporting; 60% is good and 70% and over is excellent.
3.5.2 Data Collection Procedure
Before the collection of the data, the researcher requested for an official letter from Kenyatta University to acknowledge he was a student carrying on research project. The letter was presented to KTDA headquarters Human Resource division for permit and authorization letter to collect the data. Printed copies of questionnaires were distributed to eligible persons through the head of departments to respective KTDA managed tea factories and the head office in Nairobi. The factory manager and respective departmental heads at head office also helped to distributed questionnaires to employees of their factories.
3.6 Pilot Test
To establish validity, the research instrument was given to at least three professionals who were experienced in training need assessment to examine the relevance of each item/question in the questionnaire in relation to the objectives. The aim was to ensure that the data was collected from reliable sources; the language used in the questionnaire was simple with no ambiguity and misunderstanding. The questionnaires were given to at least 10 employees who were chosen randomly and not included in the study before the official roll out. The aim was to test relevance and consistence of each item in the data collection instrument. This also enabled the researcher to establish the respondents’ ability to respond without difficulties. Any
32 3.7 Validity of the Instrument
Hafeznia, (2009), defined validity as the degree to which result obtained from the analysis of the data from the data collection instrument(s) actually represents the phenomenon under study According to Kothari (2004), this can also be referred as the meaningfulness, accuracy and the true reflection of the variables from the data collected. The researcher used content validity to test the suitability for the questionnaire. It measured the degree to which data collected using a questionnaire represented a specific domain or content of a particular concept (Miles & Humerman, 1994). To ensure content validity the researcher used content validity index (CVI). CVI was obtained by summing up items rated 4 and 5 and dividing the aggregate with the total number of all items in the questionnaire. Kothari (1992) noted a questionnaire with validity coefficient of at least 0.7 is a valid research instrument for collecting the data. The researcher also used experts to examine and review the instrument for validity.
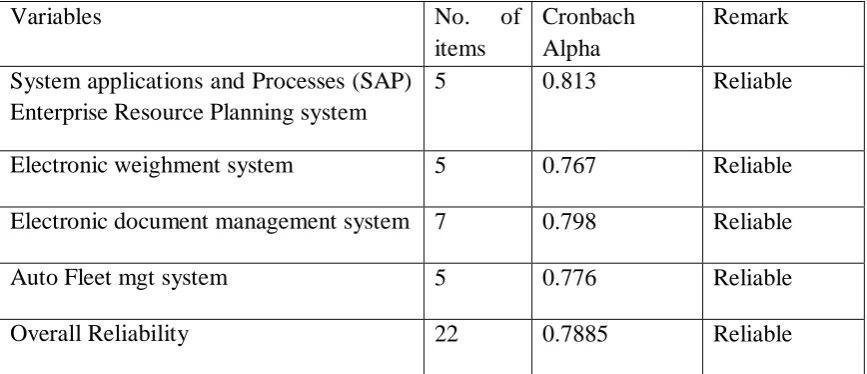
3.7.1 Reliability of the Instrument
Reliability refers to a measure of the degree to which research instruments yield consistent results (Hafeznia, M. D. R. (2009). The researcher used Cronbachs alpha coefficient to assess the internal consistency among research instrument items. Cronbach’s alpha was calculated by SPSS application. According to Cooper &
33 Table 3.3: Reliability Results
Variables No. of
items
Cronbach Alpha
Remark
System applications and Processes (SAP) Enterprise Resource Planning system
5 0.813 Reliable
Electronic weighment system 5 0.767 Reliable
Electronic document management system 7 0.798 Reliable
Auto Fleet mgt system 5 0.776 Reliable
Overall Reliability 22 0.7885 Reliable
Source: (Research data, 2018)
As indicated in table 3.3, reliability coefficient of all variables of the study were more than 0.7 as recommended by Collis and Hussey (2014).
3.8 Data Presentation and Analysis
34
This study used multiple regression equation to establish the relationship between the Information management systems’ project and organizational operation performance in KTDA.
The multiple regression equation was;
Y = β0 + β1X1 + β2X2 + β3X3 + β4X4 +ε
Where Y is the dependent variable (project performance), β0 is the regression constant, β1, β2, β3, and β4 are the coefficients of independent variables.
X1 is System applications and Processes (SAP) Enterprise Resource Planning information system project
X2 is Electronic weighment information system project
X3 is Electronic document management information system project
X4 is automated fleet management information system project
ε is the error.
3.9 Ethical Consideration
35
36
CHAPTER FOUR
RESEARCH FINDINGS AND DISCUSIONS
4.1 Introduction
This chapter presents data analysis and presentation. Quantitative methods such as descriptive analysis, inferential statistics and ANOVA were used to analyze quantitative data while content analysis was used to analyze qualitative data. The data is presented in tables and graphs.
4.2 Response Rate
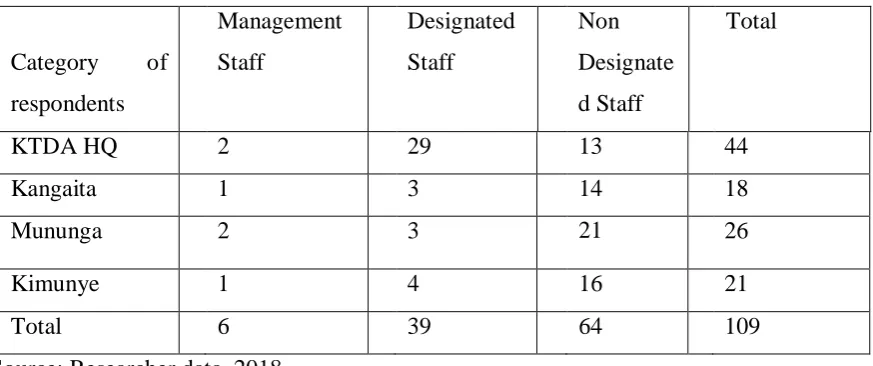
The study targeted 131 respondents; 49 were from headquarters, 23 from Kangaita, 28 from Mununga and from 31 Kimunye. They were sampled from the management staff (8), designated Staff (46) and non-designated Staff (77). The number of response was as tabulated below.
Table 4.1: Rate of response
Category of respondents
Management Staff
Designated Staff
Non Designate d Staff
Total
KTDA HQ 2 29 13 44
Kangaita 1 3 14 18
Mununga 2 3 21 26
Kimunye 1 4 16 21
Total 6 39 64 109
Source: Researcher data, 2018
37
were rejected because they were neither consistent nor complete hence were not suitable for analysis. Hence 109 questionnaires, approximately 83% were analyzed. 44 were from KTDA headquarters staff, 18 from Kangaita tea factory, 21 and 26 from Kimunye and Manunga tea factories respectively. 6% of all the respondents were from KTDA management staff, 39 respondents representing 36% were designated staff and 64 representing 58% were non-designated staff.
4.3 Background Information
This section analyzed the profile of the respondents such as the gender, age, highest level of education, job designation, department they work in and the period of time in years one have worked in KTDA headquarters or in tea factories.
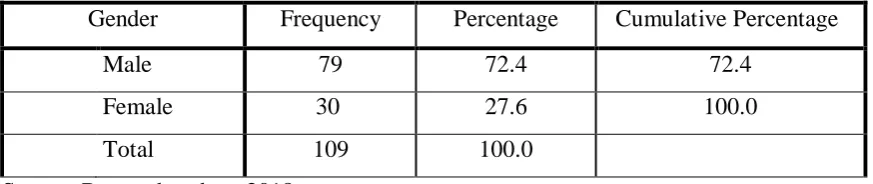
4.3.1 Gender distribution of Respondents
The researcher requested the respondents to indicate their gender. The aim was to ascertain whether there was fair demographic representation of male and female in the study as well as identify gender distribution in KTDA.
Table 4.2 Demographic information
Gender Frequency Percentage Cumulative Percentage
Male 79 72.4 72.4
Female 30 27.6 100.0
Total 109 100.0
Source: Researcher data, 2018
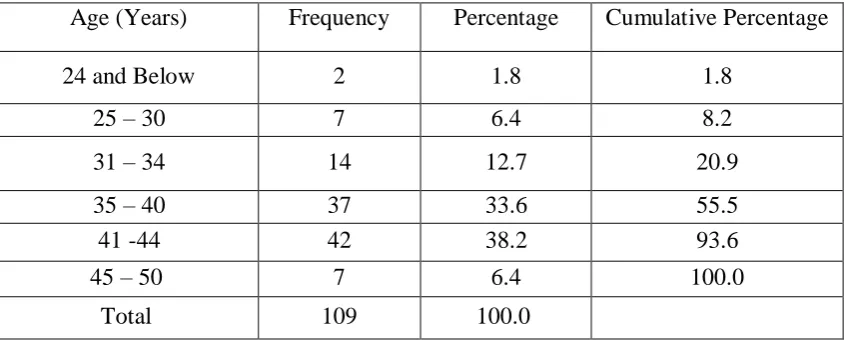
38 4.3.2: Age Distribution of Respondents
The researcher strived to find out the age distribution in KTDA.
Table 4.3: Age Distribution in KTDA
Age (Years) Frequency Percentage Cumulative Percentage
24 and Below 2 1.8 1.8
25 – 30 7 6.4 8.2
31 – 34 14 12.7 20.9
35 – 40 37 33.6 55.5
41 -44 42 38.2 93.6
45 – 50 7 6.4 100.0
Total 109 100.0
Source: Researcher data, 2018
Table 4.3 above show age distribution of respondents in KTDA. 1.8% of the respondents were 24 years and below. 6.4% were between 25 to 30 years, 12.7% between the age of 31 to 34 years, 33.6% between 35 to 40 years, and 38.2% were aged between 41 to 44 years and 6.4% were between 45 to 50 years. None of the respondent was 50 of age and above years. From the table above, majority of the respondents were between the ages of 31 to 44 years representing 74% of all the respondents. This is an indication that KTDA does not retain most of its employees for long.
4.3.3 Job Designations of Respondents
39 Table 4.4: Job designation in KTDA
Source: Researcher Data, 2018
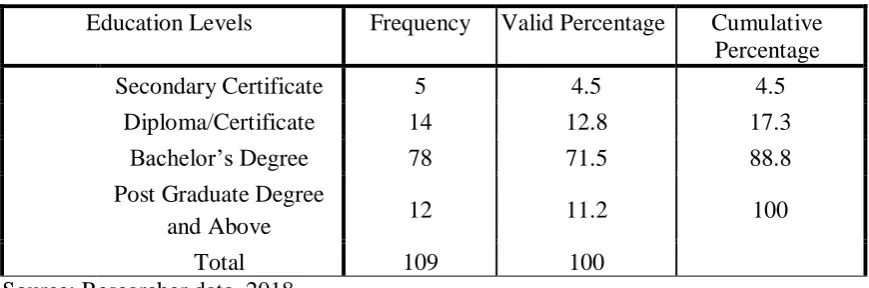
4.3.4 The Highest Level of Education Attained by Respondents
The researcher sought to identify the highest level of education attained by the respondents. This was important for the researcher to establish the ability of the respondents to read and interpret the questionnaire appropriately as well provide accurate answers. It was also vital in provision of the level of literacy of employees in KTDA.
Table 4.5: Highest Level of Education
Education Levels Frequency Valid Percentage Cumulative Percentage
Secondary Certificate 5 4.5 4.5
Diploma/Certificate 14 12.8 17.3
Bachelor’s Degree 78 71.5 88.8
Post Graduate Degree
and Above 12 11.2 100
Total 109 100
Source: Researcher data, 2018
Table 4.5 above, shows that 4.5% of the respondents had attained Kenya Certificate of Secondary Education, 12.8% Certificates and Diploma courses, 71.5% had bachelor’s degree and 11.2% post graduate degree and above. All the respondents who filled the Job Designation Frequency Valid Percent Cumulative
Percent
KTDA Management 6 5.5 5.5
KTDA Designated staff 39 35.8 41.3
KTDA Non Designated staff 64 58.7 100.0
40
questionnaires had attained Secondary school certificate and above. Hence they were literate and had ability to read, write, interpret and answer the questionnaire precisely.
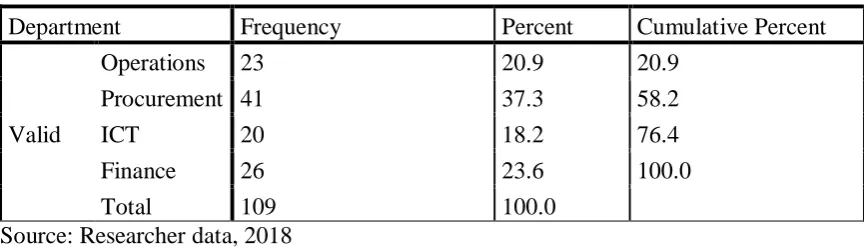
4.3.5 Department the respondent work
The researcher had targeted all the departments in KTDA that uses MIS systems to run and manage operations of orthodox tea project. Hence he had requested the respondents the department which they work to ascertain whether MIS systems were used in the whole organization.
Table 4.6: Department the respondent(s) work in
Department Frequency Percent Cumulative Percent
Valid
Operations 23 20.9 20.9
Procurement 41 37.3 58.2
ICT 20 18.2 76.4
Finance 26 23.6 100.0
Total 109 100.0
Source: Researcher data, 2018
From the table 4.6 above indicates that approximately 21% of respondents were operations department, 37% procurement department, 18% and 24% from ICT and finance departments respectively. Hence researcher was able to get response from all the departments that were targeted. This implies that KTDA has employed few individuals in the ICT section and therefore it is likely to interfere with the adoption of IMS in the management of projects in the firm.
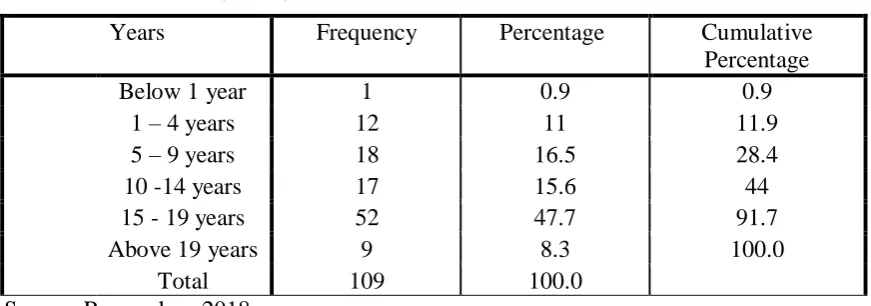
4.3.6: Length of Service in Years in KTDA
41
The table 4.7 below shows that 0.9% of the respondents had worked in KTDA for a period below 1 year. 11% between 1 to 4 years, 16.5% had worked between 5 to 9 years, 15.6% between 10 to 15 years, 47.7% between 15 to 19 years and 8.3% above 19 years. From the above tabulation, most of the respondents (71.6%) had worked in KTDA for more than 10 years and 88.1% for more than 5 years. Hence they were familiar with this the operations and MIS systems used in KTDA.
Table 4.7 : Period in (Years) in KTDA
Years Frequency Percentage Cumulative
Percentage
Below 1 year 1 0.9 0.9
1 – 4 years 12 11 11.9
5 – 9 years 18 16.5 28.4
10 -14 years 17 15.6 44
15 - 19 years 52 47.7 91.7
Above 19 years 9 8.3 100.0
Total 109 100.0
Source: Researcher, 2018
4.4 ICT Literacy in KTDA
42 4.4.1 Employees Training on IMS Systems
Table 4.8: Percentage of Employees Trained on IMS Systems
SAP (%) EDMS (%) EWS (%) AFMS (%)
Yes 92.7 89.8 97.3 84.5
No 7.3 10.2 2.7 15.5
Total 100 100 100 100.0
Source: Author, 2018
Table 4.8 above shows 93% had been trained on SAP Enterprise resource planning; only 7% had not trained. 89.8% had been trained on Electronic document management system (EDMS) and 10.2% not trained. 97% had been trained on Electronic Weighment System (EWS) and 2.7% were not trained. Automated Fleet Management System (AFMS) had 84.5% of the respondents being trained and only 15.5% not being trained.
4.4.2 Use MIS to manage orthodox tea project in KTDA
The researcher aimed at finding out how often the respondents use IMS systems in the course of performing their duties.
Table 4.9: Frequency of use of MIS to manage orthodox tea project
Source: Researcher Data, 2018
Table 4.9 above shows 82.5% of the respondents uses MIS systems to manage orthodox tea project daily, 11% and 6.5% uses the systems on weekly and monthly basis respectively.
Frequency Percent Cumulative Percent
Daily 90 82.5 82.5
Weekly 12 11 93.5
Monthly 7 6.5 100.0
43
4.4.3 Provision of right equipment to access the MIS to manage orthodox tea project
The study sought to establish whether KTDA facilitate in provision for the right equipment to manage orthodox tea project.
Table 4.10: provision for the right MIS equipment
Frequency Percent Cumulative Percent
Yes 106 96.4 96.4
No 4 3.6 100.0
Total 109 100.0
Source: Researcher data, 2018
Tables 4.10 above indicated that 96.4% of the respondents had been provided with the right MIS equipment to manage orthodox tea project. 3.6% responded they had not been provided with the equipment. 89.1% of the respondents further agreed that MIS equipment provided were sufficient to manage orthodox tea project while 10.9 responded they were not adequate as indicated in table 4.11.
Table 4.11: Adequacy of MIS system equipment
Frequency Percent Cumulative Percent
Yes 98 89.1 89.1
No 12 10.9 100.0
Total 109 100.0
Source: Researcher data, 2018
4.4.4 Availability of support when your equipment/MIS systems fail
44
Table 4.12: Availability of support when MIS/ Equipment fail
Frequency Valid Percent Cumulative
Percent
Yes 99 90.0 90.0
No 11 10.0 100.0
Total 109 100.0
Source: Researcher data, 2018
From tabulation above, 90% of the respondents agreed they always receive support if MIS system and equipment(s) fail while 10% indicated the support is not always available.
4.5 Descriptive Statistics
4.5.1 Adoption of System applications and Processes (SAP) Enterprise Resource Planning system and project performance
The study aimed at establishing the extent to which System applications and Processes (SAP) Enterprise Resource Planning system had improved the performance of orthodox tea project. A likert scale of 1-5 was used with 5 representing extremely great extent; 4-Great extent; 3-Moderate extent; 2- low extent and 1- I don’t know.
Table 4.13: Extent to which adoption of SAP Enterprise Resource Planning system have improved the project performance of orthodox tea project
Generatio n of real-time decision
Interaction with suppliers and customers at systems level.
Consolidation of group business
through system
Complian ce with best practice
Monitoring/evalu ation function of the business operation
109 109 109 109 109
45
Table 4.13 shows System Application and Processes-Enterprise Resource Planning had improved the performance of orthodox tea project on the following functions. Generation of real time decision had mean of 3.15 and standard deviation 0.91646; interaction with suppliers and customers had mean of 3.0257, standard deviation 0.98312; consolidation of group of businesses through MIS system mean of 3.2143, and standard deviation of 0.84619; compliance with the best practice had mean of 4.74 with standard deviation of 0.97864 and monitoring/evaluation of business operation had mean of 4.2956 with standard deviation of 0.77815. Hence SAP-ERP had contributed to great extent to the improvement of the performance of orthodox tea project.
4.5.2 Adoption of Electronic weighment system (EWS) and Project Performance
The study sought to identify the extent Electronic Weighment System had improved the performance of orthodox tea project in KTDA in various related functions listed in the table 4.14 below. A likert scale of 1-5 was used with 5 representing extremely great extent; 4-Great extent; 3-Moderate extent; 2- low extent and 1- I don’t know.
Table 4.14: Electronic weighment system improvement on orthodox tea project Tracking of
tea from the factory to the
warehouse
Efficient and effective service
delivery to the farmers Costs identification and management Reduce falsification; through product monitoring
Real-time communicatio n
N 109 109 109 109 109
Maximum Mean 5.0000 4.2303 5.0000 4.3364 5.0000 4.1172 5.0000 4.2000 5.0000 4.2364 Standard
Deviation .47352 .49304 .49233 .67093 .51132
46
The table 4.14 above shows tracking of tea from factory to the warehouse had mean of 4.2303 and standard deviation of 0.47352, effective and efficiency in service delivery to farmers mean of 4.3364 and SD 0.4904, cost identification and management mean of 4.1172 and SD 0.4923, reduction of falsification through product monitoring mean of 1.2 and SD 0.67093 and real-time communication mean of 4.2364 and SD of 0.51132. Hence
4.5.3 Adoption of EDMS on the management of orthodox tea project in KTDA. The study sought to establish the effect of EDMS on digitization and electronic archival of manual documents and its impact on management of orthodox tea project in KTDA. A likert scale of 1-5 was used with 5 representing extremely great extent; 4-Great extent; 3-Moderate extent; 2- low extent and 1- I don’t know.
Table 4.15: Effect of EDM system on digitization of documents Real-time notification and tracking of documents and records Provide complete document and user audit trails Provide complete documen t and user audit trails Hasten access to related business document s Shorten process cycle times while enabling better decision making Eliminates duplicatio n document ation Enhance security and management of enterprise information
N 109 109 109 109 109 109 109
Maximum Mean 5.0000 4.2593 5.0000 4.2512 5.0000 4.1816 5.0000 4.3689 5.0000 4.3891 5.0000 4.3181 5.0000 4.2271 Standard
Deviation .77306 .73183 .56321 .59268 .86723 .36581 .79623 Source: Researcher data, 2018
47
deviation of 0.77306, complete and auditable records for decision-making mean 4.2512 and Standard Deviation of 0.73183, hasten access to related business documents mean 4.1816 and Standard Deviation of .56321, shorten processes cycle times while enabling better decision making mean of 4.3689 and Standard Deviation of 0.59268, Eliminates duplication documentation mean 4.3181 and Standard Deviation of 0.86723, enhance security and management of enterprise information mean of 4.3182 and Standard Deviation of 0.86663 and provision complete document and user audit trails mean 4.2271and Standard Deviation of 0.79623as shown in table 4.15 above.
4.5.4 Effect of adoption of Automated Fleet Management System (AFMS) had improved management of transport logistics in Orthodox tea project in KTDA
The study sought to examine the extent to which fleet management system enhance efficiency in managing transport and logistics in areas where orthodox tea project have been launched by KTDA.
Table 4.16 Importance of AFMS managing transport and logistics Improved fuel consumption/ monitoring Minimize/ Eliminate fleet misuse Improved coordination and
monitoring of the leaf collection process Control careless driving Eliminate data manipulation
N 109 109 109 109 109
Max. 5.0000 5.0000 5.000 5.0000 5.0000
Mean 4.4909 3.7103 4.829 3.9355 3.6100
Std. Deviation .80986 .94684 .95631 .92055 .85810 Source: Researcher Data, 2018
48
following functions; improve monitoring and consumption of fuel had mean of 4.45 and SD 0.8 and improving coordination and monitoring of the leaf collection process Mean 4.82; standard deviation 0.945. Other functions such as Control careless driving had mean of 3.93 and Standard deviation 0.92, Eliminate data manipulation mean of 3.63 and SD 0.92 and Minimize/eliminate fleet misuse with mean of 3.71 and Standard Deviation 0.858. Hence AFMS had improved management of orthodox tea project to great extent.
4.5.5 Influence of Management Information System on improving performance Orthodox tea project in KTDA
The study sought to examine how management information system had improved the performance of orthodox tea project in KTDA.
Table 4.17: The Influence of MIS on improving the performance of Orthodox tea project in KTDA
System applications and processes (SAP) Enterprise Resource Planning
Electronic Weighment System
Electronic Document Management System
Automated Fleet Management System
N
Valid 109 109 109 109
Max. 5.0000 5.0000 5.0000 5.0000
Mean 4.3455 4.6545 4.5364 4.4182
Std. Deviation .70952 .85065 .51895 .59635 Source: Researcher Data, 2018