Scholarship@Western
Scholarship@Western
Electronic Thesis and Dissertation Repository
8-23-2018 1:00 PM
Motor Variability in Rowing
Motor Variability in Rowing
Maude Potvin-Gilbert
The University of Western Ontario
Supervisor Nolte, Volker
The University of Western Ontario Graduate Program in Kinesiology
A thesis submitted in partial fulfillment of the requirements for the degree in Master of Science © Maude Potvin-Gilbert 2018
Follow this and additional works at: https://ir.lib.uwo.ca/etd
Part of the Biomechanics Commons
Recommended Citation Recommended Citation
Potvin-Gilbert, Maude, "Motor Variability in Rowing" (2018). Electronic Thesis and Dissertation Repository. 5597.
https://ir.lib.uwo.ca/etd/5597
This Dissertation/Thesis is brought to you for free and open access by Scholarship@Western. It has been accepted for inclusion in Electronic Thesis and Dissertation Repository by an authorized administrator of
i
The aim of the study was to analyze the impact of environment, intensity and distance rowed
on temporal variability of strokes and on knee angle variability. 11 participants rowed
2,000 m at high and low intensities on an ergometer and at high intensity in a single
on-water. Data were collected at the beginning and at the end of each exercise. All the factors
influenced significantly the temporal variability (respectively beta=-0.013 and p .007=;
beta= 0.007 and p=.021; beta=0.06 and p=.028). The difference of visual information and the
need of the rower to adapt to environmental factors might explain the greater temporal
variability exhibited by the rowers while rowing on water. Participants exhibited a lower
variability when rowing at high intensity which could be explained by increased difficulty of
the task. Intensity and distance travelled did not influence significantly the variability of the
knee angle on the ergometer.
Keywords
ii
Co-Authorship Statement
Maude Potvin-Gilbert is the first author and Dr. Volker Nolte is co-author. All data in this
iii
Acknowledgments
I want to thank:
Dr. Volker Nolte, my M.Sc. supervisor
Dr. James Dickey from the School of Kinesiology
Dr. Jörn Diedrichsen from the Department of Computer Science
Dr. Daniel Bechard and Dr. Matthew Waddell from the Western Rowing program
Dr. Jane Thornton
Family and friends for their support
iv
Table of Contents
Abstract ... i
Co-Authorship Statement... ii
Acknowledgments... iii
Table of Contents ... iv
List of Tables ... vii
List of Figures ... viii
List of Appendices ... ix
Chapter 1 ... 1
1 Introduction ... 1
1.1 Purpose and Hypotheses ... 2
1.1.1 Purpose ... 2
1.1.2 Hypotheses ... 3
Chapter 2 ... 4
2 Literature review ... 4
2.1 Variability of Different Systems in the Body ... 4
2.2 Influence of Fatigue on Motor Variability ... 6
2.3 Influence of Fatigue in Rowing ... 8
2.4 Influence of Injuries on Motor Variability ... 9
2.5 Rowing Injuries ... 11
2.5.1 Lower Back ... 12
2.5.2 Knee ... 12
2.5.3 Upper limb ... 13
2.5.4 Rib ... 13
v
2.6.1 Kinematic and Kinetic ... 15
2.6.2 Muscle Activation ... 16
2.6.3 Physiology... 16
2.6.4 Performance ... 17
2.7 Motor Variability in Different Sports ... 17
2.8 Motor Variability in Rowing ... 19
2.9 Conclusion ... 21
Chapter 3 ... 22
3 Methods ... 22
3.1 Participants ... 22
3.2 Testing Procedures ... 22
3.3 Data collection ... 23
3.3.1 On-Water Rowing ... 23
3.3.2 Ergometer Rowing ... 24
3.4 Data Processing ... 25
3.4.1 On-Water Data ... 26
3.4.2 Ergometer Data ... 26
3.5 Statistical Analysis ... 29
3.5.1 Temporal Variability ... 29
3.5.2 Knee Joint Angle Variability ... 30
Chapter 4 ... 31
Chapter ... 31
4 Results ... 31
4.1 Temporal Variability ... 31
vi
4.4 Effect of Intensity on Temporal Variability... 35
4.5 Knee Joint Angle Variability ... 37
Chapter 5 ... 38
5 Discussion ... 38
5.1 Stroke Duration Variability Due to the Distance travelled ... 38
5.2 Stroke Duration Variability due to the Environment ... 39
5.3 Stroke Duration Variability Due to Intensity ... 40
5.4 Knee Joint Angle Variability ... 40
5.5 Limitations ... 41
5.6 Conclusion ... 41
5.7 Future Research ... 42
Bibliography ... 43
Appendix 1 ... 52
vii
List of Tables
Table 1: Background information of the participants ... 22
Table 2: Beta coefficient, p-value and standard error of the different variables used in the
model... 31
viii
List of Figures
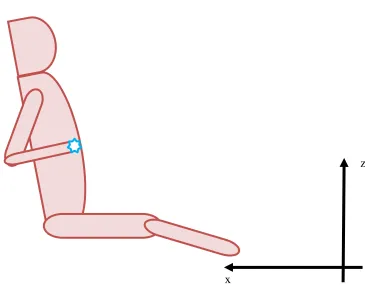
Figure 1: Sketch of a rower in the finish position during a test on the water with the marker (
) used for this trial. ... 24
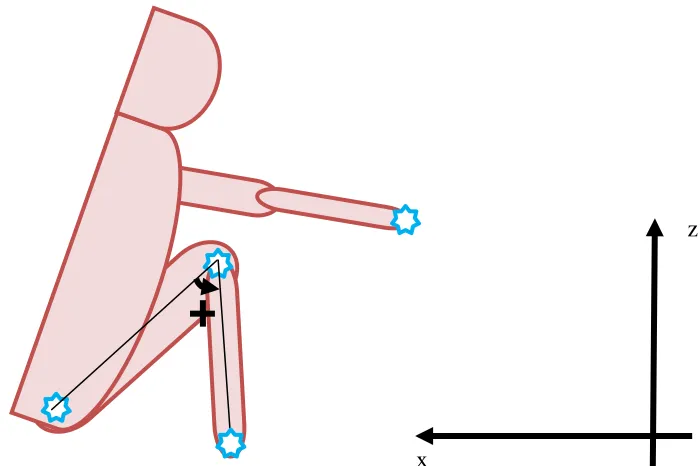
Figure 2: Sketch of a rower in the catch position during a test on the ergometer with the
markers ( ) used for this trial ... 25
Figure 3: Example of knee angle for 11 strokes ... 27
Figure 4: Example of knee angle for 11 strokes normalized with time ... 28
Figure 5: Predicted variability (s) associated with environment at high intensity at the end of
the rowing exercise ... 33
Figure 6: Predicted variability (s) associated with distance at the beginning and end of the
rowing exercise at high intensity on the ergometer ... 34
Figure 7: Predicted variability (s) associated with high and low intensity on the ergometer at
the end of the rowing exercise ... 35
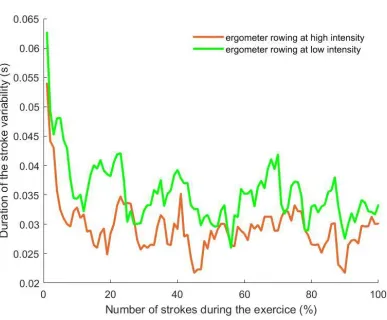
Figure 8: Median of all participants for the duration of stroke variability (s) throughout the
whole rowing exercise (Number of strokes during the exercise (%) for ergometer rowing at
ix
List of Appendices
Chapter 1
1
Introduction
The World Rowing Federation, known as FISA (Fédération Internationale des Sociétés
d’Aviron) was founded in 1892 and now includes 153 national rowing federations. Four
years after FISA was established, rowing became an Olympic sport
(World Rowing, n.d.-a). Nowadays, Olympic Games and World Championship,
competitions are held on a 2,000 m course. Athletes need approximately five to nine
minutes to cover the 2,000 m according to 2016 Olympic and World Championship
results (World Rowing, n.d.-b) depending on their ability, the number of people in the
boat, their gender and other external factors such as wind.
In rowing, athletes repeat the same movements over and over in order to be the first boat
to cross the finish line. A full stroke cycle is divided into two phases which are called the
“drive” and the “recovery”. The drive (propulsion phase) occurs between the catch (when
the hands are closest to the stern of the boat) and the finish (when the hands are closest to
the bow of the boat) positions. The recovery phase occurs between the finish and the
catch positions (Thornton et al., 2017). These two phases are done in sequence in order to
execute the stroke pattern. At the catch, rowers have their arms extended, their knees and
their hips in flexion. While at the finish, athletes have their elbows in flexion, their knees
extended and their hips greatly extended.
Rowers normally compete on water, but they can also compete indoors on an ergometer.
Ergometers are often used as a substitute for on-water training when weather conditions
are not adequate to row outdoors due to fog, low temperatures or high winds.
Rowers can row in singles, doubles, fours or eights. The number is associated with the
number of rowers in the boat. Sometimes, there is also a coxswain in the boat. The role of
the coxswain includes steering the boat, helping the rowers with the rhythm as well as
Crew with similar force patterns are more efficient (Hill, 2002). When rowing in pairs,
some rowers are able to adapt their force-time profile in order to increase their
synchronicity with the other crew member (Baudouin & Hawkins, 2004). Seifert et al.
(2017) determined that variability in the interpersonal coordination between rowers can
be functional and allows the rowers to achieve a task-goal (related to the speed or the
direction of the boat).
According to Srinivasan and Mathiassen (2012), motor variability addresses the
differences between each movement and can be studied at different levels of movement
execution across time within an individual. It can be measured using different types of
variables, such as performance measures, kinetic variables, kinematic variables, muscle
activity and coordination. Initially, variability in motor function was considered
dysfunctional and harmful to performance. Intra-individual variability was considered to
be noise in the motor system (Srinivasan & Mathiassen, 2012). However, recent research
shows that variability occurs at different expertise levels and can sometimes be
considered functional. The role that variability plays in the coordination and control of
the sensorimotor system is a central issue for motor control studies (Newell & Corcos,
1993).
A few studies report that motor variability and performance can be described in a
“U-shaped” relationship. Novices who are learning to do a skill have lots of variability in
their patterns while sub-elites have only little. Experts have more variability than
sub-elites which allows them to spread the load of training or competition across different
body structures by developing more variable motor strategies. Variability exhibits by
experts is functional in opposition to variability exhibits by novices (Bartlett, Wheat, &
Robins, 2007; Srinivasan & Mathiassen, 2012). Also, experts can used movement
variability in order to adapt to different situations (Bartlett et al., 2007).
1.1
Purpose and Hypotheses
1.1.1
Purpose
While some studies present benefits about motor variability (Bartlett et al., 2007), these
consistency important for performance, it would be interesting to see if the benefits of
variability outlined in motor variability literature apply to rowing. It would also be
interesting to see how different factors affecting motor variability presented in the
literature influence motor variability while rowing. Using motor variability in order to
study rowing might allow researchers to better understand the rowing motion.
The purpose of this study is to evaluate the impact of different factors on motor
variability. Spatial (variability in joint angle) as well as temporal variability (stroke
duration variability) will be used to analyze motor variability in rowing.
The different factors that will be studied are:
Environment (on-water rowing and ergometer rowing)
Intensity (low intensity and high intensity)
Distance rowed (beginning of the exercise and end of the exercise)
1.1.2
Hypotheses
Environment will influence temporal variability of strokes
Intensity will influence temporal variability as well as knee joint angle variability of the rower’s movements.
Distance rowed will influence temporal variability as well as knee joint angle
Chapter 2
2
Literature review
This chapter will present an overview of the literature linked to motor variability and
rowing.
2.1
Variability of Different Systems in the Body
According to Newell and Corcos (1993), variability is inherent within and between all
biological systems. Heart rate variability (HRV), variability in the electrical signals of the
brain and motor variability are examples of variability that have been studied in different
systems of the human body. Variation in biological processes might be explained by
health or diseases (James, 2004).
HRV has not only been studied in sick and injured people but also in athletes. HRV
represents adaptive responses of the autonomic nervous system to challenges to the
circulation that can been seen for example with respiration (Malik, 1998). Low HRV is
associated with a higher risk of myocardial infarction and neuropathic diabetes (Malik,
1998). In middle aged men (40 to 60 years old) participants who were classified in the
low heart rate variability group had higher systolic blood pressure, higher heart rate, and
were more likely to die from various causes (Dekker et al., 1997). In addition, it seems
that there is evidence of reduced HRV during low intensity and steady state exercise up
to 10 days following a concussion (Blake, McKay, Meeuwisse, & Emery, 2016).
For athletes, HRV is studied in relation to fatigue. Kajaia, Maskhulia, Chelidze,
Akhalkatsi, and Kakhabrishvili (2017) concluded that the cardiac autonomic imbalance
observed in over-trained athletes implies changes in the variability of the heart rate
signal, and therefore HRV could provide valuable information in the detection of
overtraining in athletes. Similarly, results from a case study by Plews, Laursen, Kilding,
and Buchheit (2012) suggests that HRV may be a useful measurement indicative of the
progression towards non-functional overreaching. Non-functional overreaching can be
studied as a way to monitor the training load in rowing (Plews, Laursen, Kilding, &
Buchheit, 2014). To summarize, HRV had been widely used in order to get information
about the health of different populations.
The electroencephalogram (EEG) records the electrical activity of the brain and the
electric signals have been analyzed using a method of nonlinear dynamics in order to
measure chaos in those signals. Stam et al. (1994) demonstrated a decrease in chaotic
dynamics in the EEG signals of demented and Parkinson Disease patients. In addition,
the link between EEG signals and epilepsy have been studied, in that, during an epileptic
seizure of short duration, the brain activity signal tends to have a more stable periodic
motion. Furthermore, Gallez and Babloyantz (1991) studied brain activity in three
different stages: alpha waves (eyes closed), deep sleep (stage four) and the
Creutzfeld-Jakob coma. They found that the degree of chaos in the EEG signal increases from a
coma to a deep sleep and from a deep sleep to an awake stage. A higher chaotic level in
the EEG signals may lead to a wider variety of responses and behaviours (Gallez &
Babloyantz, 1991). In contrast, information processing would be impossible given stable
periodic motion in the EEG signals (Babloyantz & Destexhe, 1986). It could be explain
by the chaotic dynamics increasing the resonance capacity of the brain. According to the
previous studies, having more chaotic brain electrical activity may be an indicator of
good health.
The relation between motor variability and various health problems has also been studied.
Perturbations to the normal state of a human’s system (e.g., pain and fatigue) might cause
adaptations in movement variability (Lomond & Côté, 2010) and may have important
clinical implications too (Madeleine, Mathiassen, & Arendt-Nielsen, 2008). Variability in
the motor system can either increase or decrease with distress. For example, elderly
fallers showed two-fold greater variability than elderly non-fallers for the first step length
during their gait initiation patterns. Mbourou, Lajoie, and Teasdale (2003) concluded that
this variability might be a predictor of postural problems. On the other side, Hamill, van
Emmerik, Heiderscheit, and Li (1999) observed decreased variability of the continuous
relative phase which is a measure of coordination patterns in symptomatic individuals
Motor variability can either be beneficial or detrimental to performance depending on the
parameter of interest (Heiderscheit, Hamill, & van Emmerik, 2002). A lack of variability
is associated with a system that has too much rigidity and is unable to adapt to stresses
(Georgoulis, Moraiti, Ristanis, & Stergiou, 2006) and any excess of variability is
associated with a system that is noisy and unstable (Stergiou, Harbourne, & Cavanaugh,
2006). In other words, any lack or excess of variability can be associated with abnormal
motor development or unhealthy states (Stergiou et al., 2006).
Variability in the human body can be used to distinguish healthy and diseased systems.
The study of variability in biological rhythms has provided researchers with extremely
useful insights for their understanding of pathology (Georgoulis et al., 2006). It is
important to note that the optimal amount of variability depends on the biological system
involved and the variable under examination (James, 2004).
2.2
Influence of Fatigue on Motor Variability
Fatigue does not have a widely accepted definition according to Friedman and Friedman
(1993). Enoka and Stuart (1985), for example, defined it as a “progressive increase in the
effort required to exert a desired force and the eventual progressive inability to maintain
this force in sustained or repeated contractions” (p.2281). Moreover, Cortes, Onate, and
Morrison (2014) suggest that the impact of exercise-induced fatigue is not only restricted
to a decline in the force producing capacity of the system, but is also related to the
variability of the movement pattern. Likewise, the relationship between fatigue and motor
variability has been studied by some other researchers (Cignetti, Schena, & Rouard,
2009; Cortes et al., 2014; Fuller, Fung, & Côté, 2011; Selen, Beek, & van Dieën, 2007).
Qin, Lin, Faber, Buchholz, and Xu (2014) studied kinematic variability in simulated light
assembly work. Participants had to use their dominant hand in order to reach for and pick
up washers and stacked them during four sessions of 20 minutes each. The researchers
observed decreased variability in the wrist and the elbow flexion over time, but an
increase in the variability of the shoulder abduction and the wrist radial deviation. These
adaptations may have occurred to reduce the load on the fatigued shoulder, and to
in variability over time occurred in order to fulfill specific task requirements. Moreover,
Hellard et al. (2008) studied motor variability with regards to fatigue in swimming. They
found decreased stroke rate variability during the second 100 m of a 200 m race for
backstroke, butterfly and freestyle races in comparison to the first 100 m of each race
which might be explained by a fatigue effect.
Srinivasan and Mathiassen (2012) suggested that more motor variability might lead to a
slower development of fatigue and relieve the load on fatiguing tissues. Gates and
Dingwell (2011) have shown that motor variability increases with fatigue in a task similar
to sawing. In this study, the authors suggest that the increase in variability is possibly due
to adaptations that the subjects made to combat fatigue or might directly be associated
with neuromuscular fatigue. Other studies have reached the same conclusion for different
tasks such as cross-country skiing (Cignetti et al., 2009), tracking a target with elbow
flexion and extension (Selen et al., 2007), and a repetitive reaching task (Fuller et al.,
2011). Selen et al. (2007) concluded that, even if fatigue did not affect the success of the
reaching task or the flexion and extension of the elbow task, fatigue had an impact on
motor variability during the movement.
Aune, Ingvaldsen, and Ettema (2008) compared the change of motor variability in expert
and recreational table tennis players during a prefatigued and fatigued condition. Table
tennis players showed a reduction in power-generation capacity between 28% and 39%
when in a fatigued condition compared to a prefatigued condition. Highly skilled players
had a high variability of the movement patterns for all segments (shoulder, elbow, wrist,
and racket) during the prefatigued condition, while the variability was smaller in the
fatigued condition. Recreational table tennis players had a lower variability of the
movement patterns for all segments during the prefatigued condition. For the fatigued
condition, the variability remained relatively stable or increased depending on the
segment studied.
Studies have shown that motor variability can be affected negatively or positively by
fatigue on motor variability might be task specific or due to individual capacity such as
skill level (Aune et al., 2008).
2.3
Influence of Fatigue in Rowing
Rowing is classified as an endurance sport. In fact, rowers are repeating the same
movement patterns. Studies have shown that some physiological, as well as some
biomechanical, changes take place as a result of this prolonged type of movement.
Holt, Bull, Cashman, and McGregor (2003) studied kinematical changes in the spine
during a rowing exercise that lasted for one hour. They observed an increase of the
maximal flexion of the spine which might be attributed to muscle fatigue in this area.
Holt et al. (2003) suggested that this change may even have an impact on low back pain.
Mackenzie, Bull, and McGregor (2008) were also interested in the same topic, but found
no kinematical changes (spine, thigh flexion/extension, relative timing during the stroke
where maximal thigh flexion/extension occurs, femoral extension at the finish, maximal
femoral extension as well as the relative timing during the stroke where maximal femoral
extension occurs). They explained the difference between the results of their study and
those of Holt et al. (2003) by the divergence between the athletes’ familiarity and
experience with the test performed. Athletes were more familiar with the test performed
in Mackenzie et al. (2008).
Wilson, Simms, Gormley, and Gissane (2011) were interested in comparing the lumbar
spine kinematic during a fatiguing protocol of ergometer and on-water rowing. They
found a significant increase in the range of motion of the lumbar spine on the ergometer
compared to on-water rowing.
Pollock, Jones, Jenkyn, Ivanova, and Garland (2012) used electromyography and
kinematics to quantify fatigue in a 2,000 m simulation race on a Concept2® rowing
ergometer. They found a change in the sequencing of the legs, trunk and arms, since the
peak angular velocity of trunk extension and upper extremity flexion occurred later in the
drive at 1,500 m compared to at 250 m. This could be due to the trunk becoming more
Husmann et al. (2017) found a significant decrease of isometric and concentric maximal
voluntary contraction of the knee extensors for both females and males following a
2,000 m rowing exercise. The researchers attributed the knee extensor strength loss to
central fatigue since there were no significant changes for the quadriceps twitch torque in
response to paired electric stimuli which are associated with peripheral fatigue.
Frias et al. (2018) studied the impact of rowing a very long distance (160 km) on
different biomarkers. The concentration of biomarkers related to inflammation (including
Il-6 and TNF alpha) and cardiac activity (creatine kinase and pro brain natriuretic peptide
(NT-proBNP)) increased between pre and post exercise. Post-exercise, their lipid profile
was better since there was a decrease of triglycerides and total cholesterol and an
increased in high-density lipoprotein cholesterol (HDL-c).
To conclude, most studies have found kinematical changes as well as hormonal changes
with rowing exercises. These changes are a sign of fatigue in rowing and may result in
decreased performance, as well as an increased risk of injuries.
2.4
Influence of Injuries on Motor Variability
Studies have shown that pain and injuries may affect motor variability (Côté, Raymond,
Mathieu, Feldman, & Levin, 2005; Georgoulis et al., 2006; Lamoth, Meijer,
Daffertshofer, Wuisman, & Beek, 2006; Madeleine et al., 2008; van den Hoorn, Bruijn,
Meijer, Hodges, & van Dieën, 2012). The nature of the pain itself (Madeleine et al.,
2008) and the patient’s perception of it (Moseley & Hodges, 2006) might be factors that
influence movement variability.
The variability of task timing increased during experimentally induced pain compared to
before the pain induction and the authors hypothesized that increased variability during
acute pain might be the central nervous system’s way of finding the least painful solution
for each task (Madeleine et al., 2008). Moseley and Hodges (2006) introduced a painful
stimulus to their study’s participants. Participants were classified into two groups.
Participants for whom the timing of abdominal muscle activation in the last 10 no-pain
remaining participants were classified as resolvers. Resolvers had a greater variability for
the last 10 pain trials as well as the remaining no pain trial compared to nonresolvers. It
seems that the resolvers were able to adapt to the pain stimulus compared to the
nonresolvers. Interestingly, nonresolvers were characterized as those believing they
suffered from back trouble. Moseley and Hodges (2006) suggested that the loss of
variability might be associated with these participants' perception of lingering back pain.
For butchers with chronic neck-shoulder pain who performed a simulated meat cutting
task, kinematic variability (arm and trunk accelerations) decreased compared to healthy
individuals (Madeleine et al., 2008). Another study from Madeleine and Madsen (2009)
reported a decrease of motor variability at the head-shoulder vertical displacement joint
for individuals with discomfort in the neck shoulder region. The discomfort also affected
the variability in remote locations such as elbow or hip joints. van den Hoorn et al. (2012)
found that participants with chronic low back pain adopted a more protective movement,
and so increased trunk stiffness. In the same vein, Moseley and Hodges (2006)
demonstrated that participants with reduced variability after induced back pain failed to
return to a normal postural strategy when the pain stopped. Madeleine et al. (2008)
explained this decrease due to the motor system becoming less flexible due to chronic
pain. The non resolution of the normal variability following a chronic pain episode might
increase the risk of further back pain (Moseley & Hodges, 2006).
Similarly, Georgoulis et al. (2006) found that variability of the flexion-extension of the
knee decreased on the injured knee compared to the contralateral knee for participants
with ACL injury. This decrease might lead to a greater likelihood for future injuries at the
knee because patients are unable to adapt to changing environmental demands
(Georgoulis et al., 2006). Hamill et al. (1999) suggested that the variability has a
functional role in the coordination of the lower limbs. The researchers saw a decrease in
the variability of the thigh rotation and leg rotation coupling for the injured limb of the
patellofemoral pain group compared to the healthy one. They could not determine if pain
was a cause or a consequence of motor variability. Moreover, Gallagher, Nelson-Wong,
and Callaghan (2011) studied the variability of the position of the centre of pressure
decreased variability is an adaptive response to the pain as opposed to a consequence of
it.
According to Bartlett et al. (2007), Hamill et al. (1999) and Srinivasan and Mathiassen
(2012), increased motor variability would divide stresses among different tissues and
would decrease the load on a specific tissue. Even after recovery, reduction of motor
variability can persist (Moseley & Hodges, 2006; Sterling, Jull, & Wright, 2001) and
might increase the chance of getting successive injuries (Georgoulis et al., 2006; Moseley
& Hodges, 2006).
To summarize, pain could be a cause and/or a consequence of motor variability. Chronic
pain reduces motor variability at the injured site to minimize pain while acute pain may
increase motor variability in order to find the least painful pattern (Srinivasan &
Mathiassen, 2012). The diminution of motor variability might stay after recovery even if
the pain is gone and increases the risk of further injuries by preventing adaptation.
2.5
Rowing Injuries
The vast majority of injuries in rowing are overuse injuries (Hosea & Hannafin, 2012;
Rachnavy, 2012; Smoljanovic et al., 2015), and caused by the repetitive nature of the
sport. Essentially, different body parts are particularly stressed because of the intensity
and the vast number of repetitions of the rowing motion (Hosea & Hannafin, 2012).
According to Smoljanovic et al. (2015), the mean injury rate per year is 0.92 injuries per
rower which represents 1.75 injuries per 1,000 training sessions per rower. Injury
incidence is proportionally related to the volume of training and technique (Hosea &
Hannafin, 2012). It can also be linked with poor technique, fatigue, overload, rapid
changes in training frequency, intensity or volume (Rachnavy, 2012; Rumball, Lebrun,
Di Ciacca, & Orlando, 2005; Thornton et al., 2017). Changing boat classes like going
from a bigger boat to a smaller boat, changing from sweep to sculling or vice versa are
factors that are associated with injuries too (Evans & Redgrave, 2016b). The two most
2.5.1
Lower Back
The lower back is the most reported injury site in rowers (Rumball et al., 2005; Wilson,
Gissane, & McGregor, 2014). The incidence of lower back injury is between 1.5 and
3.7/1000 h of rowing and associated training (Thornton et al., 2017). Adolescent rowers
have reported greater low back pain prevalence compared to the general population (Ng,
Perich, Burnett, Campbell, & O'Sullivan, 2014). Low back pain can even bother athletes
during activities of daily living (ADL) as reported by Maselli et al. (2015). They reported
that 40% of the athletes that filled out a questionnaire about pain reported some
limitations in their ADLs during their last episode of low back pain. Low back pain is
most likely to develop in the winter months compared to the other seasons (Wilson et al.,
2014). Factors that are significantly associated with the development of low back pain are
age at the time of the survey, history of rowing before age 16, use of larger blade surfaces
like a hatchet blade oar, training with free weights, weight machines and ergometers, and
ergometer training sessions lasting longer than 30 minutes (Thornton et al., 2017; Wilson
et al., 2014). The main causes of low back injuries are hyperflexion and twisting
(Rumball et al., 2005). Also, excessive use of lumbar flexion and extension without
accompanying pelvic tilting may lead to increased lumbar spine loading (Wilson et al.,
2014), which may cause low back pain. Similarly, adolescent rowers reported that
ergometer rowing, long rowing sessions and sweep rowing are factors that increase pain
intensity. Spondylosis, sacroiliac joint dysfunction and disc herniation are examples of
low back injuries in rowing (Rumball et al., 2005). Treatment for low back pain include
strengthening exercises, physiotherapy, and rest (Rumball et al., 2005; Thornton et al.,
2017).
2.5.2
Knee
Knee injuries are also considered common in rowing. Knee injuries represented 15.91%
of total injuries (Wilson, Gissane, Gormley, & Simms, 2008). The rowing motion
requires the knee to move through its full range of motion (Thornton et al., 2017). Some
knee injuries might be due to the repetition of the flexion and extension motion under
load (Hosea & Hannafin, 2012). In addition, Rachnavy (2012) found a significant
rowing, a difference that appears to be related to rowing injury. Patellofemoral pain
syndrome, tendinopathy, and iliotibial band friction syndrome are some examples of knee
injuries in rowing (Rumball et al., 2005; Thornton et al., 2017). Treatment for knee
injuries includes nonsteroidal anti-inflammatory medication, stretching programs,
physiotherapy, ice and rest but can also contain local corticosteroid injection (Hosea &
Hannafin, 2012; Thornton et al., 2017).
2.5.3
Upper Limb
Upper limbs are the third most frequently injured site in rowing (Hosea & Hannafin,
2012). Upper limb injuries represent approximately 14% of the total number of injuries
for the rowing programs at Harvard and Rutgers universities. Examples of upper limb
injuries include shoulder pain, lateral epicondylitis, deQuervain’s tenosynovitis,
exertional compartment syndrome, and intersection syndrome (Hosea & Hannafin, 2012;
Rumball et al., 2005). Shoulder pain can be due to overuse, poor technique or tension in
the upper body (Rumball et al., 2005) while poor technique or fatigue can cause forearm
and wrist injuries (Thornton et al., 2017). Treatments for upper limb injuries include ice,
stretching, massage, relative rest, acupuncture as well as nonsteroidal anti-inflammatory
medication and cortisone injection (Hosea & Hannafin, 2012; Thornton et al., 2017).
2.5.4
Rib
Rib cage pain is common in the rowing population (Hosea & Hannafin, 2012), and can be
attributed to rib stress fractures (RSFs), costochondritis, costovertebral subluxation, or
intercostal muscle strains (Hosea & Hannafin, 2012; Rumball et al., 2005). RSB has an
average incidence of 9.1% in rowing (McDonnell, Hume, & Nolte, 2011). Of these, RSFs
account for the most time lost from on-water training and competition (Rumball et al.,
2005). Hooper, Blanch, and Sternfeldt (2011) reported that an average of two months of
training is lost due to rib stress fractures. RSFs are one of the least understood of all
rowing injuries (Vinther & Thornton, 2016). Even though the mechanism of injury is
unclear (Evans & Redgrave, 2016b), some researchers have suggested that the
co-contraction of some thoracic muscles, such as serratus anterior and the external oblique
2012; Karlson, 1998). Multiple risk factors of RSFs have been identified by Evans and
Redgrave (2016a). Intrinsic factors include previous rib injury, relative energy deficiency
in sport, poor trunk strength/ endurance/ mobility/ flexibility, as well as other types of
injuries. Examples of extrinsic factors associated with RSFs are changes in training
environment such as big boat to small boat, sweep rowing to scull or vice versa, as well
as increased training load, volume and intensity. The Great Britain Rowing Team
guidelines suggest managing rib injuries by decreasing the load on the rib by stopping
rowing activities. Three to six weeks of recovery is the recommended healing period. A
progressive return to rowing is also suggested (Evans & Redgrave, 2016a, 2016b).
2.5.5
Other Injuries
Other injuries and health problems have been reported in the rowing literature, such as
female triad, dehydration, and dermatological issues including blisters and abrasions
(Rumball et al., 2005; Thornton et al., 2017). Also, some health issues can be associated
with a specific rowing population. Eating disorders as well as energy availability can be
an issue especially for lightweight rowers (Beggs, Nolte, & Dickey, 2016; Thornton et
al., 2017) while pressure sores can be a problem for para-rowers (Thornton et al., 2017).
In summary, most rowing injuries can be associated to overuse (Hosea & Hannafin,
2012; Rachnavy, 2012; Smoljanovic et al., 2015) and can occur in various parts of the
rower’s body. An appropriate loading in the boat (choosing the right oar) or on the
ergometer (choosing the right resistance) can reduce risk of overuse injuries (Thornton et
al., 2017). Well-designed prospective studies are still needed in order to identify risk
factors for injuries (Thornton et al., 2017; Vinther & Thornton, 2016) and low back pain
(Maselli et al., 2015), which will help coaches, athletes and therapists to prevent pain and
injuries that might affect ADLs (Maselli et al., 2015) or even informing premature ends
to athletic careers (Vinther & Thornton, 2016).
2.6
Comparisons of on-Water Rowing and Ergometer
Rowing
Rowing is a sport that is greatly impacted by environmental factors, such as wind, rain,
2009; Elliott, Lyttle, & Birkett, 2002; Mikulić, Smoljanović, Bojanić, Hannafin, &
Matković, 2009). In order to avoid these environmental factors, rowers sometimes train
on ergometers, which are also often used in order to assist crew selections as well as to
conduct physiological testing in a more controlled environment (Bazzucchi et al., 2013;
de Campos Mello et al., 2009; Elliott et al., 2002; Fleming, Donne, & Mahony, 2014;
Lamb, 1989; Mäestu, Jürimäe, & Jürimäe, 2005; Martindale & Robertson, 1984). Of the
different types of rowing ergometers, the most popular is the air-braked stationary
ergometer of Concept2® (Fleming et al., 2014; Kleshnev, 2008). Also, dynamic
ergometers, such as the Rowperfect® ergometer, have been studied and are supposedly
designed to simulate the force transfer of on-water rowing more accurately (Fleming et
al., 2014; Mäestu et al., 2005). While comparing dynamic versus stationary ergometers,
Benson, Abendroth, King, and Swensen (2011) concluded that the force profile as well as
the high stroke rates on dynamic ergometers are more similar to on-water rowing
compared to static ergometers.
2.6.1
Kinematic and Kinetic
Concerning the kinematics of a rowing stroke, Lamb (1989) found that the movements of
the upper arm as well as the forearm segments have significantly different patterns during
on water compared to ergometer rowing. These changes specifically affect the
“hand-curve” which is the movement of the hand in the sagittal plane of motion. For the
movement of the trunk and legs, there were no significant differences between the two
types of rowing. Also, Fleming et al. (2014) did observe a greater time for the drive phase
for on-water rowing compared to dynamic and stationary ergometer rowing. The average
body angles measured at the catch and finish positions of the stroke were statistically
similar for both on-water and ergometer rowing (Elliott et al., 2002). The same study
found a decreased stroke length during ergometer compared to on-water rowing and cited
for this decrease the shorter arm drive in ergometer rowing.
Time to complete the same distance on-water rowing is greater than the time on
ergometers with and without a slide (Bazzucchi et al., 2013; de Campos Mello et al.,
to more closely reflect the effort of on-water rowing (de Campos Mello et al., 2009;
Mäestu et al., 2005).
For the kinetic variables, Elliott et al. (2002) concluded that the force curves are similar
for on-water rowing and the Rowperfect® ergometer. Kleshnev (2008) observed that
rowers applied a greater force on the handle while rowing on ergometers compared to
rowing on a single scull boat. Researchers observed a faster increase in handle force and
leg speed in the boat and on dynamic ergometers compared to stationary ergometers, and
attributed these increases to the different magnitude of inertial force needed at the
beginning of the drive (Kleshnev, 2008). Overall, on-water rowing technique is
considered more multidimensional than ergometer rowing technique because it involves
balance, movement dynamics, efficiency and maintenance of the boat speed during the
recovery phase (de Campos Mello et al., 2009; Mäestu et al., 2005). Ergometers may be
detrimental to on-water rowing technique since the motion of the stroke is not exactly the
same for both conditions (Lamb, 1989; Mäestu et al., 2005).
2.6.2
Muscle Activation
Several differences in muscle activity patterns have been observed between on-water
rowing and stationary ergometer (Bazzucchi et al., 2013) as well as between stationary
ergometer, dynamic ergometer, and on-water rowing (Fleming et al., 2014). Bazzucchi et
al. (2013) observed a greater muscle activation on a Concept2® ergometer than during
on-water rowing, especially for knee extensors. In the other hand, Fleming et al. (2014)
found significant differences using iEMG to quantify muscle activation between on-water
rowing, stationary ergometer as well as dynamic ergometer. Bazzucchi et al. (2013)
observed a difference in terms of timing of maximal activation between stationary
ergometer rowing and on-water rowing. The timing difference might be explained by the
complexity of the on-water rowing technique (Bazzucchi et al., 2013).
2.6.3
Physiology
On the physiological side, mean and peak oxygen consumption, lactate, mean ventilation
as well as peak ventilation were similar for ergometer rowing with and without a slide, as
significant difference in heart rate, while Bazzucchi et al. (2013) observed significantly
higher heart rate during stationary ergometer rowing. They concluded that ergometer
rowing tends to elicit a greater metabolic demand which might be explained by the
greater involvement of the arm muscles compared to on-water rowing. Time to complete
the test was longer on water than on the ergometer. In the same vein, de Campos Mello et
al. (2009) found that there is a similar contribution of the aerobic systems on water
compared to rowing on an ergometer when values are normalized to time. Also,
Urhausen, Weiler, and Kindermann (1993) observed that blood levels of noradrenaline
was significantly higher and adrenaline had a tendency to have higher values while
rowing on an ergometer compared to on water rowing at similar heart rates.
2.6.4
Performance
Mikulić et al. (2009) observed a positive correlation between rowers’ ergometer
performance and World Rowing Championship rankings in 17 of 23 World
Championships rowing events. The observed correlations were higher for smaller boats
than larger boats. In larger boats, other factors can affect the overall performance such as
the synchronization between the individuals when rowing.
Even though there are some biomechanical, physiological and performance differences
between ergometer rowing and on-water rowing, ergometers should still be considered
valuable tools in testing, cross training and monitoring training (de Campos Mello et al.,
2009; Kleshnev, 2008; Mäestu et al., 2005; Mikulić et al., 2009). Nevertheless, data
collected on the ergometer still need to be interpreted with judiciousness when used for
testing and selection purposes (Kleshnev, 2008).
2.7
Motor Variability in Different Sports
Motor variability has been studied in different sports including cyclic ones. While the
emphasis on motor variability in different sport research usually evaluates performance,
injuries are also one of the main concerns in these research studies. According to Bartlett
et al. (2007), movement variability can be functional and might allow athletes to adapt to
their environments, to reduce injury risk, and to facilitate changes in coordination
Studies have looked at motor variability during a running task in connection with injury.
James, Dufek, and Bates (2000) found joint moment variability differed between a
healthy and an injury prone group. The injury prone group was determined using a
questionnaire and participants had self-reported predisposition for incurring overuse
lower extremity injuries. At the maximal vertical jump height, variability of peak ankle
joint moment was greater for the injury-prone group. Time to peak variability was greater
for the healthy group at 50% of the maximal vertical jump. Also, Hamill et al. (1999)
found less variability in lower extremity joint coordination in a symptomatic
patellofemoral group compared to healthy individuals. On the other hand, there was no
statistical difference between asymptomatic individuals with high Q-angle and low
Q-angle. Atanda, Reddy, Rice, and Terry (2009) defined the Q-angle “as the angle
between a line drawn from the anterior superior iliac spine to the centre of the patella and
a line from the centre of the patella to the tibial tubercle” (p.427). Individuals with a
greater Q-angle have a higher risk of lower extremities pain than individuals with a lower
Q-angle (de Oliveira Silva et al., 2015).
In running, Wheat, Baltzopoulos, Milner, Bartlett, and Tsaopoulos (2005) studied
coordination variability (hip flexion/ knee flexion, hip flexion/ ankle dorsiflexion, knee
flexion/ rearfoot inversion) for three conditions including: over ground, treadmill and
treadmill-on-demand. While there was no statistically significant difference between the
two treadmill conditions, the coordination variability during overground running was
greater than on the treadmills.
Hellard et al. (2008) studied stroke rate variability in different swimming styles, different
skill levels as well as distances (first 100 m compared to the second 100 m during a
200 m race). Researchers found that the Olympic group had less stroke rate variability
than the national group. The variability was greater in the first 100 m compared to the
second 100 m for the butterfly, backstroke and freestyle swimming strokes.
Cignetti et al. (2009) observed a larger standard deviation for the angular displacements
of the arm and leg at the end of the test compared to the beginning when doing
exhaustion at a constant speed and incline. During exhaustion, the increased variability
beyond its optimal value might be explained by the neuromuscular system becoming
noisier and unstable (Cignetti et al., 2009; Stergiou et al., 2006). In this study, power for
both arms and legs decreased throughout the exercise and were negatively correlated with
the standard deviation of the normalized time series of the leg and the arm angle.
In wheelchair racing, Wang, Vrongistinos, and Xu (2008) found that consistency in
forearm and arm movement patterns is negatively correlated with wheelchair speed and
speculated that this variability might be associated with alternately firing different motor
units. This variability might also lead to less fatigue by distributing the load across
different muscle units.
Preatoni, Ferrario, Donà, Hamill, and Rodano (2010) observed an increase of sample
entropy at the hip and ankle joints for skilled and less skilled athletes in race walking.
Sample entropy is one of the entropy measures suitable for the analysis of biological
signals entropy can be defined as “ indices measure the predictability of the signal: the
higher the entropy, the less regular and predictable the time series” (Preatoni et al., 2010,
p. 1328). Preatoni et al. (2010) determined that sample entropy can be used to
characterize more and less skilled individuals.
In basketball, Kudo, Tsutsui, Ishikura, Ito, and Yamamoto (2000) suggested that variable
release parameters can result in a consistent throwing performance. This variability is
important because it offers greater flexibility to adapt to potential perturbations such as
other players (Bartlett et al., 2007).
Variability has been studied in different sports and can have a functional role (Bartlett et
al., 2007; Srinivasan & Mathiassen, 2012). It can be associated with performance,
injuries, athletic ability and fatigue.
2.8
Motor Variability in Rowing
There are a few studies that mention variability and rowing. While some authors argue
others found that the variability can also have a functional role such as controlling the
direction of the boat.
Kleshnev (2012) stated that international crews have a stroke rate variability of 1%, as
beginner crews have a stroke rate variability closer to 4-5 %. The stroke rower is the
athlete closest to the bow and is the only one who can be seen by all the crew members.
This rower sets the pace of the boat and all crew rowers follow their lead. While
comparing the crew rowers with the stroke rower, the stroke rower had less variability in
the force pattern than the crew rowers. It could be explained because the crew rowers
have to coordinate themselves with the stroke rower (Kleshnev, 2012).
Ng, Campbell, Burnett, Smith, and O’Sullivan (2015) found an increased within-subject
variability for the lower lumbar angle (angle between the spinous processes of L3, S2,
and a vertical line) and upper lumbar angle (angle between the spinous processes of T12,
L3, and a vertical line) for participants with low back pain provoked by rowing compared
to the participants without pain. The authors suggested that the variability might be the
cause or a consequence of the injury. These results are similar to other studies with
participants with acute pain such as the ones from Madeleine et al. (2008).
Draper and Smith (2006) found a high consistency of different kinetic rowing variables
such as boat velocity, boat acceleration, and pin force. The participants of the study were
experienced and rowed 250 m rowing pieces at race stroke rates (Draper & Smith, 2006).
Stroke to stroke consistency and propulsive work consistency have been found to be
discriminant factors to identify ability levels (Smith & Spinks, 1995). Athletes with more
consistency in the previous variables were considered performing better than athletes
with less consistency. Doyle et al. (2010) observed a negative correlation between the
coefficient of variation of the arm, trunk, handle and seat velocities and average boat
velocity. They also suggested that the crews that repeated the same movement pattern
consistently tend to row at a higher average boat velocity (Doyle et al., 2010).
Movement variability in rowing has been studied from a kinetic point of view, while only
a few studies have looked at kinematic variability, it is possible that kinematic variability
2.9
Conclusion
This literature review outlined the impact of different factors on motor variability as well
as in the sport of rowing. This review also shows the impact of motor variability in other
sports, in rowing as well as the impact of the variability in different systems of the human
body. Motor variability might prevent overuse injury, while the number of these injuries
is significant in rowing. Also, fatigue can affect the rower in different points of view as
Chapter 3
3
Methods
3.1
Participants
Eleven athletes from the University of Western Ontario Varsity Rowing Team
participated in this study. Some background information about the participants was
collected (Table 1). All participants signed informed consent forms approved by the
institutional Ethics Committee.
Table 1: Background information of the participants
Gender Age
(years)
Rowing category Performance level
M F Light open University National
team weight
4 7 22±2 4 7 7 4
3.2
Testing Procedures
Test pieces
Participants were tested on water at high intensity, and on an ergometer both at high
intensity and low intensity. High intensity is the rowing speed used during a
long-distance race (4 to 10 km) while low intensity is the speed used for a 60 to 120 minutes of
training. Each participant in the study performed all tests. Participants started with the
on-water test due to the limited time available. Filming was not possible in the darkness,
during rain, or windy conditions. For the on-water part of the study, participants were
asked to perform in a single scull boat a 1,750 m or 2,000 m piece at a constant pace and
a predetermined high intensity of the rower’s long-distance race pace. For the tests on the
“high” and “low” intensities. Athletes were given the choice to start their first session
with their preferred intensity. Before each test, the rowers went through their individual
warm-up routine. The three test sessions were performed on three different days with at
least one rest day between the two high intensity pieces.
3.3
Data Collection
Prior to the beginning of each session, customized markers were placed on the
participants at different anatomical points on one side of the body. The number of
markers and their location depended on the environment (on-water rowing or ergometer
rowing). For each participant, markers were placed on the same side of the body
throughout all three tests. According to Bartlett, Bussey, and Flyger (2006), movement
variability cannot be assessed objectively without markers. The errors stemming from
digitizing with the use of surface markers to represent underlying joints are considered
small (Bartlett et al., 2006).
3.3.1
On-Water Rowing
One marker was placed on the coronoid process of the ulna (wrist) before the beginning
of the test (see Figure 1). Videos were collected at a rate of 30 frames/second with a
camera (Sony, Cybershot DSC-RX10M3) perpendicular to the plane of motion that was
located at approximately 20 m distance from the rower in a motor boat that travelled
parallel to the rowing boat with the speed of the boat. This method was also used in
Bechard, Nolte, Kedgley, and Jenkyn (2009).The first set of data was recorded after
200 m into the piece. The second set of data was recorded between 500 m and 200 m
3.3.2
Ergometer Rowing
Markers were placed on the coronoid process of the ulna (wrist), trochanter major (hip),
lateral condyle of the tibia (knee) and lateral malleolus (ankle) before the beginning of
each test (see Figure 2). A camera (Sony, Cybershot DSC-RX10M3) was placed
perpendicular to the plane of motion on a tripod that was located approximately 5 m
away and perpendicular to the plane of motion and recorded at 30 frames/second. The
whole 2,000 m piece was recorded.
z
x
x
x
x
x
Figure 1: Sketch of a rower in the finish position during a test on the
3.4
Data Processing
The videos of the ergometer rowing and on-water rowing were trimmed in order to keep
only two videos of 11 consecutive strokes after 200 m and between 500 m and 200 m
before the finish for each session.
The number of strokes that is needed to be analyzed for the study was determined using a
modified version of the sequential estimation technique (Clarkson, Katch, Kroll, Lane, &
Kamen, 1980). In order to calculate a stable variability for each measure, the criterion
was met when the cumulative variability fell within the 20-trial standard deviation ±0.25
of the 20-trial standard deviation. This criterion represented a conservative cut-off and
was chosen according to Hamill and McNiven (1990). To find this criterion, this
technique was performed for the knee angle and the stroke duration variability on one
video per test (high intensity on ergometer, low intensity on ergometer, and high intensity
on water). Eleven cycles marked the first time that all the variables fell within the
criterion for all conditions.
Digitizing was done using the software Tracker (Douglas Brown, 2018; Version 4.95).
Depending on the environment, points digitized included the coronoid process of the z
x
x
x
x
x
Figure 2: Sketch of a rower in the catch position during a test on the ergometer
ulna, the trochanter major, lateral condyle of the tibia, the lateral malleolus, a point on the
boat as well as the 2 points on the shore. Data were exported into an Excel sheets
(Microsoft Excel, 2007) and processed using the software MATLAB (Version 2017a).
The raw data associated with the position of the wrist in x-direction relative to the boat
was used to determine the catches as presented by Pollock et al. (2012). The frame
associated with the catch position was determined by the smallest x-value of the wrist.
3.4.1
On-Water Data
For the on-water analysis, a custom MATLAB program was used to calculate the
variability of duration of strokes. Two points on the shoreline which is horizontal in the
background of the video were digitized in order to define the x and z-axis of the frame to
the movement of the rower. This procedure was done to set a proper coordinate system
for every video frame in order to limit possible error coming from the potential turning
movements of the camera. The wrist marker as well as a point on the boat were then
digitized in order to calculate the coordinates of the wrist marker relative to the boat. This
process was needed to be able to compare the data to the ergometer trials and to
determine the frame at which the catch occurred. Standard deviation of duration of
strokes was used to calculate the temporal variability.
3.4.2
Ergometer Data
A custom MATLAB program was used to calculate variability of knee joint angle in the
sagittal plane, as well as the temporal variability of the duration of strokes. Raw data of
the markers placed on the greater trochanter, lateral condyle of the tibia and lateral
malleolus were filtered using a zero-phase Butterworth filter (order 4). The cut-off
frequency of the filter was optimized using the residual analysis technique described in
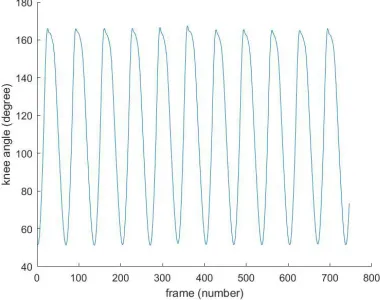
Winter (2009).The angle at the knee joint angle (see Figure 3) was calculated using the
law of cosines (Equation 1). The knee joint angle was studied since the majority of the
power while rowing is coming from the legs (Kleshnev, 2014).
Equation used to calculate the knee angle (1):
(1)
a=ankle, h=hip, k=knee
Figure 3: Example of knee angle for 11 strokes
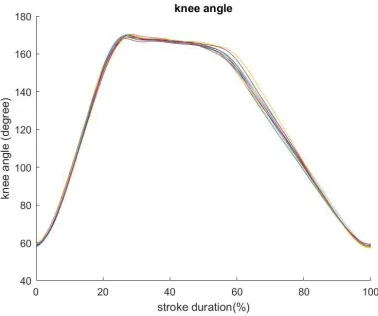
Afterward, time was normalized for each stroke from zero to one hundred percent
(Figure 4). Time normalization is used in rowing to allow comparison between strokes
Figure 4: Example of knee angle for 11 strokes normalized with time
For each percent of stroke, standard deviation was calculated for the knee angle ( ° ). The
average standard deviation was used to quantify motor variability at each joint. The
standard deviation is one of the most used measure of variability (James, 2004).
Average standard deviation was calculated using formula (2) presented by James (2004):
)
The smallest value in x-direction for the wrist was used to determine the catch position
for every stroke. The respective time of this position was then used to calculate, the
duration of each stroke. Temporal variability of strokes was then calculated using the
To gather more information about the temporal variability associated with time and
intensity, the duration of every stroke during the whole exercise was calculated for both
ergometer conditions. It was not possible to include data coming from the on-water
analysis since only part of the exercise could be recorded. A rolling window analysis was
performed for all stroke duration for both low and high intensity rowing exercises on the
ergometer. Each window had 11 strokes. The standard deviation for each window was
calculated. The number of strokes was reported as a percentage of the total number of
strokes of the whole exercise. This procedure allows the comparison between the
different intensities and participants. For each intensity, the median variability of each
percent was then calculated.
3.5
Statistical Analysis
Temporal variability and knee joint angle variability have been analyzed separately. The
different statistical tests were performed using IBM SPSS Statistic (Version 25).
3.5.1
Temporal Variability
Statistical analysis for the temporal variability was performed using the Generalized
estimating equations (GEE) technique. GEE procedure extends the generalized linear
model that facilitates the analysis of repeated measurements (Ballinger, 2004). GEE
analysis was performed due to the study design not being fully factorial. The working
correlation matrix used is independent since the Quasi-likelihood under independence
model criterion (QIC) was the smallest (Norusis, 2007). The best model was determined
using the lowest Corrected Quasi-likelihood under independence model criterion (QICC)
(Norusis, 2007). The predictors used in the model are environment (on water; ergometer),
intensity (low and high), and distance (beginning and end). Response variable was the
temporal variability (s) and was considered continuous. Due to the number of clusters,
the model-based method correlation matrix was used (Horton & Lipsitz, 1999). The
Generalized Score Chi-square statistic test was performed (Molenberghs & Verbeke,
2007). The beta coefficient, the p-value and the standard error associated with the
3.5.2
Knee Joint Angle Variability
A 2-way ANOVA within subject was performed in order to assess if intensity and
distance rowed affect the variability of the knee joint angle. In order to respect the
assumptions of normality of the residuals, data were transformed using the reciprocal
square root. After the transformation of the data, the normality of residuals was assessed
using Kolmogorov Smirnov test and was met for p ˃ .05. The assumption regarding the
sphericity was tested using Mauchly’s test of sphericity and was met for p ˃ .05. The
p-value as well as the observed power of the distance rowed, the intensity and the
Chapter 4
Chapter
4
Results
4.1
Temporal Variability
Due to the low number of clusters and groups, results from this section should be
interpreted with caution. Following the statistical analysis, the beta coefficient, the
standard error, and the p-value were calculated for each variable included in the model.
The environment (on water or ergometer), intensity (low or high) and distance (beginning
and end) are factors that are statistically significant in the model. Beta coefficients were
calculated for all variables and for the intercept (constant).
Table 2: Beta coefficient, p-value and standard error of the different variables used
in the model
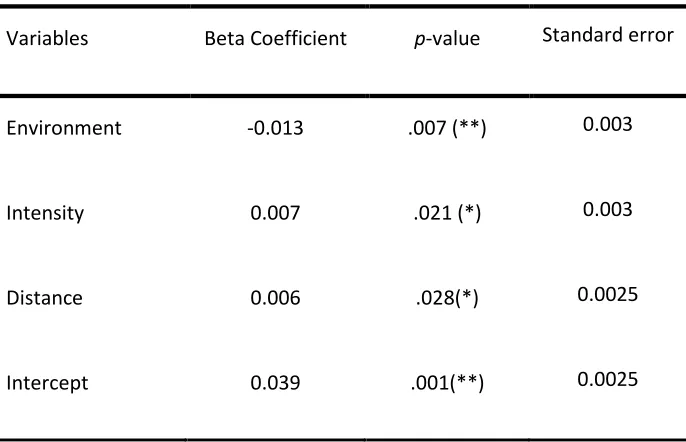
Variables Beta Coefficient p-value Standard error
Environment -0.013 .007 (**) 0.003
Intensity 0.007 .021 (*) 0.003
Distance 0.006 .028(*) 0.0025
Using the different factors in the analysis, an equation was associated with the model
(Equation 3) to predict the temporal variability of the movement.
4.2
Effect of Environment on Temporal Variability
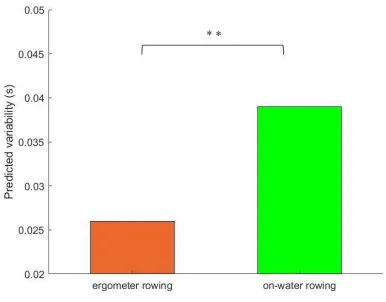
Variability of the duration of strokes is affected by the environment (p=.007). Variability
while rowing on water is greater than the variability while rowing on the ergometer if the
other predictors are kept constant (Figure 5). For on-water rowing (high intensity, at the
end of the exercise), the predicted variability is 0.039 s while for the ergometer rowing
(high intensity, at the end of the exercise) the predicted variability is 0.026 s. On-water
rowing increased the variability by 0.013 compared to ergometer rowing.
Figure 5: Predicted variability (s) associated with environment at high intensity at the end of the rowing exercise
4.3
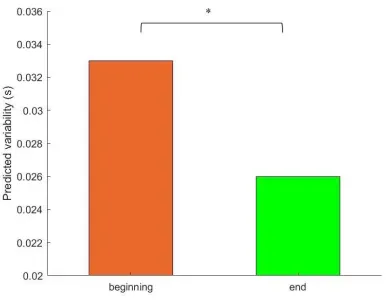
Effect of Distance travelled on Temporal Variability
Variability associated with distance is statistically significant in the model (p=.021).
Predicted variability at the beginning of the rowing exercise (0.033 s) is significantly
greater than the variability at the end of the rowing exercise (0.026 s) if rowing on an
ergometer at high intensity (see Figure 6).
Figure 6: Predicted variability (s) associated with distance at the beginning and end of the rowing exercise at high intensity on the ergometer
4.4
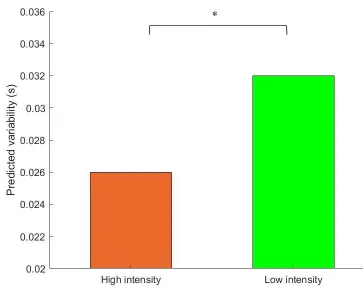
Effect of Intensity on Temporal Variability
There is a statistically significant difference between rowing at low intensity compared to
rowing at high intensity (Figure 7). The variability is greater when rowing at low
intensity compared to rowing at high intensity if the other predictors are kept constant.
Figure 7: Predicted variability (s) associated with high and low intensity on the ergometer at the end of the rowing exercise
(* p≤.05)
The predicted variability associated with rowing at high intensity on ergometer at the end