Article
1
“Out of the Can”: A Draft Genome Assembly, Liver
2
Transcriptome and Nutrigenomics of the European
3
Sardine, Sardina pilchardus
4
André M. Machado 1,†, Ole K. Tørresen 2,†, Naoki Kabeya 3,†, Alvarina Couto 1,4, Bent Petersen 5,6,
5
Mónica Felício 7, Paula F. Campos 1,4, Elza Fonseca1,8, Narcisa Bandarra7, Mónica Lopes-Marques 1,
6
Renato Ferraz 1,9, Raquel Ruivo 1, Miguel M. Fonseca 1, Sissel Jentoft* 2,10, Óscar Monroig* 11,
7
Rute da Fonseca* 4,12 and L. Filipe C. Castro* 1,8
8
1 CIIMAR – Interdisciplinary Centre of Marine and Environmental Research, U. Porto – University of Porto,
9
Porto, Portugal
10
2 Centre for Ecological and Evolutionary Synthesis (CEES), Department of Biosciences, University of Oslo,
11
Norway
12
3 Department of Aquatic Bioscience, The University of Tokyo, Japan
13
4 The Bioinformatics Centre, Department of Biology, University of Copenhagen, Denmark
14
5 DTU Bioinformatics, Department of Bio and Health Informatics, Technical University of Denmark,
15
Kongens Lyngby, Denmark.
16
6 Centre of Excellence for Omics-Driven Computational Biodiscovery, Faculty of Applied Sciences, Asian
17
Institute of Medicine, Science and Technology, Kedah, Malaysia.
18
7 Portuguese Institute for the Sea and Atmosphere, I.P. (IPMA), Portugal
19
8 Department of Biology, Faculty of Sciences, U. Porto - University of Porto, Portugal
20
9 ICBAS - Institute of Biomedical Sciences Abel Salazar, U. Porto - University of Porto, Portugal
21
10 Centre for Coastal Research, Department of Natural Sciences, University of Agder, Norway
22
11 Instituto de Acuicultura Torre de la Sal, Consejo Superior de Investigaciones Científicas (IATS-CSIC),
23
Ribera de Cabanes, Spain
24
12 Center for Macroecology, Evolution, and Climate, Natural History Museum of Denmark, University of
25
Copenhagen, Copenhagen, Denmark
26
†Joint first authors and Equal contribution
27
*Equal and Corresponding authors: [email protected]; [email protected]; [email protected];
28
29
Abstract: Clupeiformes, such as sardines and herrings, represent an important share of worldwide
30
fisheries. Among those, the European sardine (Sardina pilchardus, Walbaum 1792) exhibits
31
significant commercial relevance. While the last decade showed a steady and sharp decline in
32
capture levels, recent advances in culture husbandry represent promising research avenues. Yet, the
33
complete absence of genomic resources from sardine imposes a severe bottleneck to understand its
34
physiological and ecological requirements. We generated 69 Gbp of paired-end reads using Illumina
35
HiSeq X Ten and assembled a draft genome assembly with an N50 scaffold length of 25579 bp and
36
BUSCO completeness of 82.1% (Actinopterygii). The estimated size of the genome ranges between
37
655 and 850 Mb. Additionally, we generated a relatively high-level liver transcriptome. To deliver
38
a proof of principle of the value of this dataset, we established the presence and function of enzymes
39
(elovl2, elovl5 and fads2) that have pivotal roles in the biosynthesis of long chain polyunsaturated
40
fatty acids, essential nutrients particularly abundant in oily fish such as sardines. Our study
41
provides the first omics dataset from a valuable economic marine teleost species, the European
42
sardine, an essential resource for their effective conservation, management and sustainable
43
exploitation.
44
Keywords: European sardine; draft genome; teleosts; comparative genomics; long chain
45
polyunsaturated fatty acids
46
47
1. Introduction
48
Teleosts comprise the most species rich group of vertebrates with approximately 30,000
49
described species [1]. During the last decades, teleosts emerged as particularly insightful models for
50
comparative evolutionary studies [2]. Moreover, numerous teleost fish species are of high commercial
51
importance for both fisheries and aquaculture. Fish are not only an important source of protein for
52
human consumers, but oily species represent unique sources of the healthy omega-3 long-chain
53
polyunsaturated fatty acids (LC-PUFAs), which have been shown to have essential roles in
54
cardiovascular health and neuronal development [3,4]. Yet, over-fishing combined with global
55
changes entail countless threats to this taxon, making it an interesting target for aquaculture which
56
already provides approximately half of the seafood consumed worldwide [5]. The oily fish European
57
sardine (Sardina pilchardus, Walbaum 1792) (Fig. 1) is one of the most commercially important species
58
[6], particularly for the canning industry, and has high nutritional value primarily linked to its
59
omega-3 LC-PUFA content. Interestingly, a steady and sharp decline in capture levels has been
60
observed in the last decade, which is currently dictating severe cuts in fishing quotas within the
61
European Union [7]. Recent advances in captive sardine culture practices represent promising
62
research possibilities [e.g. 5,6]; however, the complete absence of genomic resources from this iconic
63
species imposes a severe bottleneck. Genome data emerging from high-throughput sequencing
64
technology combined with multiple assembly algorithms has represented a truly transformative
65
event in the field of comparative genomics [10]. Moreover, de novo assemblies based on low coverage
66
and short read approaches are cost effective and provide valuable biological information [e.g. 11–13].
67
Here, we present the first draft genome of the European sardine and provide a relatively high-level
68
liver transcriptome enabling nutrigenomics studies in this iconic species. The genomic makeup of the
69
European sardine was further compared to that of other teleosts, including the closely related clupeid
70
the Atlantic herring [14]. As a proof of principle, we selected the LC-PUFA biosynthesis, a metabolic
71
pathway accounting for the production of omega-3 fatty acid in fish [15], and characterized key genes
72
with well-established roles within these pathways [3,16].
73
74
Figure 1. Photograph of a specimen of European sardine, Sardina pilchardus (photograph credits to
75
Mónica Felício and André M. Machado).
76
2. Methods, Results and Discussion
77
2.1. Sampling, DNA extraction, library preparation and genome sequencing
78
One S. pilchardus specimen (Fig. 1) was caught off Esposende (41.501944N 8.851667W),
79
Portugal, under the “Programa Nacional de Amostragem Biológica” carried out by the Instituto
80
Português do Mar e da Atmosfera (IPMA). Tissues were harvested immediately and stored in 100%
81
ethanol (muscle) and RNA later (liver) until further processing (Additional Table 1 in Additional File
82
2). Genomic DNA was extracted from muscle tissue (~0.5 g) in three replicates, using Qiagen's
83
DNeasy Blood & Tissue Kit (Valencia, CA, USA) according to the manufacturer's instructions, with
84
the following modifications: prior to elution in 100 μl AE buffer, samples were incubated at 37 ºC for
85
10 min, to increase DNA yield. DNA concentration and integrity were verified using an Agilent
86
Genomic DNA ScreenTape (Waldbronn, Germany). We constructed one 150 bp paired-end reads
87
library from 1.2 μg of genomic DNA using the standard Illumina protocol for the TruSeq Nano DNA
88
library kit, with an average short-insert-size of around 446 bp. Sequencing was performed with the
Illumina HiSeq X Ten (Macrogen, Korea) platform and generated 69.0 Gbp of raw reads for
90
downstream analysis (Additional Table 1 in Additional File 2).
91
2.2. RNA extraction, library preparation and sequencing
92
Total RNA was extracted from liver using Illustra RNAspin Mini RNA Isolation Kit (GE
93
Healthcare, UK) according to the manufacturer's instructions. The isolated RNA was treated with
94
RNase-free DNase I and eluted with RNase-free water. A strand-specific library with insert size of
95
250~300 bp was built after conversion of the liver total RNA to cDNA and sequenced using 150 bp
96
paired-end reads on the Illumina HiSeq 2500 platform by Novogene (China). A total of 122,8 Million
97
of raw reads were produced (Additional Table 1 in Additional File 2).
98
2.3. RNA-Seq raw data clean-up & de novo assembly transcriptome
99
The quality of raw RNA-Seq reads were scrutinized using the FastQC software
100
(http://www.bioinformatics.babraham.ac.uk/projects/fastqc/). Trimmomatic (v0.36) [17] was used to
101
clean up the initial dataset (LEADING:15 TRAILING:15 SLIDINGWINDOW:4:20 MINLEN:50) (Table
102
1). To assemble the paired end reads we used the de novo assembler Trinity (v2.4.0) [18]. All default
103
parameters were used except for SS_lib_type - RF and min_contig_length of 300 bp. To check for
104
contamination sources such as vectors, adapters or other exogenous sequences, we applied the same
105
methodology as previously described [19]. Thus, using the MCSC decontamination pipeline [20] and
106
UniVec database (build 10.0) we obtained the final decontaminated transcriptome assembly further
107
used in the genome annotation process. Overall, from 111.5 million of clean reads we obtained a total
108
of 245053 assembled transcripts, with N50 of 1760 bp (Table 1 and Additional Table 1 in Additional
109
File 2). Additionally, we also evaluated the gene content completeness using the Benchmarking
110
Universal Single-Copy Orthologs (BUSCO (v.3)) [21]. This analysis was done against the
lineage-111
specific library of Actinopterygii and showed that from 4584 BUSCO ortholog genes our
112
transcriptome assembly contains 80.6% of the sequences) (complete and partial) (Table 1).
113
2.4. DNA raw data clean-up & genome size estimation
114
Raw Illumina reads were first processed with Trimmomatic [17] for removal of adapter
115
sequences and trimming bases with quality <20 and discarded reads with length <80. The genome
116
size estimation was performed with two different approaches, using GenomeScope (v1.0.0 ) [22] and
117
Kmergenie (v1.7044) [23] on genomic clean reads. The first approach requires the Jellyfish (v2.2.6)
118
software to build k-mer frequency distributions. We applied three values of k-mers 21, 25 and 31, and
119
each histogram was submitted to the GenomeScope software. In the end, we estimated a genome size
120
between 625 – 637 Mbp, heterozygosity levels between 1.60 – 1.75% and unique content of 85.0 –
121
85.7% (Additional Fig 1 A/B/C in Additional File 1 and Additional Table 2 in Additional File 2). On
122
the other hand, the Kmergenie software with the diploid model also was used, and a genome size of
123
850 Mb was obtained.
124
2.5. Assembly & assessment of sardine genome
125
The genomic clean reads were assembled with the Celera assembler (downloaded from the CVS
126
(Concurrent Version System, http://wgs-assembler.sourceforge.net/) repository on June 21st 2017)
127
(for details see Additional Material Methods in Additional File 1). Interestingly, this assembler has
128
been successful for other teleost species genomes (e.g. Parachaenichthys charcoti) [24]. After genome
129
assembly, the clean reads were back mapped to the sardine genome with BWA mem [25]. PCR
130
duplicates were removed with Picard MarkDuplicates (http://picard.sourceforge.net) and local
131
realignment around indels was done with GATK [26]. A median insert size of 441 bp was determined
132
with Picard CollectInsertSizeMetric. To evaluate the genome assembly, we primary used QUAST
133
v.4.3 [27]. Next, the validation of the genome was done with the K-mer analysis toolkit (KAT) [28].
134
Through this analysis it was possible to check how the Celera Assembler dealt with the
135
heterozygosity of the sardine. In Additional Fig. 2 of Additional File 1 two peaks can be observed:
the first peak at 25 x (heterozygotic) and the second at 55 x (homozygotic). Ideally, it is expected that,
137
after the assembly, the shared k-mers contents of both distributions (red zones) are merged (black
138
zones in the first peak) and stayed represented just once in both distributions [28]. Notwithstanding,
139
our distributions show this profile, with the black content of the first peak nearly filling the full area
140
of the second peak. Second, and similarly to the transcriptomic approach, the sardine genome was
141
also inspected in terms of expected gene content with the BUSCO v.3 software [21]. From the total of
142
4584 genes present in the Actinopterygii library, we found 82.1% (complete + fragmented). To further
143
determine the genome completeness, we mapped the de novo assembled liver transcriptome against
144
the genome with Blat [29]. More than 97% of the transcripts have a match hit with at least one genomic
145
scaffold and 89% of the total number of bases are covered by our assembly (Additional Table 3 in
146
Additional File 2).
147
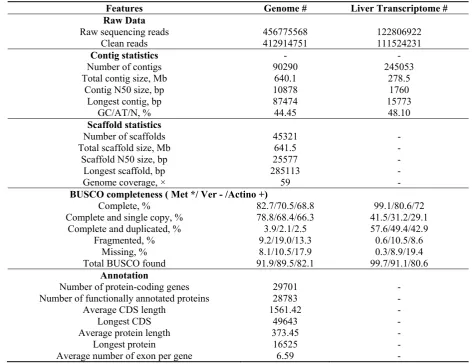
Table 1. Summary of genome and liver transcriptome statistics of the European sardine, Sardina
148
pilchardus.
149
Features Genome # Liver Transcriptome #
Raw Data
Raw sequencing reads 456775568 122806922
Clean reads 412914751 111524231
Contig statistics - -
Number of contigs 90290 245053
Total contig size, Mb 640.1 278.5
Contig N50 size, bp 10878 1760
Longest contig, bp 87474 15773
GC/AT/N, % 44.45 48.10
Scaffold statistics
Number of scaffolds 45321 -
Total scaffold size, Mb 641.5 -
Scaffold N50 size, bp 25577 -
Longest scaffold, bp 285113 -
Genome coverage, × 59 -
BUSCO completeness ( Met */ Ver - /Actino +)
Complete, % 82.7/70.5/68.8 99.1/80.6/72
Complete and single copy, % 78.8/68.4/66.3 41.5/31.2/29.1
Complete and duplicated, % 3.9/2.1/2.5 57.6/49.4/42.9
Fragmented, % 9.2/19.0/13.3 0.6/10.5/8.6
Missing, % 8.1/10.5/17.9 0.3/8.9/19.4
Total BUSCO found 91.9/89.5/82.1 99.7/91.1/80.6
Annotation
Number of protein-coding genes 29701 -
Number of functionally annotated proteins 28783 -
Average CDS length 1561.42 -
Longest CDS 49643 -
Average protein length 373.45 -
Longest protein 16525 -
Average number of exon per gene 6.59 -
# All statistics are based on contigs/scaffolds of size >= 200 bp.
150
* From a total of 978 genes of Metazoa library profile.
151
- From a total of 2586 genes of Vertebrata library profile.
152
+ From a total of 4584 genes of Actinopterygii library profile.
153
2.6. Genome annotation
154
The genome annotation of sardine was performed using two-pass iterative MAKER (v 2.31.9)
155
pipeline [30]. Previously to running Maker, we identified repetitive sequences in our genome
156
assembly using an approach described in [31]. Briefly, RepeatModeler (v1.0.8) [32], LTRharvest [33]
part of genometools (v1.5.7) [34] and TransposonPSI [35] were used in combination to create a set of
158
putative repeats. Elements with a single match against a UniProtKB/SwissProt database and not
159
against the database of known repeated elements included in RepeatMasker were removed. The
160
remaining elements were classified and combined with known repeat elements from RepBase
161
(release 20150807) [36].Then, the custom repeat database RepBase-derived and RepeatMasker library
162
(release 20150807) [36] were used in the RepeatMasker (v4.0.6) [37] inside the Maker pipeline. In
163
addition to the previously described Trinity-based transcriptome assembly, the transcriptome reads
164
were mapped to the genome with HISAT (v2.0.5) [38,39] and assembled with StringTie (v1.3.1) [40].
165
The mapped reads were used to train the GeneMark-ET (v4.32) and AUGUSTUS (v3.2.3) [41] ab initio
166
gene predictors via the tool BRAKER (v1.11) [42]. Splice junctions were detected from the mapped
167
reads with Portcullis (v1.02) [43] and these were used as input to Mikado (v1.2.2) [44] together with
168
the StringTie and Trinity transcriptome assemblies to merge the redundant transcripts. The resulting
169
GFF file was used as input to Maker (as est_gff). The predicted genes from GeneMark-ET were also
170
used as input to Maker (as pred_gff), but only in the first iteration since Maker keeps the gene names
171
as given by GeneMark-ET and uses them in the output GFF of Maker which can cause issues with
172
downstream analysis. The first iteration of Maker (which also included proteins from the
173
UniProtKB/SwissProt, cleaned of transposable element proteins) was used to train SNAP
174
(v2013_11_29) [45] with the transcriptome, protein evidence and custom library of repeats. In the
175
second iteration, we did not use the GeneMark-ET predictions but utilized Augustus and SNAP, in
176
addition to the UniProtKB/SwissProt database and the transcriptome.
177
To functionally annotate the genes and protein models we used two independent approaches.
178
First, we used a BLAST(v2.6.0) [46] methodology with the following parameters (blast-p, -evalue
179
1e−5, -seg yes, -soft masking true, -lcase masking, and -num_alignments 1), against the
180
UniProtKB/SwissProt database. In the second approach we opted by the inclusion of InterProScan
181
[47] searches. The outputs of both approaches were used to refine the gene and protein models, as
182
established in protocols of Campbell et al. (2014) [30]. Finally, our dataset contained 29701 genes,
183
which were selected based on a maximum AED (Annotation Edit Distance) score of <= 0.5 (from 0 to
184
1, where the 0 corresponds to highly evidence support and 1 corresponds to no evidence support)
185
(Table 1). The number of predicted coding genes in our dataset is higher than that previously
186
calculated for the Clupea harengus genome (23336 coding gene models) [10]. This discrepancy likely
187
reflects a higher level of gene fragmentation in our assembly, which does not impact the application
188
of the dataset for experimental research (see below).
189
To obtain a broad overview of the annotated gene repertoire in the Clupeidae family, we also
190
compared the ortholog gene collection of sardine with other teleost species including another clupeid,
191
C. harengus [48] and to two well annotated genomes from the sister clade, the Otophysa [2] (for
192
details see Additional Material Methods in Additional File 1). Using the Orthofinder v2.2.6 [48], we
193
identified 24677 clusters of orthologs genes in the sardine genome: 13433 orthogroups shared among
194
the four species and at least 690 orthogroups shared exclusively between sardine and herring of the
195
Clupeidae family (Fig. 2A). A total of 8679 orthogroups were found to be exclusive of sardine, with
196
this number likely reflecting gene fragmentation in the assembly process.
197
Figure 2. Genome evolution and phylogenomics. (A) Orthologous gene families across four fish
199
genomes (European sardine, zebrafish, herring and blind cave fish). (B) Phylogeny of vertebrates
200
(lamprey as the outgroup species); numbers at nodes represent bootstrap values.
201
2.7. Sardine phylogenomics
202
The phylogenomic analysis was conducted with gene orthologues from 17 fish species,
203
representing 13 orders, providing an ample representation of teleost diversity, with a specific focus
204
in clupeidae. Transcriptomic sequences for S. pilchardus, C. harengus, Alosa alosa and Scomber
205
colias were clustered based on sequence similarity with zebrafish sequences. Briefly, a blast-p output
206
was filtered to obtain only hits with a percent identity equal or higher than 50% and a length of at
207
least 30 amino acids. We then selected the hit with highest bitscore. Zebrafish orthologs were
208
retrieved from the ENSEMBL database [49] for all the 17 fish species available and assigned to the
209
respective cluster. In order to avoid paralogs only clusters with one sequence per species were
210
considered, resulting in 106 orthologs clusters that included all species (Additional File 3). Amino
211
acid sequences were then aligned with MAFFT v.7.402 [50] using the model L-INS-i, recommended
212
for a small number of sequences with long gaps. The resulting 106 sequences alignments were then
213
concatenated (42267bp long). A maximum-likelihood phylogenetic inference for the concatenated
214
protein alignment was done in ExaML v.3 [51], including 100 bootstrap replicates, under
215
protgammaauto option and was computed parsimony starting trees for each replicate, using RAxML
216
v.8.2.12 [52]. In the ExaML tree two major groups can be observed: one that comprises all
217
Actinopterygian and another with the Sarcopterygii and Cephalaspidomorphi in the basal position
218
of the tree. (Fig. 2B) In this tree all species belonging to the Clupeiformes order are clustered together
219
and the same for Tetraodontiformes and Cyprinodontiformes. Perciformes are the only order that is
220
separated into two, with Oreochromis niloticus closely related to Cyprinodontiformes and S. colias
221
with Gasterosteiformes. The position of Lepisosteus oculatus at the base of the actinopterygian cluster
222
was also recovered with maximum support. Overall, our phylogenetic analysis demonstrates the
223
phylogenetic position of the European sardine together with other clupeids such as the allis shad (A.
224
alosa) and the Atlantic herring (Fig. 2B). The same general phylogenetic relationships were recovered
225
when the concatenated mitochondrial dataset of protein-coding genes was used. The only exception
226
position was the A. mexicanus, that it was clustered together (with low statistical support) with
227
Clupeiformes and not with zebrafish (Additional Material Methods and Additional Fig. 4 of
228
Additional File 1, and Additional Table 4 in Additional File 2).
229
2.8. Mitochondrial genome
230
We used NOVOPlasty (v2.6.5) [53] to perform the de novo assembly of the sardine
231
mitochondrial genome (mtDNA). The assembly was executed using the raw whole genome
232
sequencing reads only with the adapters removed (authors' instructions) and using a cox1 mtDNA
233
gene nucleotide sequence of the same species (NCBI accession number NC_009592.1 (5484...7034)).
234
The k-mers length was set to 39, 50, and 75 bp, and all assembly runs resulted in the same mtDNA
235
circular contig with total length of 17755 bp. We also used NOVOPlasty to detect heteroplasmy in the
236
newly assembled mtDNA with a minimum minor allele frequency option set to 0.01 (heteroplasmy
237
detection of >1%). Two heteroplasmic positions were detected in the kmer-75 at positions 3500 (from
238
T to G, alternative allele frequency of 1.23%, depth of coverage of 326, located in mt-nd1 gene) and
239
another at position 10208 (from T to C, alternative allele frequency of 1.02%, depth of coverage of 391,
240
located in mt-nad4l gene). Mitochondrial gene annotations were performed using MITOS (v2)[54]
241
and tRNAs gene limits were rechecked with ARWEN (v1.2) [55]. All typical Metazoan genes were
242
annotated (13 protein coding genes, 22 transfer RNAs, and 2 ribosomal RNAs, Additional Fig. 3 in
243
Additional File 1). The complete mtDNA was deposited in GenBank (Additional Table 1 in
244
Additional File 2).
245
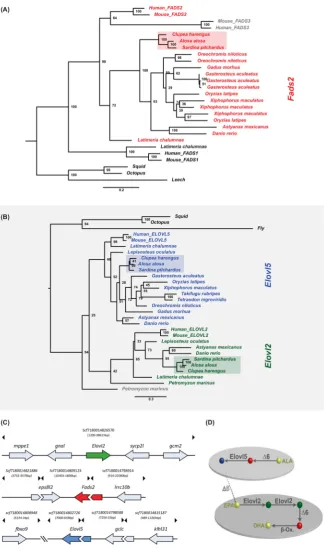
2.9. Gene orthologs of LC-PUFA desaturation and elongation are present in the sardine genome and
246
To demonstrate the biological value of the omics datasets, we next investigated the key enzymes
248
of LC-PUFA biosynthesis in the sardine draft genome and liver transcriptome, a major metabolic site
249
for PUFA metabolism [15]. More specifically, we determined the repertoire and function of genes
250
encoding fatty acyl desaturases (Fads) and elongation of very long chain fatty acid (Elovl) proteins
251
with pivotal roles in LC-PUFA biosynthesis [3]. Among fads, our data unequivocally show that the
252
European sardine possess one single fads-like gene that was confirmed to be orthologous to fads2
253
(Fig. 3A and C) (for details see Additional Material Methods in Additional File 1 and Additional File
254
4). Our microsynteny analyses confirmed the conservation of the reconstructed locus, when
255
compared to C. harengus, and further supported the absence of fads1 from sardine’s genome, in
256
agreement with the loss of this tandem gene duplicate during teleost evolution (Fig. 3C, Additional
257
Tables 5 and 6 in Additional File 2) [16]. Among elovl, we identified two elovl-like sequences, namely
258
elovl2 and elovl5, with well-known roles in LC-PUFA biosynthetic pathways (Fig. 3B). Again,
259
microsynteny conservation was found in the reconstructed loci. While elovl5 is present in virtually
260
all teleosts [3,56], elovl2 has only been described in a few of species and reported to be lost in the
261
Neoteleostei [56]. Thus, the presence of an elovl2 gene in sardine is consistent with the phylogenetic
262
location of this species within the Otomorpha group to which species with characterized elovl2
263
belong [57,58]. Accession numbers for the herein isolated fads2, elovl2 and elovl5 gene orthologs have
264
been deposited in GenBank (Additional Table 1 in Additional File 2) and are located within genome
265
scaffold numbers: fads2 - scaffolds scf7180014809123 and scf7180014798914; elovl2 - scaffold
266
scf7180014826570; and elovl5 - scaffolds scf7180014798588 and scf7180014802726 (for details see
267
Additional Material Methods in Additional File 1 and Additional Table 5 in Additional File 2).
269
Figure 3. Maximum likelihood phylogenetic analysis of fads2 (A) and elovl orthologues (B) analyzed
270
in the present study: Clupeiformes species are highlighted, node numbers indicate bootstrap values.
271
(C) Reconstructed genomic loci of fads2, elovl2 and elovl5 denote synteny conservation between the
272
European sardine and Atlantic herring: scaffold coordinates and identified neighbouring genes are
273
indicated; broken lines and arrows denote reconstruction from overlapping scaffolds. (D) LC-PUFA
274
biosynthesis pathway in the European sardine, dashed line indicates the Δ5 desaturation capacity
275
absent in the European sardine, n-3 fatty acids are indicated in yellow: ALA - α-Linolenic acid
(18:3n-276
3), EPA - eicosapentaenoic acid (20:5n-3) and DHA – docosahexaenoic acid (22:6n-3).
277
We next examined the function of the enzymes encoded by the fads2, elovl2 and elovl5 genes to
280
establish their contribution to LC-PUFA biosynthesis in sardine using an established yeast-based
281
expression system [59] (Fig. 3D) (Additional Table 7 in Additional File 2; see Additional Material
282
Methods in Additional File 1 for details). The sardine fads2 encodes a desaturase with Δ6 and Δ8
283
desaturase activities (Additional Tables 8 and 9 in Additional File 2), typical from vertebrates Fads2
284
enzymes [3]. Both Elovl2 and Elovl5 were capable of elongating polyunsaturated fatty acids from 18
285
to 22 carbons, consistent with activities reported in other vertebrate orthologs (Additional Table 10
286
in Additional File 2). Such enzymatic capabilities enable sardines to produce docosahexaenoic acid
287
(DHA) synthesis from eicosapentaenoic acid (EPA, 20:5n-3). However, the lack of Δ5 desaturation
288
capacity strongly suggests that sardine is unable to produce EPA endogenously or arachidonic acid
289
(ARA, 20:4n-6) (Fig. 3D) and therefore we can establish that both EPA and ARA are dietary essential
290
nutrients for this species. Importantly, these results clearly illustrate the validity of the herein released
291
omics datasets for nutrigenomic studies.
292
3. Conclusion
293
We generated a draft genome assembly and liver transcriptome of the commercially important
294
European sardine. We further demonstrate the power of this dataset by exploring the endogenous
295
capacity of sardines (clupeids) to biosynthesize LC-PUFAs. The information retrieved here, and made
296
publicly available, will further contribute not only to elucidate the fundamentals of physiology,
297
endocrinology, reproduction and nutrition of sardine, providing an essential framework for future
298
conservation and sustainable exploitation of this iconic species, but will also contribute to future
299
comparative genomic studies, notably regarding life history strategies among teleosts.
300
Supplementary Materials: The following are available online, Additional File 1 containing Additional Figures
301
1 to 4, Additional Materials and Methods and Additional References. Additional File 2 contains Additional
302
Tables 1 to 10. Additional Files 3 and 4 contain clusters of sequences used for Sardine Phylogenomics Analyses and
303
gene orthologs of LC-PUFA desaturation and elongation, respectively. The raw sequencing data (RNA-Seq and WGS),
304
genome assembly, transcriptome assembly, mitochondrial genome and isolated LC-PUFA sequences can be
305
consulted via NCBI. All Accession numbers are indicated in Additional Table 1 of Additional File 2. Supporting
306
data such as protein and transcripts from genome as well .gff file of the annotation can be obtained from
307
https://figshare.com/s/98f0644bd974f891143c.
308
Author Contributions: Conceptualization, Rute Da Fonseca and L. Filipe C. Castro; Data curation, André
309
Machado, Ole Tørresen and Miguel Fonseca; Funding acquisition, L. Filipe C. Castro; Investigation, André
310
Machado, Ole Tørresen, Naoki Kabeya, Alvarina Couto, Bent Petersen, Paula Campos, Elza Fonseca, Narcisa
311
Bandarra, Mónica Lopes-Marques, Renato Ferraz, Raquel Ruivo, Miguel Fonseca, Sissel Jentoft, Óscar Monroig,
312
Rute Da Fonseca and L. Filipe C. Castro; Resources, Mónica Felício; Supervision, Sissel Jentoft, Óscar Monroig,
313
Rute Da Fonseca and L. Filipe C. Castro; Validation, André Machado and Ole Tørresen; Writing – original draft,
314
André Machado, Óscar Monroig, Rute Da Fonseca and L. Filipe C. Castro; Writing – review & editing, Ole
315
Tørresen, Naoki Kabeya, Alvarina Couto, Bent Petersen, Mónica Felício, Paula Campos, Elza Fonseca, Narcisa
316
Bandarra, Mónica Lopes-Marques, Renato Ferraz, Raquel Ruivo, Miguel Fonseca and Sissel Jentoft.
317
Funding: We acknowledge the North Portugal Regional Operational Program (NORTE 2020), under the
318
PORTUGAL 2020 Partnership Agreement, through the European Regional Development Fund (ERDF) that
319
supported this research through the MarInfo – Integrated Platform for Marine Data Acquisition and Analysis
320
(reference NORTE-01-0145-FEDER-000031). R.R.F. thanks the Danish National Research Foundation for its
321
support of the Center for Macroecology, Evolution, and Climate (grant DNRF96).
322
Acknowledgments: Some computational work was performed on the Abel Supercomputing Cluster
323
(Norwegian metacenter for High Performance Computing (NOTUR) and the University of Oslo) operated by
324
the Research Computing Services group at USIT, the University of Oslo IT-department
325
(http://www.hpc.uio.no/). We would like to thank Jette Bornholdt, Amal Al-Chaer and George Pacheco for help
326
with laboratory procedures, and the Bioinformatics Center of the University of Copenhagen for providing
327
laboratory space. This work is part of the CIIMAR-lead initiative Portugal-Fishomics.
328
References
330
1. Ravi, V.; Venkatesh, B. The divergent genomes of teleosts. Annu. Rev. Anim. Biosci. 2018, 6, 47–68,
331
doi:10.1146/annurev-animal-030117-014821.
332
2. Hughes, L. C.; Ortí, G.; Huang, Y.; Sun, Y.; Baldwin, C. C.; Thompson, A. W.; Arcila, D.; Betancur-R., R.; Li,
333
C.; Becker, L.; Bellora, N.; Zhao, X.; Li, X.; Wang, M.; Fang, C.; Xie, B.; Zhou, Z.; Huang, H.; Chen, S.;
334
Venkatesh, B.; Shi, Q. Comprehensive phylogeny of ray-finned fishes (Actinopterygii) based on
335
transcriptomic and genomic data. Proc. Natl. Acad. Sci. 2018, 115, 6249–6254, doi:10.1073/pnas.1719358115.
336
3. Castro, L. F. C.; Tocher, D. R.; Monroig, O. Long-chain polyunsaturated fatty acid biosynthesis in chordates:
337
Insights into the evolution of Fads and Elovl gene repertoire. Prog. Lipid Res. 2016, 62, 25–40,
338
doi:10.1016/j.plipres.2016.01.001.
339
4. Ghasemifard, S.; Turchini, G. M.; Sinclair, A. J. Omega-3 long chain fatty acid “bioavailability”: A review
340
of evidence and methodological considerations. Prog. Lipid Res. 2014, 56, 92–108, doi:
341
10.1016/j.plipres.2014.09.001.
342
5. FAO. State of world fisheries and aquaculture (SOFIA) - Meeting the sustainable development goals; 1st
343
ed.; FAO: Rome, Italy, 2018; ISBN 978-92-5-130562-1.
344
6. Instituto Nacional de Estatística (INE). Estatísticas da Pesca - 2016; 1st ed.; Instituto Nacional de Estatística:
345
Lisboa, Portugal, 2017; ISBN 978-989-25-0393-6.
346
7. Silva, A.; Moreno, A.; Riveiro, I.; Santos, B.; Pita, C.; Rodrigues, J. G.; Villasante, S.; Pavlowski, L.; Duhamel,
347
E. Sardine fisheries: resource assessment and social and economic situation; European Parliament: Brussels,
348
Belgium, 2015; ISBN 978-92-823-8384-1.
349
8. Bandarra, N. M.; Marçalo, A.; Cordeiro, A. R.; Pousão-Ferreira, P. Sardine (Sardina pilchardus) lipid
350
composition: Does it change after one year in captivity? Food Chem. 2018, 244, 408–413,
351
doi:10.1016/j.foodchem.2017.09.147.
352
9. Olmedo, M.; Iglesias, J.; Peleteiro, J.; Forés, R.; Miranda, A. Acclimatization and induced spawning of
353
sardine Sardina pilchardus Walbaum in captivity. J. Exp. Mar. Bio. Ecol. 1990, 140, 61–67,
doi:10.1016/0022-354
0981(90)90081-M.
355
10. Fernandez-Silva, I.; Henderson, J. B.; Rocha, L. A.; Simison, W. B. Whole-genome assembly of the coral reef
356
Pearlscale Pygmy Angelfish (Centropyge vrolikii). Sci. Rep. 2018, 8, 1498, doi:10.1038/s41598-018-19430-x.
357
11. Malmstrøm, M.; Matschiner, M.; Tørresen, O. K.; Star, B.; Snipen, L. G.; Hansen, T. F.; Baalsrud, H. T.;
358
Nederbragt, A. J.; Hanel, R.; Salzburger, W.; Stenseth, N. C.; Jakobsen, K. S.; Jentoft, S. Evolution of the
359
immune system influences speciation rates in teleost fishes. Nat. Genet. 2016, 48, 1204–1210,
360
doi:10.1038/ng.3645.
361
12. Nakamura, Y.; Mori, K.; Saitoh, K.; Oshima, K.; Mekuchi, M.; Sugaya, T.; Shigenobu, Y.; Ojima, N.; Muta,
362
S.; Fujiwara, A.; Yasuike, M.; Oohara, I.; Hirakawa, H.; Chowdhury, V. S.; Kobayashi, T.; Nakajima, K.;
363
Sano, M.; Wada, T.; Tashiro, K.; Ikeo, K.; Hattori, M.; Kuhara, S.; Gojobori, T.; Inouye, K. Evolutionary
364
changes of multiple visual pigment genes in the complete genome of Pacific bluefin tuna. Proc. Natl. Acad.
365
Sci. U. S. A. 2013, 110, 11061–11066, doi:10.1073/pnas.1302051110.
366
13. Malmstrøm, M.; Matschiner, M.; Tørresen, O. K.; Jakobsen, K. S.; Jentoft, S. Whole genome sequencing data
367
and de novo draft assemblies for 66 teleost species. Sci. Data 2017, 4, 160132, doi:10.1038/sdata.2016.132.
368
14. Martinez Barrio, A.; Lamichhaney, S.; Fan, G.; Rafati, N.; Pettersson, M.; Zhang, H.; Dainat, J.; Ekman, D.;
369
Höppner, M.; Jern, P.; Martin, M.; Nystedt, B. B.; Liu, X.; Chen, W.; Liang, X.; Shi, C.; Fu, Y.; Ma, K.; Zhan,
370
X.; Feng, C.; Gustafson, U.; Rubin, C.-J. J.; Sällman Almén, M.; Blass, M.; Casini, M.; Folkvord, A.; Laikre,
371
L.; Ryman, N.; Ming-Yuen Lee, S.; Xu, X.; Andersson, L.; Barrio, A. M.; Lamichhaney, S.; Fan, G.; Rafati, N.;
372
Pettersson, M.; Zhang, H.; Dainat, J.; Ekman, D.; H�ppner, M.; Jern, P.; Martin, M.; Nystedt, B. B.; Liu,
373
X.; Chen, W.; Liang, X.; Shi, C.; Fu, Y.; Ma, K.; Zhan, X.; Feng, C.; Gustafson, U.; Rubin, C.-J. J.; Alm�n,
374
M.; Blass, M.; Casini, M.; Folkvord, A.; Laikre, L.; Ryman, N.; Lee, S. Y.; Xu, X.; Andersson, L. The genetic
375
basis for ecological adaptation of the Atlantic herring revealed by genome sequencing. Elife 2016, 5, 1–32,
376
doi:10.7554/eLife.12081.
377
15. Monroig, O.; Tocher, D. R.; Castro, L. F. C. Polyunsaturated Fatty Acid Biosynthesis and Metabolism in
378
Fish; Burdge, G., Ed.; 1st Editio.; AOCS Press, 2018; ISBN 9780128112304.
379
16. Castro, L. F. C.; Monroig, Ó.; Leaver, M. J.; Wilson, J.; Cunha, I.; Tocher, D. R. Functional desaturase fads1
380
(Δ5) and fads2 (Δ6) orthologues evolved before the origin of jawed vertebrates. PLoS One 2012, 7, e31950,
381
17. Bolger, A. M.; Lohse, M.; Usadel, B. Trimmomatic: A flexible trimmer for Illumina sequence data.
383
Bioinformatics 2014, 30, 2114–2120, doi:10.1093/bioinformatics/btu170.
384
18. Grabherr, M. G.; Haas, B. J.; Yassour, M.; Levin, J. Z.; Thompson, D. A.; Amit, I.; Adiconis, X.; Fan, L.;
385
Raychowdhury, R.; Zeng, Q.; Chen, Z.; Mauceli, E.; Hacohen, N.; Gnirke, A.; Rhind, N.; di Palma, F.; Birren,
386
B. W.; Nusbaum, C.; Lindblad-Toh, K.; Friedman, N.; Regev, A. Full-length transcriptome assembly from
387
RNA-Seq data without a reference genome. Nat. Biotechnol. 2011, 29, 644–652, doi:10.1038/nbt.1883.
388
19. Machado, A. M.; Felício, M.; Fonseca, E.; da Fonseca, R. R.; Castro, L. F. C. A resource for sustainable
389
management: De novo assembly and annotation of the liver transcriptome of the Atlantic chub mackerel,
390
Scomber colias. Data Br. 2018, 18, 276–284, doi:10.1016/j.dib.2018.03.013.
391
20. Lafond-Lapalme, J.; Duceppe, M. O.; Wang, S.; Moffett, P.; Mimee, B. A new method for decontamination
392
of de novo transcriptomes using a hierarchical clustering algorithm. Bioinformatics 2017, 33, 1293–1300,
393
doi:10.1093/bioinformatics/btw793.
394
21. Simão, F. A.; Waterhouse, R. M.; Ioannidis, P.; Kriventseva, E. V.; Zdobnov, E. M. BUSCO: assessing
395
genome assembly and annotation completeness with single-copy orthologs. Bioinformatics 2015, 31, 3210–
396
3212, doi:10.1093/bioinformatics/btv351.
397
22. Vurture, G. W.; Sedlazeck, F. J.; Nattestad, M.; Underwood, C. J.; Fang, H.; Gurtowski, J.; Schatz, M. C.
398
GenomeScope: Fast reference-free genome profiling from short reads. In Bioinformatics; 2017; 33, 2202–
399
2204, doi: 10.1093/bioinformatics/btx153.
400
23. Chikhi, R.; Medvedev, P. Informed and automated k-mer size selection for genome assembly.
401
Bioinformatics 2014, 30, 31–37, doi:10.1093/bioinformatics/btt310.
402
24. Ahn, D. H.; Shin, S. C.; Kim, B. M.; Kang, S.; Kim, J. H.; Ahn, I.; Park, J.; Park, H. Draft genome of the
403
Antarctic dragonfish, Parachaenichthys charcoti. Gigascience 2017, 6, 1–6, doi:10.1093/gigascience/gix060.
404
25. Li, H.; Durbin, R. Fast and accurate short read alignment with Burrows-Wheeler transform. Bioinformatics
405
2009, 25, 1754–1760, doi:10.1093/bioinformatics/btp324.
406
26. Depristo, M. A.; Banks, E.; Poplin, R.; Garimella, K. V; Maguire, J. R.; Hartl, C.; Philippakis, A. A.; Del
407
Angel, G.; Rivas, M. A.; Hanna, M.; McKenna, A.; Fennell, T. J.; Kernytsky, A. M.; Sivachenko, A. Y.;
408
Cibulskis, K.; Gabriel, S. B.; Altshuler, D.; Daly, M. J. A framework for variation discovery and genotyping
409
using next-generation DNA sequencing data. Nat. Genet. 2011, 43, 491–501, doi:10.1038/ng.806.
410
27. Gurevich, A.; Saveliev, V.; Vyahhi, N.; Tesler, G. QUAST: Quality assessment tool for genome assemblies.
411
Bioinformatics 2013, 29, 1072–1075, doi:10.1093/bioinformatics/btt086.
412
28. Mapleson, D.; Accinelli, G. G.; Kettleborough, G.; Wright, J.; Clavijo, B. J. KAT: A K-mer analysis toolkit to
413
quality control NGS datasets and genome assemblies. Bioinformatics 2017, 33, 574–576,
414
doi:10.1093/bioinformatics/btw663.
415
29. Kent, W. J. BLAT - The BLAST-like alignment tool. Genome Res. 2002, 12, 656–664, doi:10.1101/gr.229202.
416
30. Campbell, M. S.; Holt, C.; Moore, B.; Yandell, M. Genome Annotation and Curation Using MAKER and
417
MAKER-P. Curr. Protoc. Bioinforma. 2014, 2014, 4.11.1-4.11.39, doi:10.1002/0471250953.bi0411s48.
418
31. Tørresen, O. K.; Star, B.; Jentoft, S.; Reinar, W. B.; Grove, H.; Miller, J. R.; Walenz, B. P.; Knight, J.; Ekholm,
419
J. M.; Peluso, P.; Edvardsen, R. B.; Tooming-Klunderud, A.; Skage, M.; Lien, S.; Jakobsen, K. S.; Nederbragt,
420
A. J. An improved genome assembly uncovers prolific tandem repeats in Atlantic cod. BMC Genomics
421
2017, 18, 95, doi:10.1186/s12864-016-3448-x.
422
32. Price, A. L.; Jones, N. C.; Pevzner, P. A. De novo identification of repeat families in large genomes.
423
Bioinformatics 2005, 21, i351–i358, doi:10.1093/bioinformatics/bti1018.
424
33. Ellinghaus, D.; Kurtz, S.; Willhoeft, U. LTRharvest, an efficient and flexible software for de novo detection
425
of LTR retrotransposons. BMC Bioinformatics 2008, 9, 18, doi:10.1186/1471-2105-9-18.
426
34. Gremme, G.; Steinbiss, S.; Kurtz, S. Genome tools: A comprehensive software library for efficient
427
processing of structured genome annotations. IEEE/ACM Trans. Comput. Biol. Bioinforma. 2013, 10, 645–
428
656, doi:10.1109/TCBB.2013.68.
429
35. TransposonPSI: An application of PSI-Blast to mine (retro-)transposon ORF homologies. Available online:
430
http://transposonpsi.sourceforge.net/. (accessed on 18 April 2018).
431
36. Jurka, J.; Kapitonov, V. V.; Pavlicek, A.; Klonowski, P.; Kohany, O.; Walichiewicz, J. Repbase Update, a
432
database of eukaryotic repetitive elements. Cytogenet. Genome Res. 2005, 110, 462–467,
433
doi:10.1159/000084979.
434
37. Tarailo-Graovac, M.; Chen, N. Using RepeatMasker to identify repetitive elements in genomic sequences.
435
38. Pertea, M.; Kim, D.; Pertea, G. M.; Leek, J. T.; Salzberg, S. L. Transcript-level expression analysis of
RNA-437
seq experiments with HISAT, StringTie and Ballgown. Nat. Protoc. 2016, 11, 1650–1667,
438
doi:10.1038/nprot.2016.095.
439
39. Kim, D.; Langmead, B.; Salzberg, S. L. HISAT: A fast spliced aligner with low memory requirements. Nat.
440
Methods 2015, 12, 357–360, doi:10.1038/nmeth.3317.
441
40. Pertea, M.; Pertea, G. M.; Antonescu, C. M.; Chang, T. C.; Mendell, J. T.; Salzberg, S. L. StringTie enables
442
improved reconstruction of a transcriptome from RNA-seq reads. Nat. Biotechnol. 2015, 33, 290–295,
443
doi:10.1038/nbt.3122.
444
41. Stanke, M.; Steinkamp, R.; Waack, S.; Morgenstern, B. AUGUSTUS: A web server for gene finding in
445
eukaryotes. Nucleic Acids Res. 2004, 32, W309–W312, doi:10.1093/nar/gkh379.
446
42. Hoff, K. J.; Lange, S.; Lomsadze, A.; Borodovsky, M.; Stanke, M. BRAKER1: Unsupervised RNA-Seq-based
447
genome annotation with GeneMark-ET and AUGUSTUS. Bioinformatics 2015, 32, 767–769,
448
doi:10.1093/bioinformatics/btv661.
449
43. Mapleson, D.; Venturini, L.; Kaithakottil, G.; Swarbreck, D. Efficient and accurate detection of splice
450
junctions from RNAseq with Portcullis. bioRxiv 2017, 217620, doi:10.1101/217620.
451
44. Venturini, L.; Caim, S.; Kaithakottil, G. G.; Mapleson, D. L.; Swarbreck, D. Leveraging multiple
452
transcriptome assembly methods for improved gene structure annotation. Gigascience 2018, 7, giy093,
453
doi:10.1093/gigascience/giy093.
454
45. Grenon, P.; Smith, B. SNAP and SPAN: Towards dynamic spatial ontology. Spat. Cogn. Comput. 2004, 4,
455
69–104, doi:10.1207/s15427633scc0401_5.
456
46. Altschul, S. F.; Gish, W.; Miller, W.; Myers, E. W.; Lipman, D. J. Basic local alignment search tool. J. Mol.
457
Biol. 1990, 215, 403–410, doi:10.1016/S0022-2836(05)80360-2.
458
47. Quevillon, E.; Silventoinen, V.; Pillai, S.; Harte, N.; Mulder, N.; Apweiler, R.; Lopez, R. InterProScan:
459
Protein domains identifier. Nucleic Acids Res. 2005, 33, W116–W120, doi:10.1093/nar/gki442.
460
48. Wang, Y.; Coleman-Derr, D.; Chen, G.; Gu, Y. Q. OrthoVenn: A web server for genome wide comparison
461
and annotation of orthologous clusters across multiple species. Nucleic Acids Res. 2015, 43, W78–W84,
462
doi:10.1093/nar/gkv487.
463
49. Kersey, P. J.; Allen, J. E.; Allot, A.; Barba, M.; Boddu, S.; Bolt, B. J.; Carvalho-Silva, D.; Christensen, M.;
464
Davis, P.; Grabmueller, C.; Kumar, N.; Liu, Z.; Maurel, T.; Moore, B.; McDowall, M. D.; Maheswari, U.;
465
Naamati, G.; Newman, V.; Ong, C. K.; Paulini, M.; Pedro, H.; Perry, E.; Russell, M.; Sparrow, H.; Tapanari,
466
E.; Taylor, K.; Vullo, A.; Williams, G.; Zadissia, A.; Olson, A.; Stein, J.; Wei, S.; Tello-Ruiz, M.; Ware, D.;
467
Luciani, A.; Potter, S.; Finn, R. D.; Urban, M.; Hammond-Kosack, K. E.; Bolser, D. M.; De Silva, N.; Howe,
468
K. L.; Langridge, N.; Maslen, G.; Staines, D. M.; Yates, A. Ensembl Genomes 2018: An integrated omics
469
infrastructure for non-vertebrate species. Nucleic Acids Res. 2018, 46, D802–D808, doi:10.1093/nar/gkx1011.
470
50. Katoh, K.; Misawa, K.; Kuma, K.; Miyata, T. MAFFT: a novel method for rapid multiple sequence alignment
471
based on fast Fourier transform. Nucleic Acids Res. 2002, 30, 3059–3066, doi:10.1093/nar/gkf436.
472
51. Kozlov, A. M.; Aberer, A. J.; Stamatakis, A. ExaML version 3: A tool for phylogenomic analyses on
473
supercomputers. Bioinformatics 2015, 31, 2577–2579, doi:10.1093/bioinformatics/btv184.
474
52. Stamatakis, A. RAxML version 8: A tool for phylogenetic analysis and post-analysis of large phylogenies.
475
Bioinformatics 2014, 30, 1312–1313, doi:10.1093/bioinformatics/btu033.
476
53. Dierckxsens, N.; Mardulyn, P.; Smits, G. NOVOPlasty: De novo assembly of organelle genomes from whole
477
genome data. Nucleic Acids Res. 2016, 45, e18, doi:10.1093/nar/gkw955.
478
54. Bernt, M.; Donath, A.; Jühling, F.; Externbrink, F.; Florentz, C.; Fritzsch, G.; Pütz, J.; Middendorf, M.;
479
Stadler, P. F. MITOS: Improved de novo metazoan mitochondrial genome annotation. Mol. Phylogenet.
480
Evol. 2013, 69, 313–319, doi:10.1016/j.ympev.2012.08.023.
481
55. Laslett, D.; Canbäck, B. ARWEN: A program to detect tRNA genes in metazoan mitochondrial nucleotide
482
sequences. Bioinformatics 2008, 24, 172–175, doi:10.1093/bioinformatics/btm573.
483
56. Monroig, Ó.; Lopes-Marques, M.; Navarro, J. C.; Hontoria, F.; Ruivo, R.; Santos, M. M.; Venkatesh, B.;
484
Tocher, D. R.; C. Castro, L. F. Evolutionary functional elaboration of the Elovl2/5 gene family in chordates.
485
Sci. Rep. 2016, 6, 20510, doi:10.1038/srep20510.
486
57. Morais, S.; Monroig, O.; Zheng, X.; Leaver, M. J.; Tocher, D. R. Highly unsaturated fatty acid synthesis in
487
Atlantic salmon: Characterization of ELOVL5- and ELOVL2-like elongases. Mar. Biotechnol. 2009, 11, 627–
488
58. Oboh, A.; Betancor, M. B.; Tocher, D. R.; Monroig, O. Biosynthesis of long-chain polyunsaturated fatty acids
490
in the African catfish Clarias gariepinus: Molecular cloning and functional characterisation of fatty acyl
491
desaturase (fads2) and elongase (elovl2) cDNAs. Aquaculture 2016, 462, 70–79,
492
doi:10.1016/j.aquaculture.2016.05.018.
493
59. Kabeya, N.; Yevzelman, S.; Oboh, A.; Tocher, D. R.; Monroig, O. Essential fatty acid metabolism and
494
requirements of the cleaner fish, ballan wrasse Labrus bergylta: Defining pathways of long-chain
495
polyunsaturated fatty acid biosynthesis. Aquaculture 2018, 488, 199–206,