City, University of London Institutional Repository
Citation
:
Turkay, C., Slingsby, A., Lahtinen, K., Butt, S. & Dykes, J. (2016). Enhancing a
Social Science Model-building Workflow with Interactive Visualisation. Paper presented at
the The European Symposium on Artificial Neural Networks (ESANN 2016), 27-29 Apr 2016,
Bruges, Belgium.
This is the submitted version of the paper.
This version of the publication may differ from the final published
version.
Permanent repository link:
http://openaccess.city.ac.uk/14232/
Link to published version
:
Copyright and reuse:
City Research Online aims to make research
outputs of City, University of London available to a wider audience.
Copyright and Moral Rights remain with the author(s) and/or copyright
holders. URLs from City Research Online may be freely distributed and
linked to.
City Research Online:
http://openaccess.city.ac.uk/
[email protected]
Enhancing a Social Science Model-building
Workflow with Interactive Visualisation
Cagatay Turkay1, Aidan Slingsby1, Kaisa Lahtinen2, Sarah Butt2, and Jason Dykes1
1- giCentre, Department of Computer Science, City University London, UK 2- Centre for Comparative Social Surveys, City University London, UK
Abstract. Models can help scientists study and understand phenom-ena. Such models need to be informed by theory. We report on the early stages of our ongoing study in which we use interactive visualisation to help improve the construction of theory-driven models, by facilitating the exploration of statistical summaries of input variables, compare the qual-ity of alternative models and keep track of the model-building process. Later work will investigate whether machine-learning techniques can be incorporated without compromising the models’ theoretical bases.
1
Introduction
Two main reasons for which scientists build models are to generate data for analysis or prediction and tounderstand phenomena better. For our case study, although models with good predictive power are important, the models need to be sound and strongly informed by theory. Where there are many variable to choose from, statistical summaries, graphics, statistical techniques are machine-learning techniques often help in the model-building process [1].
For social scientists, it is particularly important that models areinformed by
social science theory. This leads to their general mistrust of machine-learning
techniques in favour of more manual variable-selection approaches. This often results in an overwhelmingly manual approach to model-building, suitable for small numbers of variables but which does not scale to sitations where there are hundreds. In these cases, social scientists need approaches that produce models they can defend to their peers.
The eventual aim of this ongoing study it to use interactive visualisation to incorporate machine-learning techniques to help social scientists deal with large numbers of variables, but to do so in a way that does not compromise their goal of using models to understand the phenomena and obtaining a model they can justify and defend in a social science context. Incorporating interactive visualisation approaches with computational methods has already shown great potential within the field of visual analytics [2]. In this paper, we report onearly
stages of this study, in which we have designed and implemented interactive
ideas on designs and functionalities. Subsequent work will investigate how ex-isting machine-learning techniques can be incorporated without compromising the theoretic basis for the models.
2
Case study: European Social Survey (ESS)
We are working with the European Social Survey (ESS), trying to build models of thepropensity to respond and theresponsesusing a range of different variables rarely used in this type of modelling [3]. Survey participants are from a geo-graphically structured sample of 4,520 addresses selected to take part in Round 6 of the ESS in the UK 2012-13. These data have been linked to auxiliary data from administrative sources, commercial consumer profiling, and open-source data through their geographical locations. The resulting dataset consists of 401 candidate variables which are considered as proxies for a range of social phenomena that might be associated with survey non-response. The aim is to investigate potential for using auxiliary data (i.e., 401 variables) to understand survey non-response bias and how these relate to the survey responses.
The usual approach to this [3] is to identify a set ofsocial theoriesthat might affect survey nonresponse, concepts that might construct these, and variables
that can act as proxies to these. In our case, because we already have variables, we assigned them to one or more of these concepts. However, there are multiple possible interpretations of these elements and building such hierarchies (theories
→concepts→variables) is a process that involves variety and uncertainty.
2.1 Existing model building workflow
The current model-building workflow is to construct models by iteratively adding and/or removing variables from a logistic regression model and assessing the changes through model fitness metrics (e.g., AIC, McFadden). Analyst judg-ment is used to decide on the next steps either to add or remove a variable. The variables chosen depend on the social science theory behind why they were chosen and which variables already exist in the model – a highly manual pro-cess. Statistical summaries and static graphics are used to explore the range and distributions of variables and assessed along with the social science theory for their inclusion. Commands to build models are run in R (statistical package) and the results are summarised on paper as notes and Post-it notes that can be arranged in such as way as to reflect the model-building process.
2.2 Key roles for interactive visualisation
2.2.1 Incorporating Theory
R1: Provide interactive access to theoretical annotations. Variables’ potential
2.2.2 Exploring variables
R2: Provide on-demand statistical and graphical summaries of variables,
com-parisons and relationships to each other. Variables’ potential suitabilities are
also informed by their statistical and geographical distributions and correlations with each other. During the process, analysts need to explore, investigate and compare variables on-demand to maintain a multi-perspective understanding.
2.2.3 Interactively building models
R3: Real-time computation of models on interactively defined domains. Due
to the multidimensional and open-to-interpretation nature of phenomena being modelled, methods to easily trigger model computations with interactively de-fined domains are needed to flexibility compare and contrast several alternatives.
R4: Immediate feedback on model success. Such interactive model building
should also be informed by different metrics of model fitness and success so that the analysts can make judgments easily and efficiently.
2.2.4 Considering Geography
R5: Provide geographically constrained models and statistics. Geographical
as-pects of these response models are important and the drivers of nonresponse bias are likely to vary geographically, thus requires special consideration.
2.2.5 Recording the model-building process, i.e., provenance
R6: Maintain history of model building steps. One critical expectation is to be
able to document the different models built, compare the variables they contain and their performance (often referred to as provenance).
R7: Allow models to be annotated. The scientists need to reflect back on their
process and explain why a variable is kept or discarded from the model. Thus, they need to annotate models with notes to help them recall their decisions.
3
Enhancing the workflow
Using an established approach involving user-centred iterative prototyping/feed-back cycles [4], we designed interactive visualisation to meet these requirements.
3.1 VarXplorer prototype
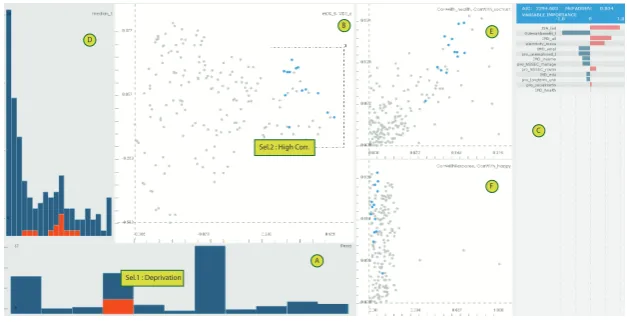
Fig. 1 shows the VarXplorer prototype designed to meet requirements related to understanding the input variables and how they relate to each other (R1 &
A B
C
Sel.1 : Deprivation
Sel.2 : High Corr.
D E
[image:5.595.144.458.144.305.2]F
Fig. 1: VarXplorerto visually explore the variables and interactive model build-ing. Details are given within the text.
general and domain-specific measures and projections: i) Statistical moments such as µ, σ, skewness, etc. ii) correlations with response rate and other key variables such as happiness score, social trust, etc. iii) multidimensional scaling (MDS) on the variables where the distance is pairwise correlations iv) metadata that externalise the concepts/theories variables relate to (R1).
In Fig.1, a selection ofproxies of deprivationis made through an histogram of variable metadata (Fig.1A). The MDS of variables (Fig.1B) reveals variability in deprivation related variables (i.e., not all of them are inter-correlated) and the selected set is refined (with an AND selection) to only those that are correlated. A logistic regression model (response rateas the target) is computed in real-time on this selection of variables. The visual representation of variables’ importance (Fig. 1C) indicate that living on benefits and electric consumption as having higher weights in this model. However, fitness metrics (AIC and McFadden) signals low predictive strength, i.e., 0.034 for McFadden, (Fig. 1C blue bar). Other characteristics of the variables are investigated through a histogram of variation (Fig. 1D), a plot of corr. with health andcorr. with social trust (Fig.
1E), and a plot ofcorr. with response vs.corr. with happiness score (Fig.1F).
3.2 ModelBuilder prototype
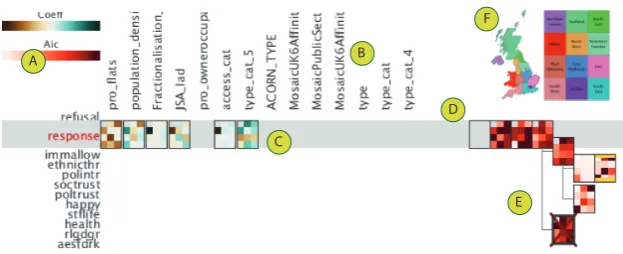
Fig. 2 shows the ModelBuilder prototype designed to meet the requirements related to building models including the incorporation of theory and expert knowledge (R1), interactively-building models (R3) with detail of fit (R4) and models that are fit to all 11 geographical regions (R5), maintaining a history of models built (R6) and allowing annotations to be attached to the models (R7). For a given outcome variable and starting with an empty model root (Fig.
B
C
E A
[image:6.595.145.457.143.270.2]D F
Fig. 2: ModelBuilder. Prototype that implements the model building workflow for an outcome variable (A). See text for explanation.
Fig.2B) creates a new model that adds the variable to the set of variables in the model. As the user adds variables to the model the model tree develops to show the provenance of the process (Fig.2D). The variable’s contribution to the selected model (highlighted in yellow in Fig.2E) is shown for each explanatory variable (brown to green in Fig. 2C) and a measure of the model fit (AIC) is shown for each model (red in Fig.2E). This history is shown as a tree structure (R6), recording the process through which the analyst constructed the model, allowing models to be compared. Free text annotation (R7) allows decisions to be recorded, and a red cross indicates where the analyst considers the iterative process to have reached a dead-end. A separate model is built for each of the 11 geographical regions (R5), laid out geographically in a grid-map [6] according to Fig.2F. This layout depicts both the contribution that the variable makes to the model (Fig. 2B) and the model fit (Fig.2E).
3.2.1 The Model Building Process
The scientists initiate their analysis by investigating the relations within the variables together with their associations with the known social science theory concepts inVarXplorer. This process ends up with a selection of variables which they use as a starting point in building a model in ModelBuilder so they don’t start from an empty model. AndModelBuilderacts as the interactive mechanism to improve the model in a step-wise fashion and keep track of the process.
3.2.2 A brief example of the modelling process
We started with a short list of variables that are important to include in the model to explain non-response (informed by existing literature): % flats in an
area, % people leaving on job-seekers benefit and ethnic fractionlisation, and
as the theoretically matching concepts. We decided that proxies for quality of life are also needed to achieve a more comprehensive model and investigated the correlation relation of variables associated with quality of life to the already existing three and chosecount of cultural facilitiesas the next variable and saved this in the ModelBuilder as an alternative. This not only improved the model fit but also ended up in a more comprehensive coverage of concepts, thus leading to a model that is easier to defend and explain.
4
Discussion, conclusion and further work
Our close and multidisciplinary collaboration using an established user-centred iterative prototyping approach is enabling us to design, implement, and evalu-ate approprievalu-ate visual analytics tools that are tailored to meet current model-building requirements based on an existing workflow. Our weekly feedback meet-ings as part of our user-centred approach have been instrumental in directing the development of the design and prototyping. They have also shown strong potential for visual analytics to more effectively support similar model-building processes in social sciences and beyond, without taking control away from model builders. We presented two of a number of separate tools with distinct roles used alongside others, rather then focussing on a single combined tool. We think this is less disruptive to the modelling-building process and improves adoption. We have also implemented a random-forest classifier where variable weights can be visualised similar to Fig. 1C. The resulting model can be used as a “starting configuration” in ModelBuilder and subsequent work will investigate how such techniques can be incorporated further without compromising the social scien-tists’ expert knowledge so that greater confidence in the models is achieved.
Acknowledgments
This work is partly funded by ADDResponse project funded by the UK Economic and Social Research Council (grant ES/L013118/1).
References
[1] G. James, D. Witten, T. Hastie, and R. Tibshirani.An introduction to statistical learning. Springer, 2013.
[2] D. Keim, F. Mansmann, J. Schneidewind, J. Thomas, and H. Ziegler. Visual analytics: Scope and challenges. InVisual Data Mining, pages 76–90. Springer-Verlag, 2008. [3] R.M. Groves and M.P. Couper.Nonresponse in household interview surveys. John Wiley
& Sons, 2012.
[4] J. Dykes, J. Wood, and A. Slingsby. Rethinking map legends with visualization. IEEE Transactions on Visualization and Computer Graphics, 16(6):890 – 899, November 2010.
[5] C. Turkay, P. Filzmoser, and H. Hauser. Brushing dimensions – a dual visual analysis model for high-dimensional data.Visualization and Computer Graphics, IEEE Transactions on, 17(12):2591–2599, Dec. 2011.