Analysis of chemically labile glycation adducts in seed proteins: a case study of methylglyoxal-derived hydroimidazolone 1 (MG-H1)
Kristina Antonova,1,2§ Maria Vikhnina,1,2§ Alena Soboleva,1,2 Tahir Mehmood,1 Marie-Louise
Heymich,3 Tatiana Leonova,2 Mikhail Bankin,4 Elena Lukasheva,2 Sabrina
Gensberger-Reigl,3 Sergei Medvedev,4 Galina Smolikova,4 Monika Pischetsrieder3 and Andrej Frolov1,2
Supplementary information
1
Department of Bioorganic Chemistry, Leibniz Institute of Plant Biochemistry, 2Department
of Biochemistry, St. Petersburg State University,3Department of Food Chemistry, Universität
Erlangen-Nürnberg, and 4Department of Plant Physiology and Biochemistry, St. Petersburg
State University,
§
These authors contributed equally in the manuscript
*Corresponding author:
Dr. Andrej Frolov
Leibniz Institute of Plant Biochemistry
Department of Bioorganic Chemistry
Weinberg 3, 06120
Halle/Saale, Germany
Tel. +49(0)34555821350
Directory
Protocols... S1-3
Protocol S-1 Solid phase extraction on CHROMABOND HR-XAW weak cation exchanger cartridges... S1-3
Protocol S-2 Solid phase extraction on CHROMABOND HR-XA strong cation exchanger cartridges... S1-4
Protocol S-3 Solid phase extraction on CHROMABOND C18 reversed phase cartridges..S1-5
Tables... S1-6
Table S-1 Protein recoveries and total UV densities calculated for individual pea samples separated by SDS-PAGE... S1-6
Table S-2 Protein recoveries and total UV densities calculated for individual oilseed rape samples separated by SDS-PAGE... S1-7
Table S-3 Instrument settings applied for Orbitrap-LIT-MS and MS/MS experiments...S1-8
Figures... S1-9
Figure S-1 Optimization of protein yield in respect of seed material amounts, taken for phenol extraction... S1-9
Figure S-2 SDS-PAGE electropherograms of glycated bovine serum albumin (BSA), before and after individual steps of enzymatic hydrolysis... S1-11
Figure S-3 SDS-PAGE electropherograms of glycated bovine serum albumin, before and after individual steps of enzymatic hydrolysis... S1-13
Figure S-4 ESI-QqTOF-MS, acquired for enzymatic hydrolysate of pea protein...S1-14
Figure S-5 Recovery of three basic amino acids in SPE procedures, performed with different CHROMABOND cartridges...
S1-155
Figure S-6 Recovery (%) of Nɛ-(carboxymethyl)lysine and lysine on CHROMABOND C18
Protocols
Protocol S-1 Solid phase extraction (SPE) procedure for CHROMABOND HR-XAW weak anion exchanger cartridges
Materials:
SPE cartridges: CHROMABOND HR-XA, 200 mg of material, designed for 3 ml load
volume
Conditioning solution: methanol (LC-MS grade)
Equilibration solution: water
Eluent 1: 0.1 mol/L NaOH in water (MilliQ)
Eluent 2: methanol (LC-MS grade)
Eluent 3: 1% (v/v) aq. formic acid (LC-MS grade) in methanol (LC-MS grade)
Eluent 4: 5% (v/v) aq. formic acid (LC-MS grade) in methanol (LC-MS grade)
Eluent 5: 10% (v/v) aq. formic acid (LC-MS grade) in methanol (LC-MS grade)
Sample aspiration: the mixture of 146.2 µmol lysine, 1.15 µmol arginine and 1.29 µmol
histidine in 1 mL of phosphate buffered saline (PBS) adjusted to pH 10.0 with 25% ammonia
solution
Elution – vacuum-drived, 800-900 mbar
Procedure:
# Step Applied solution Volume (mL)
1 Conditioning Conditioning solution 5
2 Equilibration Equilibration solution 5
3 Sample aspiration 1 mL of PBS adjusted to pH 10.0 1
4 Elution 1 Eluent 1 5
5 Elution 2 Eluent 2 2
7 Elution 4 Eluent 4 4
8 Elution 5 Eluent 5 4
Protocol S-2 Solid phase extraction (SPE) procedure for CHROMABOND HR-XA weak anion exchanger cartridges
Materials:
SPE cartridges: CHROMABOND HR-XA, 200 mg of material, 3 ml load volume
Conditioning solution: methanol (LC-MS grade)
Equilibration solution: water
Eluent 1: methanol (LC-MS grade)
Eluent 2: water (MilliQ)
Eluent 3: 0.1 mol/L NaOH in water (MilliQ)
Eluent 4: methanol (LC-MS grade)
Eluent 5: 1% (v/v) aq. formic acid (LC-MS grade) in methanol (LC-MS grade)
Eluent 6: 5% (v/v) aq. formic acid (LC-MS grade) in methanol (LC-MS grade)
Eluent 7: 10% (v/v) aq. formic acid (LC-MS grade) in methanol (LC-MS grade)
Sample aspiration: the mixture of 146.2 µmol lysine, 1.15 µmol arginine and 1.29 µmol
histidine in 1 mL of phosphate buffered saline (PBS) adjusted to pH 10.0 with 25% ammonia
Elution – vacuum-drived, 800-900 mbar
Procedure:
# Step Applied solution Volume (mL)
1 Conditioning Conditioning solution 5
2 Equilibration Equilibration solution 5
3 Sample aspiration 1 mL of PBS adjusted to pH 10.0 1
4 Elution 1 Eluent 1 5
5 Elution 2 Eluent 2 5
6 Elution 3 Eluent 3 5
8 Elution 5 Eluent 5 4
9 Elution 6 Eluent 6 4
10 Elution 7 Eluent 5 4
Protocol S-3 Solid phase extraction (SPE) procedure for CHROMABOND C18 reversed phase (RP) cartridges
Materials:
SPE cartridges: CHROMABOND C18 reversed phase (RP), 200 mg of material, 3 ml load
Conditioning solution: methanol (LC-MS grade)
Equilibration solution: water
Eluent 1: methanol (LC-MS grade)
Eluent 2: water (MilliQ)
Eluent 3: 0.25 mol/L ammonium acetate (LC-MS grade) in water (MilliQ)
Eluent 4: 0.1 mol/L ammonia (LC-MS grade) in water (MilliQ)
Eluent 5: 1% (v/v) ammonia (LC-MS grade), aq. 10 % (v/v) acetonitrile (LC-MS grade)
Eluent 6: 1% (v/v) ammonia (LC-MS grade), aq. 20 % (v/v) acetonitrile (LC-MS grade)
Eluent 7: 1% (v/v) ammonia (LC-MS grade), aq. 40 % (v/v) acetonitrile (LC-MS grade)
Sample aspiration: the mixture of 146.2 µmol lysine, 1.15 µmol arginine and 1.29 µmol
histidine in 1 mL of phosphate buffered saline (PBS) adjusted to pH 10.0 with 25% ammonia
Elution – vacuum-drived, 800-900 mbar
Procedure:
# Step Applied solution Volume (mL)
1 Conditioning Conditioning solution 5
2 Equilibration Equilibration solution 5
3 Sample aspiration 1 mL of PBS adjusted to pH 10.0 1
4 Elution 1 Eluent 1 5
5 Elution 2 Eluent 2 5
7 Elution 4 Eluent 4 5
8 Elution 5 Eluent 5 4
9 Elution 6 Eluent 6 4
10 Elution 7 Eluent 5 4
Tables
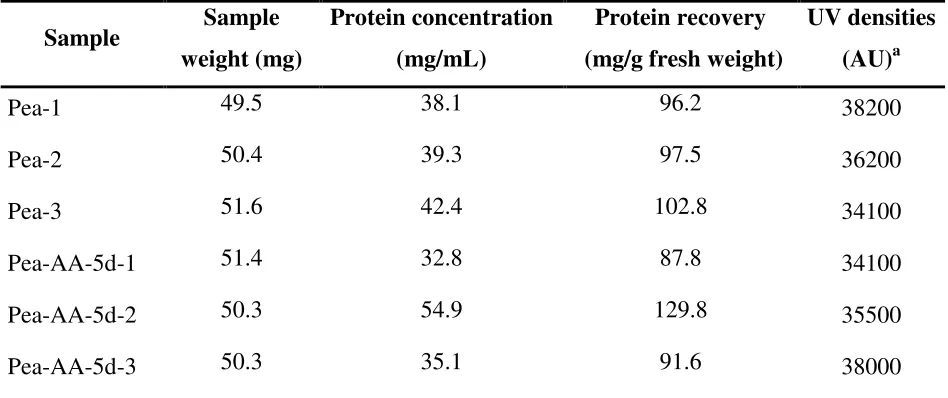
Table S-1 Protein recoveries and total UV densities calculated for individual pea samples separated by SDS-PAGE
Sample Sample weight (mg)
Protein concentration (mg/mL)
Protein recovery (mg/g fresh weight)
UV densities (AU)a
Pea-1 49.5 38.1 96.2 38200
Pea-2 50.4 39.3 97.5 36200
Pea-3 51.6 42.4 102.8 34100
Pea-AA-5d-1 51.4 32.8 87.8 34100
Pea-AA-5d-2 50.3 54.9 129.8 35500
Pea-AA-5d-3 50.3 35.1 91.6 38000
Pea and Pea-AA-5d denote the seeds of yellow-seeded cultivar Millennium before and after
Table S-2 Protein recoveries and total UV densities calculated for individual oilseed rape samples separated by SDS-PAGE
Sample Sample
weight (mg)
Protein concentration (mg/mL)
Protein recovery (mg/g fresh weight)
UV densities (AU)a
Brassica-1 209.4 73,93 103,50 29315
Brassica-2 204.7 77,34 108,28 28814
Brassica-3 213.1 70,42 98,59 28361
Brassica-4 209.7 68,64 96,10 28075
Brassica-5 210.2 85,31 119,44 28361
Brassica-NA-1 211.5 58,64 82,10 28326
Brassica-NA-2 212.9 38,50 53,90 28837
Brassica-NA-3 203.6 58,67 82,14 29695
Brassica-NA-4 207.3 67,46 94,44 30906
Brassica-NA-5 207.2 80,31 112,44 30126
Brassica and Brassica-NA denote the seeds of the oilseed rape cultivar Oredezh-2 (K-4917)
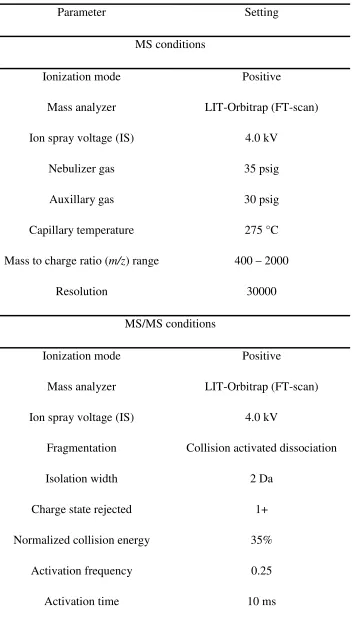
Table S-3 Instrument settings applied for Orbitrap-LIT-MS and MS/MS experiments
Parameter Setting
MS conditions
Ionization mode Positive
Mass analyzer LIT-Orbitrap (FT-scan)
Ion spray voltage (IS) 4.0 kV
Nebulizer gas 35 psig
Auxillary gas 30 psig
Capillary temperature 275 °C
Mass to charge ratio (m/z) range 400 – 2000
Resolution 30000
MS/MS conditions
Ionization mode Positive
Mass analyzer LIT-Orbitrap (FT-scan)
Ion spray voltage (IS) 4.0 kV
Fragmentation Collision activated dissociation
Isolation width 2 Da
Charge state rejected 1+
Normalized collision energy 35%
Activation frequency 0.25
Figures
A
St BH1 AH1 BHS1 AHS-1 St BH2 AH2 BHS2 AHS2
B
C
St BH1 APE1 APES1APKS-1 AKS-1 St
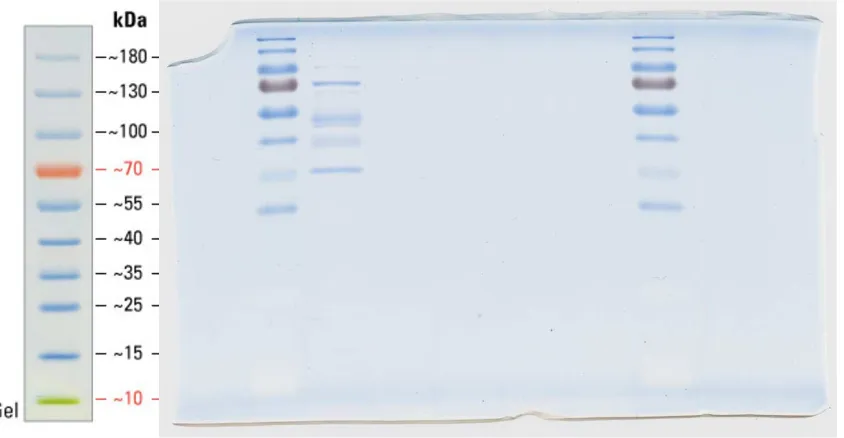
Figure S-2 SDS-PAGE electropherograms of glycated bovine serum albumin (BSA), before and after individual steps of enzymatic hydrolysis. Hydrolysis was performed in triplicates.
The aliquots (5 µg) of all samples were loaded on a gel in 10 µL of sample buffer. BH, before
hydrolysis; APE, after incubation with Pronase E; APK, after incubation with Proteinase K;
AH, after complete hydrolysis; BHS, before hydrolysis in presence of 0.5% (w/v) SDS;
APES, after incubation with Pronase E in presence of 0.5% (w/v) SDS; APK, after incubation
with Proteinase K in presence of 0.5% (w/v) SDS; AH, after complete hydrolysis in presence
A
St BH1 AH1 BHS1 AHS-1 St BH2 AH2 BHS2 AHS2
B
C
St BHS1 APES1 APES1 APKS-1AHS-1
Figure S-3 SDS-PAGE electropherograms of glycated bovine serum albumin, before and after individual steps of enzymatic hydrolysis. Hydrolysis was performed in triplicates. The
aliquots (5 µg) of all samples were loaded on a gel in 10 µL of sample buffer. BH, before
hydrolysis; APE, after incubation with Pronase E; APK, after incubation with Proteinase K;
AH, after complete hydrolysis; BHS, before hydrolysis in presence of 0.5% (w/v) SDS;
APES, after incubation with Pronase E in presence of 0.5% (w/v) SDS; APK, after incubation
with Proteinase K in presence of 0.5% (w/v) SDS; AH, after complete hydrolysis in presence
Figure S-4 ESI-QqTOF mass spectrum, obtained for enzymatic hydrolysate of pea protein. The spectrum was acquired by a syringe infusion (10 µL/min) in a QqTOF-MS (Triple TOF,
Sciex, Darmstadt, Germany), operated in positive ion mode. No signals of multiply charged
Figure S-5 Recovery of three basic amino acids from weak anion exchanger CHROMABOND HR-XAW (A), strong anion exchanger CHROMABOND HR-XA (B) and
Figure S-6 Recovery (%) of Nɛ-(carboxymethyl)lysine (CML, A) and lysine (B) from
enzymatic hydrolysates obtained with 1 mg/mL glycated BSA in presence and absence of
0.5% (w/v) SDS with subsequent SPE on CHROMABOND C18 and C18 ec cartridges.
Relative abundances of analytes were obtained by integration of corresponding LC-MS
extracted ion chromatograms (XICs) at m/z 485.20 and 427.19 for the L-FDVA derivatives of
CML and lysine, respectively, and related to abundances observed without application of SDS