The Packing of Helical and Zigzag Chains and Distribution
of Interstitial Voids in Expanded Liquid Se near the
Semi-conductor to Metal Transition
Kenji Maruyama1,∗, Satoshi Hiroi(Sato)2, Hirohisa Endo3, Hideoki Hoshino4, Takashi Odagaki5, andFriedrichHensel6
1Department of Chemistry, Faculty of Science, Niigata University, Niigata 50-2181, Japan 2Toyota Technological Institute, Nagoya 468-8511, Japan
3Department of Physics, Faculty of Science, Kyoto University, Kyoto 606-8224, Japan 4Faculty of Education, Hirosaki University, Hirosaki 036-8560, Japan
5Research Institute for Science Education, Kyoto 603-8346, Japan
6Physikalische Chemie, Philipps-Universität Marburg, 35032 Marburg, Germany
Abstract.The reverse Monte Carlo (RMC) and Voronoi-Delaunay (VD) void
analyses were applied to study the modification of chain geometries near the semiconductor (SC) to metal (M) transition in expanded liquid Se along the isochore ofd=3.4 g/cm3.
Fluctuations of dihedral angles with increasing temperature and pressure cause modification of the helical (H) chain to the planar zigzag (Z) chain conforma-tions. The distribution of voids size (rV) supported by chain segments and
dis-tances to the 4th∼6th neighbor atoms on the chain segments provide infor-mation on the stacking of planar zigzag chains compensated by empty space (L-voids,rV ∼3.6 Å) which leads to the formation of metallic domains. Near
SC-M transition region the number fractionNZ/NHfor Z and H chain segments
increases.
1 Introduction
Expanded liquid (l-) Se transforms from semiconducting to metallic state near the critical point accompanying the volume contraction. The reverse Monte Carlo (RMC) simulation[1] and Voronoi-Delaunay (VD) void analyses[2,3] on the basis of structural data at various tem-peratures and pressures are useful tools to clarify the relationship between the packing of chains and voids in the intermediate scale near the SC-M transition.
2 Results and Discussion
X-ray scattering measurements have been performed with the white X-ray beamline BL28B2 at SPring-8. The monocrystalline saphire cell which has been developed by Tamura and Inui [4] at Hiroshima University was used to maintain the liquid Se as thin film. The apparatus containing the sample cell and electrinc furnace is described in Ref. [5]. The scattering in-tensity was obtained with the energy dispersion method. After the corrections for absorption,
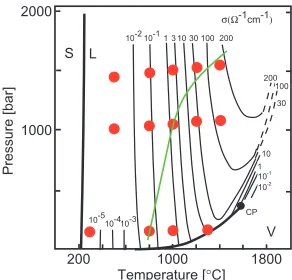
incoherent scattering, background from He gas and sample cell, and thereafter the normaliza-tion with the incident X-ray spectrum, the structure factorsS(Q) were obtained. The X-ray scattering measurements of expanded l-Se were performed alongT andPindicated by red circles (see Fig. 1). The solid lines show the contours of constant DC conductivity (σ) in expanded l-Se. The green line denotes the isochore ofd=3.4 g/cm3. The analyses along the isochore give a distinctive response to a change of chain geometry in expanded l-Se near the SC-M transition.
200 1000 1800 1000 2000 Temperature [°C] Pressure [bar] σ(Ω-1cm-1) S L V CP 10-2 10-1 1 10 100 200
10-3 10-4 10-5 200 100 30 10 1 10-1 10-2 3 30
Figure 1. Pressure-temperature phase diagram[6,7] of selenium showing contours of constant DC electrical conductivity in the liquid and supercritical fluid. Green line shows the isochore ofd=3.4 g/cm3.
Figure 2.The temperature variations of the structure factor S(Q) for l-Se under 140-150 bar (a), 1000-1080 bar (b), and 1450-1559 bar (c).
Fig. 2 shows temperature variations of the structure factorS(Q) for l-Se under 140∼150 bar (a), 1000∼1080 bar (b) and 1450∼1559 bar (c).
near the SC-M transition, which may be associated with a change of chain geometry (helical
→zigzag) as discussed later.
6
!
!
!!"
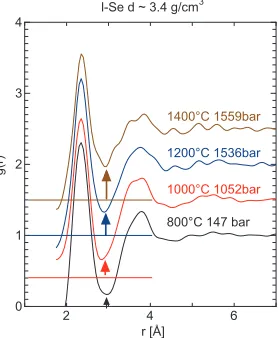
Figure 3.The pair distribution functionsg(r) of l-Se along the isochore ofd∼3.4 g/cm3. The arrows
indicate the depth of the dip ofg(r) aroundr∼3 Å.
The RMC simulation and VD void analyses have been applied to clarify the relationship between the packing of chains and interstitial voids in the intermediate scale. The void radius rvis given by that of the sphere circumscribing the DV tetrahedron. Fig. 4 (a) shows the size
distribution of voidsP(rV) in l-Se alongd ∼3.4 g/cm3.P(rV) exhibits peaks or shoulders at
rV ∼2.8 Å andrV ∼2.3 Å and additional peak aroundrV ∼3.6 Å as illustrated in Fig. 4(b).
The peak atrV ∼2.8 Å gives a measure of the interstices between neighboring chains which
is defined by the tetrahedron formed between three neighboring Se atoms along a chain and an atom belonging to the neighboring chains as illustrated in Fig. 5(a). As illustrated in Fig. 5(b) the peak atrV ∼2.3 Å is assigned to the radius estimated for the stacked zigzag chains
driven by inter-chain coupling, which leads to the formation of metallic domain (M-domain)
#$ %$
&$
'
Figure 4.(a) The size distribution of void,P(rV) in the l-Se along the isochore ofd∼3.4 g/cm3. as a
function of the void radius,rV, of VD circusmsphere. (b) Gaussian curve fitting is shown in 1400◦C
Figure 5.Schematic helical (a) and zigzag (b) chain configurations of expanded l-Se around the void.
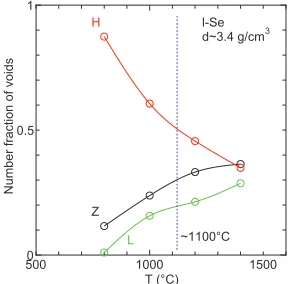
The geometrical requirement for stacked planar zigzag chain is compensated by empty space (L-voids,rV ∼3.6 Å). The temperature variations of number fraction of voidsNwith
rV ∼ 2.8,2.3 and 3.6 Å along d ∼ 3.4 g/cm3 is shown in Fig. 6. The proportions for
zigzag chains increase near the SC-M transition region (∼1100◦C). The shortening of chains, fluctuation of dihedral angles and branched chains with increasing temperature and pressure causes modification of helical chain to planar zigzag chain configurations. The distributions of helical (H) and zigzag (Z) chains are characterized by the distance tonth neighbor atom (n: 4∼6) along a chain. It is interesting to note that the distribution of distance assigned to H and Z give distinct peak as shown in Fig. 7, which suggests that chain geometry in expanded l-Se near the SC-M transition contains a stable planar zigzag conformation[8,9].
!"#$%
!
Figure 6.The tenperature variations of the number fraction of voids in expanded l-Se atd∼3.4 g/cm3
derived from the Gaussian fitting of the size distribution of voids, as shown in Fig.4(b).
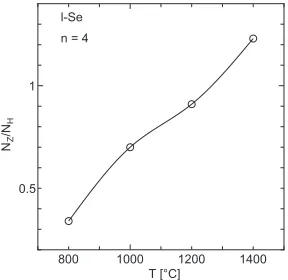
Fig. 8 shows the temperature variations of number fractions,NZ/NH, for zigzag to helical
Figure 7. Distribution of atomic distancesP(r) along a chain: black curve indicate P(r) for 800◦C (147bar), red for 1000◦C (1052bar), green for 1200◦C (1536bar) and blue for 1400◦C (1559bar). (a)distribution ofn = 4, (b)n =5, (c)n =6. Red arrows indicate the position assigned to helical chain and black arrow position assigned to zigzag chain.
Figure 8.The temperature variatons of number fractionNZ/NHfor Z and H chain configuratins
char-acterized by distance to 4th neighbor atom along a chain as shown in Fig. 7(a).
3 Conclusion
X-ray scattering measurements were performed on the expanded liquid Se near the SC-M transition along the isochore ofd =3.4 g/cm3. RMC and VD void analyses were applied to clarify the modification of chain geometries in intermediate scale in expanded liquid Se near the SC-M transition region.
The helical chains are modified to the stacked planar zigzag chain which leads to the formation of metallic domains. The distributions of H and Z chains are characterized by the distribution of void sizes supported by chain segments and the distances to neighbor atoms along a chain. It is found that near the SC-M transition region number fraction ofNZ/NHfor
References
[1] R. L. McGreevy, J. Phys.: Condens. Matter13, R877 (2001) [2] S. L. Chan and S. R. Elliot, Phys. Rev. B43, 4423 (1991) [3] P.A. Madden and M. Wilson, Phys. Rev. Lett.80, 532 (1998) [4] K. Tamura and M. Inui, J. Phys.: Condens. Matter13, R337 (2001) [5] K. Tamura and S. Hosokawa, Ber. Bunsenges. Phys. Chem.96, 681 (1992)
[6] H. Hoshino, R. W. Schmutzler and F. Hensel, Ber. Bunsenges. Phys. Chem.80, 27 (1976) [7] F. Hensel and W. W. Warren, Jr.,Fluid Metals(Princeton Univ. Press, Princeton, 1999)
chap. 5
[8] A. Ikawa and H. Fukutome, J. Phys. Soc. Jpn.59, 1002 (1990)
[9] K. Maruyama, H. Endo, H. Hoshino, Y. Kajihara, M. Nakada and S. Sato, J. Phys.: Condens. Matter22, 455103 (2010)