Explorations in Generative Street Layouts
1Stephen Marshall and Mark Sutton
The chapter explores the possibilities for generating urban layout structure based on street networks. This provides a demonstration of a network simulation tool – ‘NetStoat’ – which ‘grows’ layout structure according to a set of street-based rules. By controlling different street types and their relationships, we can generate urban layout in a structured way, but without a fixed plan. The chapter explores what urban layouts could arise, given different input parameters, testing a range of urban street network types, such as ‘traditional’, ‘hierarchical’ and ‘neo-traditional’, based on different combinations of rules of connection and frontage constraint. Sample results demonstrated include metrics of network length and the emergence of ‘high street spines’. The exploration provides insights into the structure and dynamics of layouts arising, pointing towards future application of street-based rules for generating urban layout.
INTRODUCTION
Urban design and planning aspire to fixing desired urban forms in advance, while maintaining flexibility in the face of change over time. Historically, fixity and flexibility have often been seen as stereotypical opposites, with the organic incrementalism of Patrick Geddes or Jane Jacobs pitched against the top-down master-planning of Lutyens or Le Corbusier. More recently, the idea of generative codes has emerged to offer the enticing prospect of combining both: of generating an urban form whose
desired order is built into the rules, rather than an overall fixed plan (Alexander et al.
2008; Mehaffy 2008; Marshall 2009; Marshall 2011).
Here, the term generative is taken to mean a situation in which the rules in
some way are targeted or ‘tuned’ to generate desired overall properties in the overall
final outcome.2 The question becomes how to link the rules (program) to the final
layout (pattern); how to know what the rules should be, in order to generate the desired end-product, in a context where the rules are applied incrementally by many hands. One way to address this is to use trial and error, on the ground. Another way, pursued here, is to use simulation, which while based on simplifying reality, allows attention to focus on key parameters which can be modified and tested at will, with urban layouts of any size generated, and run as many times as desired, to produce any number of quantitative results.
This chapter provides a demonstration of a network simulation tool – ‘NetStoat’ – for generating urban layout structure based on street networks. The simulation ‘grows’ layout structure according to a set of street-based rules. By controlling different street types and their relationships, we can generate urban
1
This chapter excerpt is from Carmona, M (ed.) Explorations in Urban Design: An
Urban Design Research Primer, Ashgate Publishing, Ltd.
2The term ‘generative’ may be distinguished from (i) ‘incrementalist’, where the
layout in a structured way, but without a fixed plan. The aim was to explore the possibilities for what urban layouts could arise, given different input parameters, based on the structure of the street layout.
Street-based rules are significant for generating urban layout since streets form the backbone of urban layout structure, and they are traditionally regulated by explicit codes or rule-sets. While codes based on ‘road hierarchy’ have been implicated with the kind of suburban loop and cul-de-sac layouts that are often criticised by urban designers, codes could also be applied to generate street-grids of the kind favoured by urban designers. If we vary the ‘genetic code’, can we generate different kinds of grid?
The chapter reports on work carried out at the Bartlett School of Planning, as part of the SOLUTIONS project, http://www.suburbansolutions.ac.uk/. This project addressed peripheral expansion of settlements, and included the prospect of a relaxed planning regime with no fixed target plans. While the simulations allow detailed quantitative analysis, the focus of this chapter is the exploratory aspect in a more qualitative sense: what are the different types of growth; to obtain a feel for the dynamics of working with ‘programs’ rather than fixed ‘patterns’; and hence the potential for ‘generative urbanism’ based on street-based rules. The chapter first briefly contextualises the simulation of street networks, before setting out key attributes of the NetStoat tool; and then goes on to discuss the simulation test results, insights and conclusions.
SIMULATING GROWTH OF STREET NETWORK STRUCTURE
The desire to visualise and/or quantify the effects of incremental urban growth is of ongoing interest to urban designers and others who wish to better understand urban dynamic processes, whether for relating past urban growth to future consequences, or predicting the outcome of cumulative incremental interventions in the absence of overall master planning.
Of specific concern here is the desire to anticipate the effects of the street layout rules that we put in our design manuals, since changing individual rules can profoundly affect the overall form and functioning of urban areas. For example, in the UK, the post-war switch to frontage-free main roads, discouragement of minor
access roads from directly accessing main roads, and discouragement of crossroads (4-way priority junctions) led to the creation of suburban layouts criticised for the loss of mixed use high streets, disjointed (impermeable) layouts, a proliferation of culs-de-sac, collectively associated with car-orientation and ‘disurban creation’ (Marshall, 2005).
If we are to keep the flexibility of street-based codes, while better tailoring these to today’s urban design needs, then it becomes important to test the consequences of different codes on overall layout outcomes.
There are many preceding traditions both of urban simulation, which seek to
experiment with layout growth in silico, or in the ‘digital laboratory’ (Koenig and
‘NETSTOAT’ SIMULATION TOOL
The research involved the creation of dedicated software in the form of a Network Simulation Tool, NetStoat, which generates urban street networks, displays the
growth of networks, and calculates a series of statistics relating to these networks.3
‘NetStoat’ simulation tool
The instrumental features of NetStoat are the creation of the road network in a random-incremental manner, whereby each iteration of the program adds an additional road (or set of roads) to the network incrementally, according to certain rules, but with random elements. The random elements include the location where the next road is generated, and other factors such as kind of branching, probability of frontage development, and so on. The random nature of the generation is intended to simulate the way that specific increments of development, while resulting from rational acts of will – ‘planned’ by individual actors – nevertheless appear ‘random’ from the point of view of the system, and not in control of any overall master planner.
The NetStoat environment starts with a square of 1000 x 1000 unit sides. This could correspond with, for example, a 10km by 10km grid. The boundary roads are at the top level (level 1; or ‘A’ roads). All subsequent roads or streets are laid out in an orthogonal manner, such that all roads or streets are straight, or turn at 90 degrees; and all junctions are right-angled. This is clearly a simplification, but
considered as a reasonable simplification in the present context, that is, the creation of network structure on the periphery of urban areas, where a superstructure of main roads already exists and where subdivision of land and orthogonal road junctions is common.
All roads are allocated a level in the hierarchy; roads may connect to each other by different rules according to level; and urban development may be ‘attached’ to roads at different levels. Two distinctive features of NetStoat are: (i) the distinction of different street types by level; that are (ii) organised in a hierarchy according to the property of arteriality, by which all top level roads (and the set of all roads down to any given level in the hierarchy) connect up in a single contiguous network (Marshall 2005).
Programs – input variables
For any given simulation run, input variables include: (i) number of levels in the hierarchy; (ii) ‘separation’ (spacing of roads); (iii) structure (tree, grid or ‘span’); (iv) proportion of roads at each level; (v) degree of branching; (vi) maximum size of block subdivided as grid; (vii) development present or not; (viii) access constraint or not.
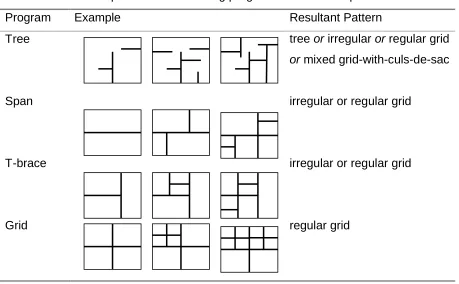
Here, the ‘structure’ variable relates to the formation of routes by tree, span or grid structure, and is illustrated in Table 1. Table 1 draws attention to a fundamental distinction between pattern-forming programs and the patterns themselves. As Table 1 also shows, repeated applications of tree or span algorithms can (ultimately) create grids.
3
Table 1: Relationship between structuring program and resultant pattern
Program Example Resultant Pattern
Tree tree or irregular or regular grid
or mixed grid-with-culs-de-sac
Span irregular or regular grid
T-brace irregular or regular grid
Grid regular grid
The span structure is typically in effect the default for a strategic connected network: a road link ‘spans’ from one point to another. Hence in the NetStoat
simulations, the default is the span structure applied from the top level down, which can be switched to ‘tree’ program or grid-formation program at the lower levels in the hierarchy. In particular, it is possible to simulate an incremental addition of a tree pattern or the subdivision of an existing rectangle into a grid of small squares.
Various other elaborations are included in the program. These include constraints to stop trees straggling across main roads; the ‘upgrading’ of low-hierarchy to higher low-hierarchy roads; and allowing development to take place along roads of specified level in the hierarchy. Manipulation of the set of input parameters allowed a range of different programs to be created, to simulate a variety of kinds of layout (see later).
Patterns – output graphics and statistics
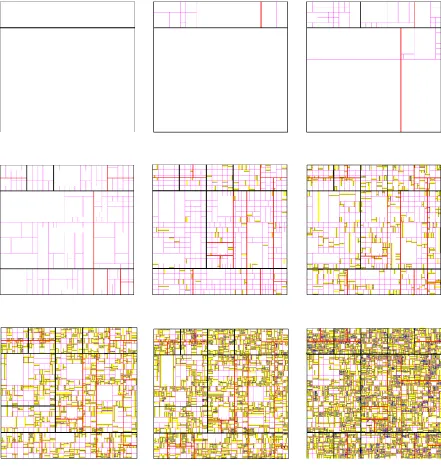
Figure 1: NetStoat simulation of the generation of a street network. This shows the network at nine stages of growth, after 1, 10, 50, 200, 600, 1000, 2000, 4000 and 8000 iterations
TESTING ALTERNATIVE NETWORK TYPES
NetStoat was used to test alternative network types, by configuring the different available parameters to implement different rule programs and then simulating their growth, then calculating the properties of the output patterns. The testing involved an iterative component, where the input variables could be ‘tuned’ to target desired kinds of pattern used for demonstration purposes. This process shows that it is
processes – whether more or less hierarchical, more grid-like or tree-like patterns. In addition, it is also possible to automatically vary parameters to study how the
properties of the resultant patterns differ incrementally as these parameters change.
Key test parameters
From the general list of possible input variables (itemised earlier), three key
parameters were selected for particular attention when creating discrete alternative types for testing:
(1) Access constraint: on or off; by level. Access constraint ‘on’ means roads may only join roads of equal or adjacent level: for example, level 1 roads may only connect to level 2 roads; not level 3 or 4 and so on;
(2) Frontage development constraint: on or off, probabilistically, by level. Frontage constraint ‘on’ represents the kind of control found in many modern road layouts, whereby only those roads lowest in the hierarchy – access roads or streets – are allowed to have frontage development;
(3) Micro structure network structure: span, tree or grid (Table 1), probabilistically, by level. While the default strategic structure is ‘span’, this control either allows the span structure to continue down the whole hierarchy, or for micro scale grids or trees to ‘kick in’ at a given level. The probabilistic parameters distribute how the probability is distributed between the available options so that any relative fractions are available.
Nine network types tested
Nine layout types were devised in order to test a variety of types of network that might be of interest to contemporary debates about alternative urban layouts. These nine types are shown according to their key input variables in Table 2, and explained in more detail below.
Table 2: The nine network types tested
Network type Access Constraint Frontage Constraint Micro structure*
Hierarchical Yes Yes Tree
NeoTrad Yes Yes Grid
RuralGrid Yes Yes Span/grid
Patchwork No Yes Tree/grid
Micro Tree No Yes Tree
Linear No No Tree
All Grid No No Grid
All Span No No Span
Traditional No No Span/tree/grid
* Where intensively developed, trees and spans may emerge as grids, as per Table 1.
The first three layout types are ‘pure’ structures included to give the clearest
All-grid and Micro-tree. Next we have three types that typically feature in contemporary
debates about street layout structure. The Hierarchical type is intended to represent
conventional modern road layouts; the NeoTrad type represents the recent
neo-traditional aspiration to have more grid-like layouts, but where there main roads are
still kept as frontage-free and with access constraint; whereas the Traditional case
has neither access constraint nor frontage constraint, while having a mix of grid, tree, and span structuring at the micro level.
Finally we have three types devised specifically for illustrating possibilities for
expansion of development into peri-urban areas. The Lineartype is intended to
represent one kind of model whereby development is focused along a main street that acts as a public transport spine. This has neither frontage constraint nor access constraint, such that main roads are in practice frontage streets with many side streets directly off them. The micro-tree structure is invoked, but with a depth limitation (i.e. the number of steps of branching off the main road) that leads to a
corridor effect, with local ‘griddiness’. The RuralGridtype represents a matrix of
local streetgrids extending through the countryside, but kept clear of the main roads.
The Patchworktype represents a case where development is in the form of
scattered pockets of land locally laid out as trees or grids; again there is no frontage development along main roads. The nine types are illustrated by means of example patterns in Figure 2 (a) to (i). Samples visualised in ‘figure ground’ format are shown in Figure 3.
Outputs
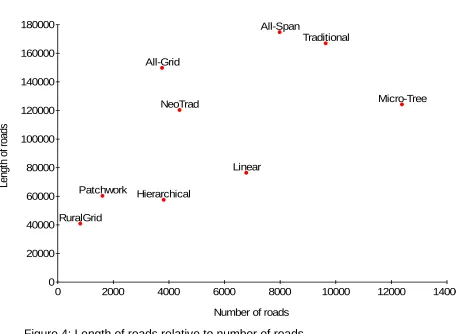
Figures 4 to 6 show some sample charts illustrating properties of those patterns generated by NetStoat illustrated in Figure 2. The patterns illustrated are in this case merely single specimens, intended to represent the general kind of structure that can be created by the given program.
Figure 4 shows the general and obvious relationship whereby the more roads added to the network, the greater the network length. But across this general
relationship, variations can be seen: the more ‘griddy’ layouts tend to the upper left, indicating greater length per road; while those networks with more trees to the lower right. This reflects the fact that the micro-grid structure fills a whole block of a given size with a grid of roads (horizontally and vertically), whereas a micro-tree may only generate a few straggling branching routes that only ever partly fill a block.
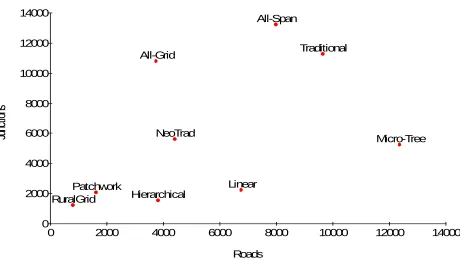
Figure 5 shows a diffuse generally positive relationship between number of junctions and number of roads. This shows that the ‘griddier’ layouts (to the upper left) have more junctions per road than the more tree-like layouts (to the lower right).
(a) All-span (b) All-grid (c) Micro-tree
(d) Traditional (e) Hierarchical (f) NeoTrad
(g) Linear (h) RuralGrid (i) Patchwork
(a) Traditional (b) Micro-tree (c) Linear
Figure 3: Details of networks in figure ground format, illustrating street frontage
Figure 4: Length of roads relative to number of roads
0 20000 40000 60000 80000 100000 120000 140000 160000 180000
NeoTrad
RuralGrid
Hierarchical
Linear
All-Span
Micro-Tree All-Grid
Traditional
Patchwork
0 2000 4000 6000 8000 10000 12000 14000
Le
ng
th
o
f r
oa
ds
Figure 5: Number of junctions, relative to number of roads
Figure 6: ‘Nodegram’: proportion of X-junctions, T-junctions and culs-de-sac, for a range of networks. The blue dots are the nine test networks simulated by NetStoat (Figure 2); these are compared with a range of actual street networks (red dots) and a mix of demonstrative and prototype networks (orange dots) (after Marshall, 2005)
Neotrad Ruralgrid
Hierarchical Linear
All-span
Tree All-grid
Traditional Patchwork
0.0 0.1 0.2 0.3 0.4 0.5 0.6 0.7 0.8 0.9 1.0
Series 1 Series 2 Series 3 Series 4 Series 5
100% T junctions
100% culs-de-sac
100% X junctions 0
2000 4000 6000 8000 10000 12000 14000
NeoTrad
RuralGrid Hierarchical
Linear
All-Span
Micro-Tree
All-Grid Traditional
Patchwork
0 2000 4000 6000 8000 10000 12000 14000
Ju
nc
tio
ns
INSIGHTS INTO DYNAMICS OF GROWTH
We have seen the simulation of network growth, and the calculation of the properties of patterns arising from different programs (rule-sets). This shows that the simulation tool can model network types that are relevant to urban design debates. But we now turn to address more specifically the generative aspect and the dynamics of how programs generate those patterns.
Emergent patterns and predictability
When undertaking multiple runs of a given program, clearly there will be some degree of variation in output statistics for different patterns arising. Yet, despite each pattern being different, it is still possible, or even likely, that typical values will arise,
for any given output variable. For example Figure 7shows the distribution of the
variable ‘road network length’ for a given program, for 50 runs. The chart shows a cluster of values in a relatively narrow band: 96% of all cases fall within the range 325+/–25. This suggests – for this given program at least – that despite the random nature of the growth of the network, it is likely to generate a typical outcome in terms of this parameter. A similar effect can be seen for other programs and other
parameters.
For some programs and some parameters, the outcome of the simulation may be reasonably predictable, even in a random-incremental scenario: that is, in the absence of overall planning. In this scenario we cannot necessarily predict where any individual road will go, or whether a particular land use ‘cell’ will be built up or not, but we will have a reasonable expectation of how many cells will be built up, approximately how close they will be to each other, how connective the network will be, how compact the overall built up area will be, and so on. In other words, this gives encouragement that, even in the absence of master-planning (fixing target layouts in full detail in advance) it is reasonably likely that a given kind of stable form would arise.
Emergent high streets
Figure 8 shows the final (bottom right) network from Figure 1 with an increased scale, and highlighting the apparent clustering of streets in ‘local high street spines’ – that is to say, areas where there is a cluster of more closely spaced side streets along a main street. In this case, of course, there was no deliberate programming to simulate ‘local high street spines’. This suggests that local high street spines are
emergent – one might say naturally arising – even without deliberate intention.4
If it turns out that ‘local high street spines’ are considered a desirable feature of urban structure, then it can be seen that this need not be created as a deliberately
designed feature but could be created generatively, using street layout rules based on a random-incremental ‘spanning’ program, with the appropriate boundary
conditions rather than via conventional master-planning.
Complexity and unpredictability
The simulations have shown that it is possible to generate a variety of urban layouts using only programs (rule-sets specifying elements and relationships), with no explicit target patterns, and yet create a variety of recognisable patterns – possibly desired patterns. However, this should not mask the fact that these simulations were developed specifically to demonstrate the possibility of such patterns arising from rule-sets, and indeed ‘tweaking’ or ‘tuning’ the rule-sets precisely to achieve such patterns (e.g. something resembling a traditional semi-regular urban grid). What has not been discussed here is the extent of the unpredictability of outcomes, in the absence of such tuning.
In some cases, unexpectedly regular street patterns emerged. However, for each set of parameters which generates nicely ordered urban patterns such as the ones reported here, there were more – many more – sets with starting conditions from the available parameter space, that that did not work out this way, instead resulting in outcomes that looked dysfunctional or unlike real street patterns.
4
This effect seems to arise partly due to the way that streets are laid down in an order that means the earlier streets are more likely to gain more side streets from them than later ones, with some positive feedback. Moreover, the apparent
clustering may be no more than a random distribution, that simply appears clustered
Figure 8: Identification of apparent emergent clustering of ‘high street spines’
Indeed, the experience of using NetStoat has shown the complexity of the interaction of the variables in generative layouts. It is not simply about taking one parameter, such as density or ground coverage, and watching the outcomes as we vary such parameters up or down. With the complexity of interactions of many
variables, we cannot know in advance what the outcomes will be, unless we can test them and find reasonably predictable, stable relationships between certain kinds of program and certain kinds of pattern: for example a program that would reliably generate a concentric form, or a tree, or a grid.
These factors reinforce the need for testing of codes (programs) if these are to be used generatively, before adoption in design manuals; in addition a balance will need to be struck between which rules are included in the manuals and which are left to the designer’s intuition.
CONCLUSIONS
This chapter has demonstrated the exploration of urban layout structuring through application of a network simulation tool – NetStoat – to model the growth of street network structure, and hence demonstrate the potential of generative street-based layout. This exploration provides a link between previous scrutiny of street layout conventions and ‘static’ network structure (Marshall, 2005) and the dynamic processes of urban formation and emergence (Marshall 2009) via specific
From a research perspective, NetStoat is distinctive in featuring explicitly hierarchy and arteriality. This has allowed the generation of (some) plausible road network structures, demonstrating the ability to generate and test target alternatives, and experiment with the development of new structures. This also gives insights into the dynamic nature of structuring – and the relationship between program and
pattern – as well as the evaluation of properties of the generated patterns. We have seen how it is possible to create and distinguish traditionally recognisable network types, using key parameters relating to local street-based rules. In this case, the essence of ‘network type’ is encoded in the program (rule-set) rather than the pattern. In this regard, the research has identified the ‘span’ as a structuring component distinct from the creation of a tree or a grid. Three key
operational parameters (access constraint; frontage development; and tree, span or grid structure) were able to generate significantly different structures, useful as recognisable alternative ‘test types.’
There are some preliminary lessons gained from insights arising during the simulation process. The exercise suggests that there is not a binary opposition or polarisation between top-down and bottom-up processes. Rather, we can have a mix of designed features at any level (from fixed grids or trees down to the level of
designing individual streets) and also ‘laissez-faire’ at any level (where either the macro or micro structure could be left to its own devices, and generate, for example, emergent ‘high street spines’).
Indeed, a basic rule of thumb emerges here: “If you know what outcome (pattern, structure, property) you want, you may as well design it; if you don’t know what the optimal specific outcome is, but only what the elements and relationships should be, then you may as well build those elements and relationships into a program or code, without having an overall target design”. Put more concisely: “fix (only) what you definitely know you need, at any particular scale; let the rest ‘work
itself out”. This may possibly look obvious in hindsight, but it is not always obvious a
priori when faced with the choice of apparently polarised alternatives of top-down and bottom-up.
As it stands, the research reported herein can contribute towards developing and testing future rules for network structure for improving future urban simulation models and future street design manuals. Further testing is necessary on the quantitative and statistical side, to test the ranges of probabilities, for a given program generating desired patterns; to determine what level is the most effective level for top-down and bottom-up; and what would be the fewest or best rules to
generate the desired combination of flexibility and fixity of form.
REFERENCES
Alexander C, Schmidt R, Hanson B, Alexander M M & Mehaffy M (2008) Generative codes. The path to building welcoming, beautiful, sustainable neighborhoods, in
Haas, T. (ed.) New Urbanism and Beyond. Designing Cities for the Future, New
York Rizzoli
Batty M (2009) A digital breeder for designing cities, Architectural Design 79(3): 46–
49
Erickson B and Lloyd-Jones T (1997) Experiments with settlement aggregation
Koenig R and Bauriedel C (2009) Generating settlement structures: a method for
urban planning and analysis supported by cellular automata, Environment and
Planning B: Planning and Design 36(4): 602–624
Marshall S (2005) Streets and Patterns, London and New York Spon Press
Marshall S (2009) Cities, Design and Evolution, Abingdon and New York Routledge
Marshall S, ed. (2011) Urban Coding and Planning, Abingdon: Routledge.
Mehaffy M (2008) Generative methods in urban design: a progress assessment,
Journal of Urbanism 1(1): 57–75.
Semboloni F (2000) The growth of an urban cluster into a dynamic self-modifying
spatial pattern, Environment and Planning B: Planning and Design 27(4): 549–
564
Xie F and Levinson D (2009) Modeling the growth of transportation networks: a
comprehensive review, Networks and Spatial Economics 9(3): 291–307
TIPS FOR RESEARCHERS
Be prepared to undertake new kinds of research – such as new software
development – in order to tackle the problem at hand – in this case, exploring generative and emergent effects;
Be aware of the advantages of simulation, and the ability to systematically
undertake large numbers of runs generating arrays of quantitative results, albeit at the expense of some simplification of what is being modelled and visualised;
Be focused on the critical features or instrumental parameters to represent
and test, that existing methods are not addressing;
Be alert to unanticipated outcomes – not just what you are looking for, but
other things arising.
AUTHOR BIOGRAPHIES
Stephen Marshall is Reader in Urban Morphology and Planning at the Bartlett School of Planning, University College London. His principal research interests are in urban morphology and street layout, and their relationships with urban design, coding and planning, and other urban formative processes. Dr Marshall has written or edited
several books relating to urban design, including Streets and Patterns (2005), Cities,
Design and Evolution (2009) and Urban Coding and Planning (2011). He was Chair of Urban Design and Planning journal from its inception (2007–2012) and is now joint
Editor of Built Environment journal.