77
High-Dimension Component Analysis Using Classification
Algorithm for Gene Prediction
R.Viswanathan, Dr.K.Kalaivani, T.Edison, Vaishnavi J
1,3, 4 School of computer science in Vels University Chennai 2Professor at School of computer science in Vels University Chennai
[email protected] [email protected], [email protected], [email protected]
Abstract: Very high dimensionality is involved in the data mining applications like risk management, forensics, bioinformatics etc. When there are large number of dimensions or features in a dataset, the “Curse of Dimensionality” occurs, which further leads to reduction in the accuracy of classification algorithms. This is due to the presence of the unwanted or insignificant features in the high dimensional dataset. Feature selection and feature extraction methods are used to reduce the features or dimensions making them more significant, representing whole dataset. Our objective is to study effectiveness of variance filter method, principal components of PCA and non-negative matrix factorization (NMF) in classification of gene data. In the present work VFM, PCA and NMF are used for dimensionality reduction and the data thus obtained is used for classification. For classification neural network is trained with back propagation algorithm.
Keywords: High Dimensional Data, Neural network, PCA, NMF, Backpropagation.
1. INTRODUCTION
Classification is a procedure, in which a supervised learning algorithm is applied to training data in order to build the model to categorize unseen samples efficiently. Due to the recent advancement in sensor technology, data capturing devices today we not only have exponential growth in the size of data but also in dimensionality of the data. The conventional classification algorithms fail to handle such a large dimensional due to the problem of “Curse of Dimensionality”. Hence a large number of feature selection and feature extraction methods were proposed in the literature. Among them PCA(Principal Component Analysis) is a widely used feature extraction method.
2. DESCRIPTION OF DATA
The Genomes of all the life forms or organisms had been completely sequenced, plus the genomes of human. Interest from bioinformatics is now somewhat shifting from sequencing, to learning genes which are encoded in sequence.
Gene’s codes for the proteins incline to confine in various parts of the membranes. Each and every gene in the tissue tend to adapt a particular cell membrane as per the various features. They cooperate with each other keeping in mind the end
goal to play out some vital capacities. The Gene expression data has been downloaded from the below mentioned bio stat website.
The present dataset which we have used contain details about different genes of a particular life form. Gene names are unspecified and some set of genes are used for testing. The task is classifying the localization of genes based on the features available.
A particular gene has localization not more than one. The data sets here used for the supervised classification are having a Gene Expression data, which contains information about Class, Complexity, Phenotype, Motif, Interacting Gene, Functions and Localization(labels) i.e. which particularmembrane is adapting that particular Gene. This
dataset is separated in two sections. Then the existing dataset consists of 2960 features & 811 records where we choose 80% of the dataset for training the model and the rest 20% is used for testing the model.
3. METHODOLOGY NEURAL NETWORK
The perceptron can be prepared by changing the weights of the contributions with Supervised Learning. In this learning method, the examples to be perceived are known ahead of time, and a preparation set of information esteems are as of now arranged with the coveted yield. Before beginning, the weights are instated with irregular esteems. Each preparation set is then exhibited for the perceptron thus. For each information set the yield from the perceptron is contrasted with the coveted yield. In the event that the yield is right, no weights are adjusted. In any case, if the yield isn't right, we need to recognize which of the examples we might want the outcome to be, and modify the weights on the as of now dynamic contributions towards the coveted outcome. (Recipe 2 SLP Adapt Weights)
Perceptron Convergence Theorem
The perceptron calculation finds a direct discriminant work in limited cycles if the training set is straightly detachable. [Rosenblatt 1962] The learning calculation for the perceptron can be enhanced in a few approaches to enhance effectiveness, yet the calculation needs value as long as it is just conceivable to arrange direct distinct examples. The multilayer perceptron (MLP) or Multilayer feed forward arrange. Expanding on the calculation of the straightforward Perceptron, the MLP demonstrate not just gives a perceptron structure for speaking to in excess of two classes, it additionally characterizes a learning standard for this kind of network.
78
The Principal Component Analysis (PCA) is the [image:2.595.72.516.208.470.2]scientific calculation that decreases the dimensionality of information while holding the greater part of the variety in dataset. It achieves the decrease by recognizing directions, called major workings, along which the variance in the information or data is highest. By utilizing couple of parts, each of the sample can be represented by moderately few numbers rather than the by qualities for a great many factors.
Figure 1: Perceptron Structure.
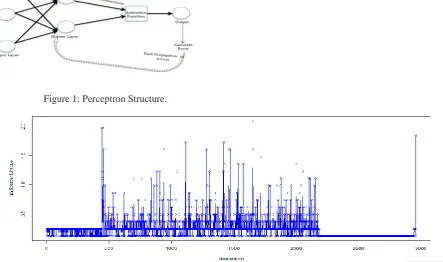
NMF, as it results in matrices which are easier to analyze. This is an algorithm where a provided matrix is factorized in two parts based upon the rank, i.e the basis matrix and weight matrix. Variance filter method is a feature selection method, which is based on near zero variance. Here features are ranked in terms of percent Unique, freqRatio, zeroVar, NZV (Near Zero Variance). Further finding out the insignificant data i.e., missing data, noisy data of features or dimensions with zero variance and will choose those insignificant features for dimensionality reduction.Plotting of the samples is for dimensionality reduction.
[image:2.595.86.507.531.709.2]Figure 2: Variance plot of all the dimension in the raw data
Figure 3: Variance plot of the dimensions after reduction
Now, after completion of pre-processing on the reduced dataset, we will separate the dataset as
79
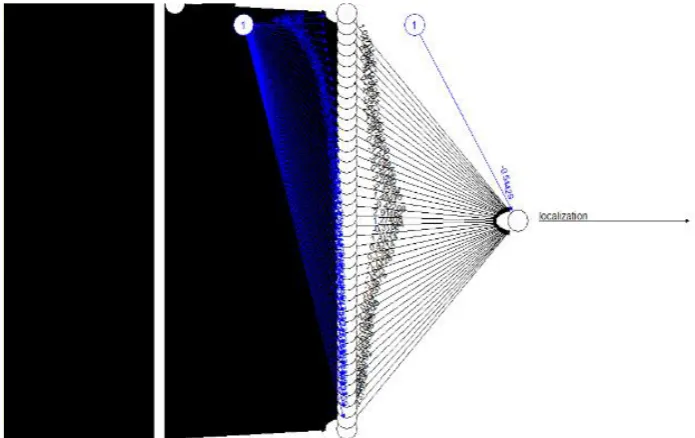
likenesses and contrasts between the examples andfigure out if the samples can be categorized.The work done using Neural Network leads to the formation of following graph. Here, outputs are considered i.e., the features from variance filter method, as the inputs to the Neural Network model. Then the given function generates weights initially at the input layer based on the number of hidden layers in the preceding
[image:3.595.137.485.201.420.2]perceptron. These weights are passed among all the hidden layers in the first perceptron from the input layers where these weights are multiplied with bias value of the each hidden layer or neurons. The output of this layer is used as the input of the next layer, which is the hidden layer for this step.
[image:3.595.90.513.473.702.2]Figure 4: Plot of neural network with 1607 features
Figure 5: Plot of neural network with 12 features
The accuracy of PCA is compared with NMF one of the dimension reduction technique. In this method we have divided the raw dataset into
80
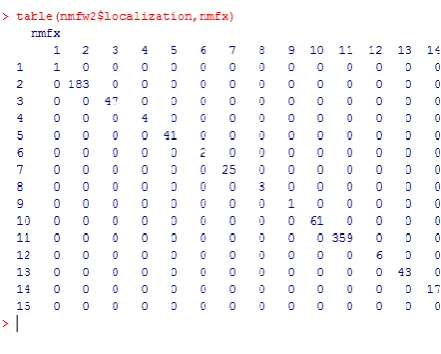
is taken as input for the neural network to generate a [image:4.595.73.294.113.290.2]model. The generated model shows 100% accuracy due to its non-negativity in nature
Figure 6: Confusion matrix of a model with NMF data
Finally for all these methods confusion matrix are plotted between actual values to the predicted values to calculate the true positive rate and false positive rates of the model generated using neural networks with various data pre-processing methods like feature selection & feature extraction.
4. CONCLUSION
The number of features is greater than the number of classes or patterns in high dimensional dataset. Variance Filter Method, PCA and NMF are applied for reducing the dimension of the provided dataset and train the model with neural network using R software. After applying, NMF shows the better classification accuracy, which has “100 %” accuracy.
REFERENCES
[1] J. Roden, B. King, D. Trout, A. Mortazavi, B.Wold, and C. Hart. (2006). Mining Gene Expression Data by Interpreting Principal Components. BMC Bioinformatics, vol. 7, pp. 1-22.
[2] K. Yeung and W. Ruzzo. (2001). Principal component analysis for clustering gene expression data.Bioinformatics, vol. 17, pp. 763-774.
[3] Kunihiro Nishimura, Koji Abe, Shumpei Ishikawa, Shuichi Tsutsumi, Koichi Hirota, Hiroyuki Aburatani, and Michitaka Hirose. (2003) A PCA Based Method of Gene Expression Visual Analysis. Genome Informatics.
[4] Timothy M. Josserand.Classification of gene expression data using PCA-based fault detection and identification. Genomic Signal Processing group, applied research labs.
[5] Al Nuaimi, Z.N.A.M., & Abdullah, R. (2017). Neural network training using hybrid particlemove artificial bee colony algorithm for
pattern classification. Journal of Information and Communication Technology, 16 (2), pp. 314-334. [6] C. Thirumalai& R. Manzoor. (2017) Investigating the breast cancer tissue utilizing semi-supervised learning and similarity measure. International conference of Electronics, Communication and Aerospace Technology (ICECA), pp. 269-274. [7] C. Thirumalai& R. Manzoor. (2017). Cost
optimization using normal linear regression method for breast cancer Type I skin. International conference of Electronics, Communication and Aerospace Technology (ICECA),pp. 264-268.
[8] C. Thirumalai& M. Senthilkumar. (2017). An assessment framework of intuitionistic fuzzy network for C2B decision making. 4th International Conference on Electronics, and Communication Systems (ICECS), pp. 164-167. [9] C. Thirumalai, G. V. SaiSharan, K. V. Krishna &
K. J. Senapathi. (2017). Prediction of diabetes disease using control chart and cost optimization-based decision. International Conference on Trends in Electronics and Informatics (ICEI), pp. 996-999.
[10] Kasim, M.M., Kashim, R., & Khan, S.A.M.N. (2017). A linear programming based model to measure efficiency and effectiveness of undergraduate programs. Journal of Information and Communication Technology, 16 (2), pp. 394-407.
[11] K. R. Mujahid& C. Thirumalai. (2017). Pearson Correlation Coefficient Analysis (PCCA) on Adenoma carcinoma cancer. International Conference on Trends in Electronics and Informatics (ICEI), pp. 492-495.
[12] K. Sharma, B. Muktha, A. Rani & C. Thirumalai, (2017). Prediction of benign and malignant tumor. International Conference on Trends in Electronics and Informatics (ICEI), pp. 1057-1060.
[13] Mokhtar, S.A., Wan Ishak, W.H., &Norwawi, N.M. (2016). Modeling reservoir water release decision using Adaptive Neuro Fuzzy Inference System. Journal of Information and Communication Technology, 15 (2), pp. 141-152.
[14] Olvi L. Mangasarian, Computer Sciences Dept. University of Wisconsin, 1210 West Dayton St., Madison, WI 53706
[15] Othman, M., &Azahari, S.N.F. (2016). Deseasonalised forecasting model of rainfall distribution using fuzzy time series. Journal of Information and Communication Technology, 15 (2), pp. 153-169.
81
[17] Ramli, R., Jamaluddin, F., Bakar, E.M.N.E.A.,Alias, M.Y., Mahat, N.I., &Karim, M.Z.A. (2013) Assignment of spectrum demands by merits via analytic hierarchy process and integer programming. Journal of Information and Communication Technology, 12 (1), pp. 39-53. [18] Srisawat, C., &Payakpate, J. (2016).
Comparison of MCDM methods for intercrop selection in rubber plantations. Journal of Information and Communication Technology, 15 (1), pp. 165-182.
[19] Vaishnavi B., K. Yarrakula, Karthikeyan J. & C. Thirumalai. (2017) An assessment framework for Precipitation decision making using AHP. 11th International Conference on Intelligent Systems and Control (ISCO), pp. 418-421.
[20] Dataset.