Assessing the Construct Validity and Reliability of
‘Twenty
-Five Identified
Potential BIM Uses (25_PoBU)
’
in Construction Industry in Malaysia
Afifuddin Husairi Bin Hussain
1, Mohd Khairi Abu Husain
1, Noor Irza Binti Mohd Zaki
1,
2Adi Irfan Che Ani,
3Zarina Mohd Ali
1
Razak School of Engineering and Advance Technology,
2 Faculty of Engineering and Built Environment,Universiti Kebangsaan Malaysia 3
Centre for Modern Languages and Human Sciences, Universiti Malaysia Pahang
[email protected], [email protected], [email protected],
[email protected], [email protected]
Abstract
Nowadays, the AEC community is preparing for a wholesale adoption of BIM. Therefore, it is now becoming increasingly important for public and private owners to engage with BIM initiatives and provide more comprehensive direction and guidance to their project teams about the use of BIM. In light of these, there is a need for validated questionnaire on the potential BIM uses in the construction industry. Therefore, the aim of this paper is to examine the overall fit statistics of the „Twenty-Five
Identified Potential BIM Uses (25_PoBU) across the Project Lifecycle‟ using the Rasch Measurement Model. This paper is approached from the perspective of clients‟ organisations. A 25-item questionnaire was used to collect data from 175 respondents. The findings of this research showed that the 25_PoBU instrument satisfactorily met the fit statistics.
Keywords: Building Information Modelling, Construction Industry, Rasch Measurement Mode 1.0 INTRODUCTION
Recently, great interest has been shown among researchers and practitioners in exploring how Building Information Modelling (BIM) will revolutionise in the construction industry.BIM has been referred to as a revolutionary innovation in the construction industry (Olatunji, 2005; Ayyaz, Emmitt, & Ruikar, 2012; Wu & Issa, 2013) because it is purported to transform the construction process throughout project lifecycle. Therefore, it is now becoming increasingly important for public and private owners to engage with BIM initiatives and provide more comprehensive direction and guidance to their project teams about the use of BIM (McGrawHill, 2014). This therefore reflects the importance to identify the potential value of BIM according to the required deliverables from the BIM process. Kreider, Messner, and Dubler (2010) suggest that demonstrating the value of BIM is a challenging task for construction organisation. However, there is yet no consensus on how to evaluate the potential value prior and during BIM implementation. This signifies a gap that BIM researchers and practitioners are attempting to fill.
A review of literature has indicated that one of the most widely used instruments for assessing the degree of implementation of potential value of BIM is the Twenty-Five Identified Potential BIM Uses (25_PoBU) developed by Kreider et al., (2010). Therefore, authors had decided to use the 25_PoBU and validate the instrument for use in the current construction industry setting in Malaysia in the present study of ‘Twenty-Five Identified Potential BIM Uses (25_PoBU) across the Project
2.0 INSTRUMENTATION
The 25_PoBU questionnaire (Kreider et al., 2010) was developed to assess perceived benefits of BIM currently being used in projects in the construction industry. The original instrument consisted of two sections. Section 1 asked participants to respond to the following question, “How frequently does your organization use each BIM Uses defined in the BIM Project Execution Planning Guide?” while Section 2 asked the following question, “What is your organization's perceived level of benefit to the
project for each use?”. In this study, we only focused on the second section of the questionnaire. For the question What is your organization's perceived level of benefit to the project for each use?, 5-point Likert scale was used: 1=Very negative; 2=Negative; 3=Neutral; 4=Positive; and 5=Very positive.
3.0 CONTENT AND FACE VALIDITY
Researchers followed the procedures of validity testing of the questions precisely, which also included content validity in order to ensure that the measures comprised adequate and representative set of items aligned to the research objectives. The validity procedures started with evaluation of content validity by experts from the academy and the industry. The instrument was given to one academician and three industry practitioners for review to assess the dimension and subjective agreement on the scale. At first, personal interview sessions were conducted with reviewers to identify whether the items in the questionnaire were able to measure what needed to be measured. At the same time, the reviewer also needed to identify barriers, difficulties and issues with the items which affected respondents in delivering accurate answers. After this process, the questionnaire went through the redevelopment process as suggested by reviewers.
For face validity, the reviewed instrument was given to five potential respondents. It was necessary that the potential respondents understood the items in the questionnaire and confirmed that all the items in the questionnaire were valid to measure the variables in this study. The purpose of this process was to get feedback and at the same time, it was necessary to avoid redundant elements and ensure that the questions were error-free and clear from the prejudices of individuals in the industry. The final validation process was done through the BIM Guide Workshop held on May 29, 2014 which was organized by Construction Industry Development Board Malaysia (CIDB).
All experts strongly agreed that there were three items that needed revision due to current practice in Malaysia. However, this did not change the whole of the original instrument. Overall, all reviewers agreed that the items in the instrument were relevant and offered some advice and suggestions for improvement.
4.0 DATA COLLECTION
The study was conducted between November 2013 and March 2014 during which the 25-item questionnaire was distributed online. The survey was distributed online to individuals who entered proper contact information when downloading the BIM Project Execution Planning Guide between October 2009 and December 2009. The online questionnaire was sent to 1,000 respondents and 175 participants responded to the question. The response rate was therefore 17.5%. It took three months to receive feedback from the respondents. The researcher decided to proceed with the analysis despite limited feedback.
5.0 DATA ANALYSIS
Data from this survey were sorted and coded using Microsoft Excel 2010 and then analysed using the Rasch modelling measurement procedure (Rasch, 1960), which allowed both organisations’
5.1 Examining the Consistency in Response Category
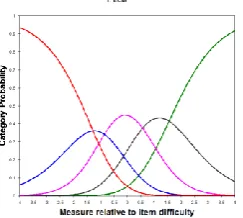
Figure 1 illustrates the distinction among the rating scale structure calibrations through the use Response Category Curve. Categories refer to each of the 5-point Likert rating. The original 5-point rating scale demonstrated poor functioning of Category 2 (Negative), 3 (Neutral) and 4 (Positive). It further revealed that respondents could not discriminate consistently between these three categories and had a low probability to be endorsed at any given point of the measure. Therefore, these categories needed to be collapsed. It is important to investigate and explore several categorizations before settling on the preferred one. There are indicators to which collapsing is chosen. The rule of thumb is that person-item separation should be at least 2; the average measures and step calibrations are monotonic (in ordered form); and the difference between each category should be less than 1.4 (Linacre, 2002).
Figure 1: Rating scale structure calibrations
The collapsing was done through trial and error process. As shown in Table 1, scale 12255 appeared to be the only scale that demonstrated acceptable category functioning. Furthermore, the variance explained by the measure increased from 41.2% to 42.7%. The response category functioning diagnostics of the 3-point scale (Very Negative, Negative and Positive) is presented in Table 1. Table 1 : Summary the results of the Rasch analysis of each rating scale modification
Categorization 12345 12225 12255 13335 11335 12225
Observed Measure disordered Ordered Ordered Ordered Ordered Ordered Step calibrations disordered Ordered Ordered Ordered Ordered Ordered Person Reliability 0.88 0.81 0.85 0.8 0.86 0.81 Person separation 2.77 2.04 2.39 2.02 2.52 2.04 Item Reliability 0.92 0.73 0.88 0.83 0.89 0.73 Item separation 3.28 1.66 2.66 2.23 2.89 1.66 Variance Explained by measure (%) 41.20% 32.50% 42.70% 32.40% 39.10% 32.50% Difference in cat measure > 1.4 > 1.4 > 1.4 > 1.4 > 1.4 > 1.4
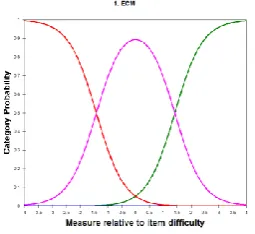
Figure 2: Rating scale after structure calibrations
After the collapsing process, the response category curve exhibited better curve indicating that the respondents agreed with item difficulties. It also revealed the following: respondents with low measures only answered the easy items positively (but not the moderately and the most difficult items); respondents with medium measures answered the easy, or the least difficult and moderately difficult items positively (but not the most difficult items); and respondents with high measures answered the easy, or the least difficult, moderately difficult and the most difficult items positively.
5.2 Overall Fit Analysis
The summary statistics, as shown in Table 2, provide the goodness fit of the overall data. The
organisations’ Reliability Index was 0.90 with 2.96 Separation Index indicating that there were enough good items to differentiate organisation ability level. The further organisation fit statistics investigation on outfit for Mean-Square (OMNSQ) and Z-Score (OZSTD) showed that the OMNSQ was 0.98 and OZSTD was -0.20, which were close to the expected values of 1 and 0 respectively. This also revealed that the 25 items were targeting the right type of respondents in measuring the latent traits and yielded data at a reasonable prediction level of the responses to the items. The maximum organisation ability was δmax = +0.88 logit and the minimum measure was δmin = -3.54 logit.
The length of the logit scale was 4.22. The Organisation Mean, δmean = -0.28 logit revealed that the majority of the organisations found it difficult to endorse the items. Furthermore, based on the formula for calculating the number of strata (GP), GP=2.96 was computed into the strata formula, which yielded a distinctive groups of four strata. This suggests that the organisations were spread adequately into four groups across the items and the trait continuum.
Table 2: Statistics Summary
As shown in Table 2, the Item Reliability was βitem = 0.99 with suggesting that the instrument had a
good fit with the model. The high item reliability also indicated that the replicability of the items would occur if these items were given to another sample of respondents of the same size. As for the Item Mean, it was set at µmean 0.00 logit to ensure that each organisation had a 50:50 chance of success
in responding to the item that matched their ability. The OMNSQ was 0.98 and OZSTD was -0.10, which were close to the expected values of 1 and 0 respectively. This also revealed that most of the items targeted the organisation distribution, which meant an excellent targeting of the items to organisations. The maximum item ability was βmax = +1.14 logit and the minimum measure was µmin =
36 measured organisation 25 measured item
Reliability 0.90 0.91
Separation Index 2.96 3.19
Mean -0.28 0.00
S.D. 0.00 0.00
Max. 0.88 1.14
Min. -3.54 -2.24
Outfit MNSQ 0.98 0.98
Outfit ZSTD -0.20 -0.10
S.E 0.16 0.16
Cronbach Alpha (Kr-20) 0.90
-2.24 logit. The length of the logit scale was 3.38. The separation statistic for items was 3.19, indicating that the 25 items were generally separated into four groups.
The Principal Components Analysis (PCA) was performed to assess residual variance for the 25 measured items. The results of PCA in the Table 3 show that the raw variance explained by measures of 45.30% and it fulfilled minimum raw variance explained by measures as proposed by Fisher (2007) and Linacre (2007). Nevertheless, the unexplained variance in the first factor of 10.5%, rated the instrument as good (Fisher, 2007). In overall, this resulted in a 25-item in measuring potential BIM Uses, which was shown to be unidimensional with good internal consistency and a stable factor structure over time.
5.3 Item Fit Analysis
Item fit analysis was conducted in assessing how well the items fitted the Rasch Model. Items are regarded as misfits when they do not measure the variable accordingly and provide a distorted representation of the data. Keeping these misfit items would not be advantageous, and is considered as a threat to validity. In Rasch Measurement Model, the items are considered misfits when they fulfil the following three criteria:
Outfit MNSQ - item should be accepted if it is within 0.5-1.5
Outfit ZSTD - item should be accepted if it is within the range of +/- 2
Point to Measure Correlation - item should be accepted if it is within the range of 0.30 - 0.80
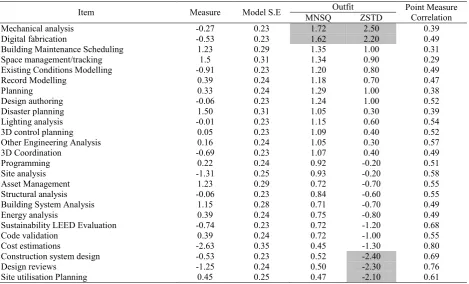
Table 3 : Item Misfit Order
Item Measure Model S.E MNSQ Outfit ZSTD Point Measure Correlation Mechanical analysis -0.27 0.23 1.72 2.50 0.39 Digital fabrication -0.53 0.23 1.62 2.20 0.49 Building Maintenance Scheduling 1.23 0.29 1.35 1.00 0.31 Space management/tracking 1.5 0.31 1.34 0.90 0.29 Existing Conditions Modelling -0.91 0.23 1.20 0.80 0.49 Record Modelling 0.39 0.24 1.18 0.70 0.47
Planning 0.33 0.24 1.29 1.00 0.38
Design authoring -0.06 0.23 1.24 1.00 0.52 Disaster planning 1.50 0.31 1.05 0.30 0.39 Lighting analysis -0.01 0.23 1.15 0.60 0.54 3D control planning 0.05 0.23 1.09 0.40 0.52 Other Engineering Analysis 0.16 0.24 1.05 0.30 0.57 3D Coordination -0.69 0.23 1.07 0.40 0.49 Programming 0.22 0.24 0.92 -0.20 0.51 Site analysis -1.31 0.25 0.93 -0.20 0.58 Asset Management 1.23 0.29 0.72 -0.70 0.55 Structural analysis -0.06 0.23 0.84 -0.60 0.55 Building System Analysis 1.15 0.28 0.71 -0.70 0.49 Energy analysis 0.39 0.24 0.75 -0.80 0.49 Sustainability LEED Evaluation -0.74 0.23 0.72 -1.20 0.68 Code validation 0.39 0.24 0.72 -1.00 0.55 Cost estimations -2.63 0.35 0.45 -1.30 0.80 Construction system design -0.53 0.23 0.52 -2.40 0.69 Design reviews -1.25 0.24 0.50 -2.30 0.76 Site utilisation Planning 0.45 0.25 0.47 -2.10 0.61
Based on the aforementioned criteria, Table 3 shows that none of the items fulfilled the three stipulated criteria for misfit. However, three items (Mechanical Analysis, Digital Fabrication, Construction System Design, Design Reviews and Site Utilisation Planning) were diagnosed as minor misfits. Nevertheless, they were still at an acceptable range since, when referring vertically to Outfit MNSQ, Outfit ZSTD and Point Measure Correlation, all were within an accepted range. Thus, these items were retained for further analysis.Overall, the statistics for fit analysis criteria of the items were in the following range:
Outfit MNSQ = 0.47 > x <1.72 Outfit ZSTD = -0.20 > x <2.50
Point Measure Correlation = 0.29 > x <0.76
Based on the above analysis, it can be concluded that the 25 items used to identify the potential of BIM Uses for Construction Industry in Malaysia had a good range and there was no item misfit. It also gave further indication of the validity of the goodness-of-fit of the instrument measuring what was meant to be measured.
6.0 Conclusion
The findings of the present study showed that the 25_PoBU instrument satisfactorily met the unidimensionality, had a standard interval scale, high reliable item reliability indices, acceptable item difficulty invariance and outfit values. The results of this study should be interpreted with caution because reliability and validity of instrument using psychometric analysis is important. Nevertheless, the reporting on reliability and validity especially using psychometric in construction management research has received less attention. Therefore, this research has made significant contribution to the theory and practice of BIM in the construction management. It is recommended that further psychometric analyses on similar and different samples should be carried out and complemented by qualitative focus group interviews or case study in order to ensure that the sets of items are relevant both conceptually and empirically when tested with the Rasch Model. Based on researchers’ review of existing literature, the
present study is believed to be the first of its kind to have validated the original 25_PoBU instrument for use in the context of the Malaysia construction industry. It should be noted that this research is only the first step and future development is therefore needed to further explore the potential BIM uses in the Malaysia construction industry. Moreover, this study also provides a unique insight into the attitudes of clients’ organisations in Malaysia in BIM implementation.
References
Ayyaz, M., Emmitt, S., & Ruikar, K. (2012). Towards understanding BPR needs for BIM implementation. In First UK Academic Conference On BIM: Conference Proceedings.
Bond, T. G. (2003). Validity and assessment : a Rasch measurement perspective. Metodologia de Las
Ciencias Del Comportamiento, 5(2), 179–194.
Chien, C.-W., Brown, T., & McDonald, R. (2011). Rasch analysis of the assessment of children’s
hand skills in children with and without disabilities. Research in Developmental Disabilities, 32(1), 253–61. http://doi.org/10.1016/j.ridd.2010.09.022
Kreider, R., Messner, J., & Dubler, C. (2010). Determining The Frequency And Impact of Applying BIM For Different Purposes On Projects. In proceedings of the 6th International Conference on Innovation in Architecture, Engineering and Construction (AEC) (pp. 1–10).
Linacre, J. M. (2002). Optimizing Rating Scale Category Effectiveness. Journal of Applied Measurement 3:1, 3(1), 85–106.
Olatunji, O. A. (2005). Building Information Modeling and Intellectual Propertization : A Revolutionary Nirvana or a Disillusionment ? Construction Technology and the Law, 77–85. Wu, W., & Issa, R. R. A. (2013). Impacts of BIM on Talent Acquisition. Procs 29th Annual ARCOM