SCHROEDER, BASTIAN JONATHAN. A Behavior-Based Methodology for Evaluating Pedestrian-Vehicle Interaction at Crosswalks. (Under the direction of Dr. Nagui
Rouphail.)
This dissertation explores the interaction of pedestrians and drivers at unsignalized crosswalks in an event-based data collection and analysis approach. Through logistic regression techniques the microscopic data are used to derive predictive models for driver yielding and pedestrian crossing behavior. The analysis found that pedestrian and driver decision-making processes are sensitive to the dynamic profile of the vehicle, pedestrian characteristics and other concurrent events at the crosswalk. By relating the yield
outcome to the dynamic state of the vehicle, a region of vehicle dynamics constraints was defined where virtually no yields are observed. Pedestrian assertiveness was found to be a key variable for promoting yielding behavior and increasing the likelihood of a pedestrian crossing. A contrast of the behavioral models for driver yielding and pedestrian crossing found a generally better model fit for the latter category. It is reasoned that the pedestrian decision is strongly influenced by the temporal duration to the point of conflict and the consequences of a poor decision. With a lack of enforcement, a driver is more easily swayed in the decision of whether or not to yield. The pedestrian crossing data are thus more consistent than the yielding data, resulting in models with greater statistical power. The evaluation of two pedestrian crossing treatments found that the treatments resulted in expected increases in the likelihood of drivers yielding, but also promoted more
aggressive pedestrian behavior. For a pedestrian-actuated treatment, the effect on yielding was found to be greater following activation. The predictive models for two
Interaction at Crosswalks
by
Bastian Jonathan Schroeder
A dissertation submitted to the Graduate Faculty of North Carolina State University
in partial fulfillment of the requirements for the Degree of
Doctor of Philosophy
Civil Engineering
Raleigh, North Carolina 2008
APPROVED BY:
____________________ _________________ _______________
Dr. Joseph Hummer Dr. Billy Williams Dr. Dennis Boos
DEDICATION
BIOGRAPHY
Bastian Jonathan Schroeder was born on August 18, 1980 in Frankfurt, Germany. He grew up in Kriftel, Germany and received his Abitur high school diploma from the Main-Taunus Schule in Hofheim, Germany in 1999. He immigrated to the United States in February 2000 and enrolled as an undergraduate at North Carolina State University in the fall of 2000. In May 2004, he graduated with a Bachelor of Science in Civil Engineering and a Bachelor of Science in Multidisciplinary Studies. Mr. Schroeder continued his graduate career at NCSU where he received a Master of Civil Engineering in December 2005. Since that time he had been working on his Ph.D. degree under the supervision of Dr. Nagui Rouphail in the Department of Civil, Construction, and Environmental Engineering at North Carolina State University. He started working as a research
ACKNOWLEDGEMENTS
I would like to express my deepest thanks to my family for their continued support during my collegiate career. The path to this degree has been long and at times challenging and it was the love and support of my family that carried me through when ambition failed. I feel very fortunate and thankful to have a wonderfully unique and caring family that stands behind my aspirations.
I would also like to express my thanks and gratitude to my dissertation advisory committee, Dr. Nagui Rouphail, Dr. Joe Hummer, Dr. Billy Williams, and Dr. Dennis Boos. They have been supportive and encouraging throughout my collegiate career and have always been accessible inside and outside the classroom. I owe special gratitude to my advisory chair, Dr. Nagui Rouphail, for his guidance through my graduate studies and this dissertation. I would also like to thank two other members of the N.C. State faculty, Dr. John Stone and Dr. David Greene, who have both been instrumental in shaping my path through college.
I also owe thanks to the staff at the Institute for Transportation Research and Education (ITRE) for a friendly, supportive and flexible work environment. Special recognition and gratitude go to Dr. Ron Hughes, Mr. Chris Cunningham, Dr. Kosok Chae and the
remaining members of the NCHRP 3-78a research team. This dissertation would not exist in its current form without their input and advice.
I further acknowledge the financial support from the National Cooperative Highway Research Program, the Southeastern Transportation Center, the Federal Highway
Administration Eisenhower Fellowship program, and the North Carolina State University College of Engineering. Additionally, this research was partially funded by a
TABLE OF CONTENTS
List of Tables ... ix
List of Figures ... xi
List of Equations... xiii
List of Abbreviations ... xiv
1 Introduction...1
1.1
Motivation...3
1.2
Contribution to Knowledge ...8
1.3
Research Objectives...9
1.4
Research Scope ...10
1.5
Outline of Dissertation...11
2 Analysis Framework ...13
2.1
A Framework for Evaluating Unsignalized Crossings...13
2.2
Pedestrian Crossing Facilities...17
2.2.1 Channelized Right-Turn Lanes ... 18
2.2.2 Mid-Block Crossings ... 18
2.2.3 Roundabout Crossings ... 19
2.3
The Range of Pedestrian Treatments...20
2.3.1 Increasing Pedestrian Visibility ... 21
2.3.2 Forcing Behavior Change ... 24
2.3.3 Interrupting Traffic Flow ... 26
2.3.4 Assisting Blind Pedestrians ... 27
2.4
Pedestrian-Vehicle Interaction...27
2.4.1 Pedestrian Crossing Behavior ... 27
2.4.2 Driver Yielding Behavior ... 36
2.5
Data Needs ...39
2.5.1 The Crosswalk Interaction ... 39
2.5.2 Interaction Parameters ... 39
2.6
Chapter Summary ...43
3 Methodology ...45
3.1
Data Collection ...45
3.1.1 Interaction Characteristics ... 45
3.1.2 Data Collection Set-Up ... 50
3.1.3 Data Extraction and Reduction ... 54
3.1.4 Variable Definitions... 54
3.2
Estimating Probability Parameters ...61
3.2.1 Review of Statistical Models ... 61
3.2.2 Logistic Model Forms... 63
3.3
Site Description...75
3.4
Chapter Summary ...82
4 Driver Yielding Models at Mid-Block Crossings...83
4.1
Event-Based Analysis for MB-CLT ...84
4.1.1 Descriptive Statistics... 84
4.1.2 Variable Interactions... 86
4.1.3 Vehicle Dynamics Constraints... 87
4.2
Yield Model Development for MB-CLT...89
4.2.1 Variable Selection... 89
4.2.2 Multilinear Regression Analysis... 90
4.2.3 Binary Logit Models – MB-CLT... 92
4.2.4 Cumulative Logit Model... 99
4.2.5 Multinomial Logit Model ... 100
4.2.6 Nested Logit Model ... 101
4.2.7 MB-CLT Site Summary... 103
4.3
Event-Based Analysis for MB-RAL...105
4.3.1 Descriptive Statistics... 105
4.3.2 Variable Interactions... 107
4.3.3 Vehicle Dynamics Constraints... 108
4.4
Yield Model Development for MB-RAL ...110
4.4.1 Variable Selection... 110
4.4.2 Multilinear Regression Analysis... 111
4.4.3 Binary Logit Models – MB-RAL ... 112
4.4.4 Cumulative Logit Model... 116
4.4.5 Multinomial Logit Model ... 117
4.4.6 Nested Logit... 117
4.4.7 MB-RAL Site Summary ... 119
4.5
Chapter Summary ...121
5 Pedestrian Crossing Models at Mid-Block ...124
5.1
Characterizing Pedestrian Gap Acceptance...124
5.1.1 Definitions... 126
5.2
Traditional Gap Acceptance Approaches ...128
5.2.1 Graphical Method ... 128
5.2.2 Maximum Likelihood Estimation ... 132
5.2.3 Ramsey-Routledge Method ... 134
5.2.4 Result Synthesis from Traditional Gap Acceptance Approaches ... 137
5.3
Event Based Analysis for MB-CLT ...139
5.3.1 Descriptive Statistics... 139
5.3.2 Variable Interactions... 142
5.3.3 Exploratory Analysis for Pedestrian GO Lags... 143
5.4
Crossing Model Development for MB-CLT ...145
5.4.2 Binary Logit Models for MB-CLT ... 146
5.4.3 Site Summary... 153
5.5
Event-Based Analysis for MB-RAL...155
5.5.1 Descriptive Statistics... 155
5.5.2 Variable Interactions... 157
5.5.3 Explanatory Analysis for Pedestrian Gap Acceptance ... 158
5.6
Crossing Model Development for MB-RAL...161
5.6.1 Multilinear Regression Models... 161
5.6.2 Binary Logit Models for MB-RAL... 162
5.6.3 Site Summary... 167
5.7
Chapter Summary ...169
6 Yielding and Crossing at Roundabouts...171
6.1
Roundabout Crosswalks ...171
6.2
Yielding Models for Roundabout Crossing...173
6.2.1 Event Based Analysis ... 174
6.2.2 Yield Model Development for RBT-RAL... 179
6.2.3 Yielding Model Summary... 188
6.3
Pedestrian Crossing Models at Roundabouts ...189
6.3.1 Event Definitions ... 189
6.3.2 Conventional Gap Acceptance Approaches... 190
6.3.3 Event-Based Analysis ... 196
6.3.4 Crossing Model Development for RBT-RAL... 200
6.3.5 Crossing Model Summary ... 205
6.4
Chapter Summary ...206
7 Simulation Implementation...208
7.1
Site and Model Comparison ...208
7.2
Overview of Pedestrian Modeling in Microsimulation ...211
7.3
The Research in the Simulation Context ...214
7.4
Algorithm Requirements...217
7.5
Chapter Summary ...220
8 Conclusions and Recommendations ...221
8.1
Summary of Major Findings...221
8.2
Revisiting Objectives...224
8.2.1 Objective 1 ... 224
8.2.2 Objective 2 ... 225
8.2.3 Objective 3 ... 226
8.2.4 Objective 4 ... 227
8.3
Research Limitations ...228
8.4
Areas of Future Research...230
9 References...234
10 Appendix...241
10.1
Appendix A: Yielding at Mid-Block Models ...242
10.2
Appendix B: Pedestrian Crossing at Mid-Block Models ...263
LIST OF TABLES
Table 1: Hypothesized Impact of Independent Variables on Response ... 59
Table 2: Descriptive Statistics, MB-CLT ... 84
Table 3: Descriptive Statistics, MB-RAL... 106
Table 4: Critical Gap/Lag Results - All Data... 130
Table 5: Critical Gap/Lag Results – Before and After ... 131
Table 6: MLE Results - Paired Data - Gaps ... 133
Table 7: Critical Gap/Lag Results from RR Method ... 135
Table 8: Critical Gap/Lag Results from RR Method - Before & After ... 137
Table 9: Summary Comparison of Traditional Gap Acceptance Approaches... 138
Table 10: Descriptive Statistics – MB-CLT ... 139
Table 11: Descriptive Statistics – MB-CLT – Near/Far/Combo ... 141
Table 12: Descriptive Statistics – MB-RAL... 155
Table 13: Descriptive Statistics – MB-RAL – Near/Far/Combo... 157
Table 14: Descriptive Statistics for RBT-RAL Yield Data ... 174
Table 15: Critical Gap/Lag Results - All Data... 191
Table 16: Critical Gap/Lag Results, Observed – by Entry/Exit... 193
Table 17: Summary of RR Results for RBT-RAL... 195
Table 18: Summary Comparison of Gap Acceptance Approaches for RBT-RAL... 195
Table 19: Descriptive Statistics for Pedestrian Crossing Model - RBT-RAL ... 197
Table 20: Summary of Restricted Models for Driver Yielding ... 208
Table 21: Summary of Restricted Models for Pedestrian Crossing... 209
Table 22: Variable Implementation ... 219
Table A-23: Correlation Matrix with Yield Response, MB-CLT *... 243
Table A-24: DYM Results of Multi-Linear Regression, MB-CLT ... 244
Table A-25: DYM Results of Binary Logistic Regression, MB-CLT... 245
Table A-26: DYM Results of Cumulative Logistic Regression, MB-CLT ... 247
Table A-27: DYM Results of Multinomial Logistic Regression, MB-CLT... 249
Table A-28: DYM Results of Nested Logistic Regression, MB-CLT... 251
Table A-29: Correlation Matrix with Yield Response, MB-RAL * ... 253
Table A-30: DYM Results of Multi-Linear Regression, MB-RAL... 254
Table A-31: DYM Results of Binary Logistic Regression, MB-RAL ... 255
Table A-32: DYM Results of Cumulative Logistic Regression, MB-RAL... 257
Table A-33: DYM Results of Multinomial Logistic Regression, MB-RAL ... 259
Table A-34: DYM Results of Nested Logistic Regression, MB-RAL ... 261
Table B-35: Correlation Matrix – MB-CLT - Gaps*... 265
Table B-36: Correlation Matrix – MB-CLT - Lags* ... 266
Table B-37: Correlation Matrix – MB-RAL - Gaps* ... 267
Table B-38: Correlation Matrix – MB-RAL - Lags*... 268
Table B-39: PCM Results of Multi-Linear Regression for Lags – MB-CLT... 269
Table B-42: PCM Results of Binary Logistic Regression for Gaps - MB-CLT... 277
Table B-43: PCM Results of Multi-Linear Regression for Lags – MB-RAL ... 280
Table B-44: PCM Results of Multi-Linear Regression for Gaps – MB-RAL... 282
Table B-45: PCM Results of Binary Logistic Regression for Lags - MB-RAL +*... 284
Table B-46: PCM Results of Binary Logistic Regression for Gaps - MB-RAL ... 287
Table C-47: Correlation Matrix, RBT-RAL, Yielding Model*... 291
Table C-48: Correlation Matrix, RBT-RAL, Yielding Model – EXIT only* ... 292
Table C-49: Correlation Matrix, RBT-RAL, Yielding Model – ENTRY only* ... 293
Table C-50: DYM Multilinear Regression Models - RBT-RAL... 294
Table C-51: DYM Binary Logit Regression Models - RBT-RAL ... 296
Table C-52: DYM Cumulative Logit Regression Models - RBT-RAL ... 299
Table C-53: DYM Multinomial Logit Regression Models - RBT-RAL ... 301
Table C-54: DYM Nested Logit Models, Level 2 - RBT-RAL... 303
Table C-55: Correlation Matrix, RBT-RAL, Pedestrian Crossing Model – Lags Only*305 Table C-56: Correlation Matrix, RBT-RAL, Pedestrian Crossing Model – Gaps Only*306 Table C-57: PCM Multilinear Regression Models - RBT-RAL – Lags Only... 307
Table C-58: PCM Multilinear Regression Models - RBT-RAL – Gaps Only ... 309
Table C-59: PCM Binary Logit Regression Models - RBT-RAL – Lags Only ... 311
LIST OF FIGURES
Figure 1: Analysis Framework Flowchart ... 15
Figure 2: Roundabout Pedestrian Crossing... 19
Figure 3: In-Road Pedestrian Signs ... 22
Figure 4: Roadside Pedestrian Flasher... 23
Figure 5: In-Pavement Flashing Crosswalk... 24
Figure 6: Raised Crosswalk, Speed Humps and Chicanes ... 25
Figure 7: Offset Marked Crosswalk & Signing, Offset to the right... 26
Figure 8: Time-to-Collision Concept... 41
Figure 9: Time to Stop Relationships ... 42
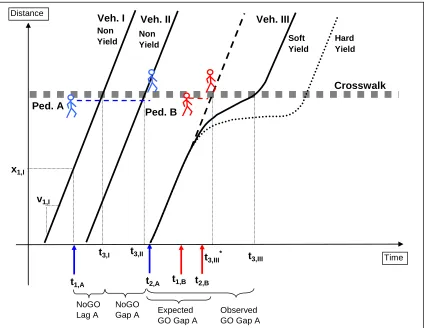
Figure 10: Pedestrian-Driver Interaction in Time-Space Domain... 49
Figure 11: Data Collection Set-Up ... 52
Figure 12: Picture of Laser Speed Measurement Device (Source: www.laseratlanta.com) ... 53
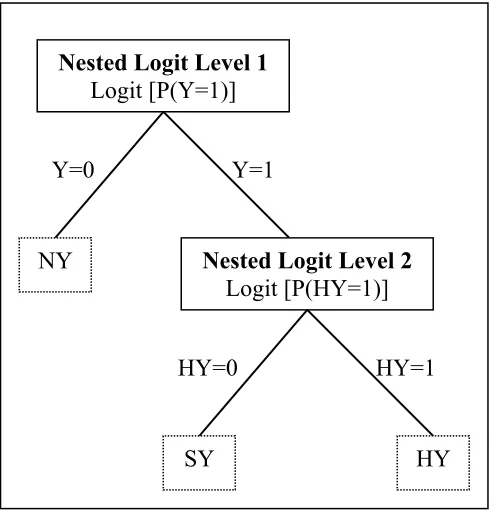
Figure 13: Nested Binary Logit Flowchart ... 68
Figure 14: Photos of Data Collection Site MB-CLT ... 78
Figure 15: Photos Data Collection Site MB-RAL ... 79
Figure 16: Photos of Data Collection Site RBT-RAL ... 80
Figure 17: Speed-Distance Relationship including Deceleration Thresholds, MB-CLT . 89 Figure 18: Model Probability Plots – Multi-Linear Regression, Restricted Model, MB-CLT ... 92
Figure 19: Model Probability Plots – Binary Logit, Unrestricted, MB-CLT ... 97
Figure 20: Model Probability Plots – Binary Logit, Restricted Model 3, MB-CLT ... 98
Figure 21: Model Probability Plots – Nested Logit, Restricted Model 3, MB-CLT ... 102
Figure 22: Combined Yield Probability for MB-CLT after Treatment Installation ... 104
Figure 23: Speed-Distance Relationship including Deceleration Thresholds, MB-RAL110 Figure 24: Model Probability Plots – Multi-Linear Regression, Restricted Model, MB-RAL... 112
Figure 25: Model Probability Plots – Binary Logit, Unrestricted Model, MB-RAL ... 114
Figure 26: Model Probability Plots – Binary Logit, Restricted Model 2, MB-RAL ... 115
Figure 27: Model Probability Plots – Nested Logit Level 2, Restricted Model 4, MB-RAL ... 119
Figure 28: Combined Yield Probability for MB-RAL Site ... 121
Figure 29: Cumulative Probability Plots for Pedestrian Gap Acceptance... 130
Figure 30: Gap/Lag Distributions from Ramsey-Routledge Methodology ... 134
Figure 31: Before & After Distributions from Ramsey-Routledge Methodology... 136
Figure 32: Plot of GO and NOGO events for Lag Analysis – MB-CLT... 144
Figure 33: Model Probability Plot for Lags – Unrestricted Model 1 - MB-CLT ... 147
Figure 34: Model Probability Plot for Lags – Restricted Model 5 - MB-CLT... 148
Figure 35: Model Probability Plot for Gaps – Unrestricted Model 2 - MB-CLT... 150
Figure 38: Plot of GO and NOGO Events – MB-RAL – by Lag Type ... 161
Figure 39: Model Probability Plot for Lags – Unrestricted Model 1 - MB-RAL... 163
Figure 40: Model Probability Plot for Lags – Restricted Model 2 - MB-RAL ... 164
Figure 41: Model Probability Plot for Gaps – Unrestricted Model 1 - MB-RAL ... 166
Figure 42: Model Probability Plot for Gaps – Restricted Model 3 - MB-RAL... 167
Figure 43: Roundabout Crosswalk Geometry (adopted from FHWA, 2000)*... 172
Figure 44: Speed-Distance Plot with Decel. Thresholds, RBT-RAL ... 178
Figure 45: Yield Probability Plot, RBT-RAL - Restricted Model 4... 181
Figure 46: DYM Probability Plots for Cumulative Logit Restricted Model 3 - RBT-RAL ... 185
Figure 47: Yield Probability Plot, Nested Logit Level 2, Restricted Model 3 - RBT-RAL ... 187
Figure 48: Graphical Method for RBT-RAL Pedestrian Data... 191
Figure 49: Graphical Method for RBT-RAL Pedestrian Data – by Entry/Exit Leg... 192
Figure 50: Gap/Lag Distribution from RR Methodology for RBT-RAL ... 195
Figure 51: Exploratory Analysis of Lags for RBT-RAL ... 200
Figure 52: Probability Plot for P(GO) in a Lag – Restricted Model 2 - RBT-RAL ... 202
Figure 53: Probability Plots Gaps, Unrestricted Model 2, RBT-RAL - Gaps ... 204
Figure 54: Probability Plots, Restricted Model 3, RBT-RAL - Gaps... 205
Figure B-55: Cumulative Prob. Plots for Ped. Crossing– MB-CLT... 263
LIST OF EQUATIONS
Equation 1: HCM Capacity Equation for Two-Way Stop Controlled Intersection (17-70)
... 29
Equation 2: Pedestrian Critical Gap after HCM (Equation 18-17)... 33
Equation 3: General Statistical Model for Driver Yielding ... 62
Equation 4: Binary Probit Model for Driver Yielding... 62
Equation 5: Logit Model for Driver Yielding... 63
Equation 6: Binary Logit Model... 64
Equation 7: Estimating Probabilities from Binary Logit Model... 64
Equation 8: Probability Estimates from Multinomial Logit Model for Driver Yielding.. 66
Equation 9: Model Form of Cumulative Logit Model for Ordered Responses ... 67
Equation 10: Probability Estimates from Cumulative Logit Model for Driver Yielding . 67 Equation 11: Odds of Response 1 for Binary Logit Model ... 69
Equation 12: Pseudo R-Square for Logit Model... 70
Equation 13: Akaike Information Criterion (AIC) for Logit Model Estimation ... 71
Equation 14: DYM – Mid-Block Yield – Unrestricted Model, MB-CLT... 96
Equation 15:DYM – Mid-Block Yield – Restricted Model 3, MB-CLT ... 97
Equation 16: DYM – Mid-Block Yield – Nested Logit, Restricted Model 3, MB-CLT 102 Equation 17: DYM – Mid-Block Yield – Binary Logit, Unrestricted Model, MB-RAL114 Equation 18: DYM – Mid-Block Yield – Binary Logit, Restricted Model 2, MB-RAL 115 Equation 19: DYM – Mid-Block Yield, Nested Logit, Restricted Model 4, MB-RAL . 118 Equation 20: PCM - Mid-Block Lag, Unrestricted Model 1, MB-CLT ... 146
Equation 21: PCM - Mid-Block Lag, Restricted Model 5, MB-CLT... 148
Equation 22: PCM - Mid-Block Gap, Unrestricted Model 2 – MB-CLT... 149
Equation 23: PCM - Mid-Block Gap, Restricted Model 3, MB-CLT ... 151
Equation 24: PCM - Mid-Block Lags, Unrestricted Model 1, MB-RAL ... 162
Equation 25: PCM - Mid-Block Lags, Restricted Model 2, MB-RAL... 163
Equation 26: PCM - Mid-Block Gaps, Unrestricted Model 1, MB-RAL... 165
Equation 27: PCM - Mid-Block Gaps, Restricted Model 3, MB-RAL ... 166
Equation 28: DYM – Binary Logit, Restricted Model 4, RBT-RAL ... 181
Equation 29: DYM Cumulative Logit, Restricted Model 3, RBT-RAL... 183
Equation 30: DYM – Nested Logit Level 2, Restricted Model 3, RBT-RAL ... 187
Equation 31: PCM - Restricted Model 2 - RBT-RAL - Lags ... 202
Equation 32: PCM - Unrestricted Model 2 - RBT-RAL - Gaps ... 203
LIST OF ABBREVIATIONS
Response VariablesGO – Pedestrian Event is GO (crossing was initiated). Also the binary outcome of the pedestrian event (GO=1, NOGO=0)
HY – The outcome of the vehicle event is a hard yield, indicating that the driver slowed down to a full stop to create a crossing opportunity for the pedestrian
LAG_EVENT - Pedestrian Event is a Lag (First Event after arriving at the crosswalk)
NOGO – Pedestrian Event is NO-GO (no crossing event)
NY – The outcome of the vehicle event is a Non Yield
SY – The outcome of the vehicle event is a Soft Yield, indicating that the driver slowed down for the pedestrian, but did not come to a full stop
YIELD – The binary outcome of the yield event (Yield=1, Non-Yield=0)
Y_ORDERED – The categorical outcome of the yield event with three ordered outcomes
(3=HY=hard yield, 2=SY=soft yield, 1=NY=non-yield)
Y_TYPE - The binary type of the yield event outcome (HY=1, SY=0)
Discrete Explanatory Variables
ADY – Presence of an adjacent yield in the opposite direction; ADY=1 if a vehicle in the opposite lane has already yielded for the pedestrian at the crosswalk
AST – The pedestrian is assertive; AST=1 if the pedestrian exhibits assertive behavior in the approach of the crosswalk, indicated for example through fast walking pace
COM – Indication of non-verbal communication between driver and pedestrian; COM=1 if there is evidence of non-verbal interaction (waving, raising hand to say 'Thank You') between the driver and pedestrian
DECEL_TAU – The deceleration rate threshold is satisfied; DECEL_TAU=1 if the
deceleration rate necessary to come to a full stop before the crosswalk is greater than 10ft/sec^2
DSC – Presence of an downstream conflict; DSC=1 if a vehicle is stopped downstream of the crosswalk or if there is heavy traffic in the circulating lane preventing immediate entry into the circle (Roundabout Only)
ENTRY – Indication of whether the event occurred at the entry leg of the roundabout
(Entry = 1) or at the exit leg (Entry = 0) - (Only applicable for roundabout site)
FLASH – Indication whether the flashing beacon was actuated by the pedestrian;
FLASH=1 if beacon was flashing during the yield event (Only applicable for Charlotte, NC site)
FOLL – Approaching vehicle has close follower; FOLL=1 if the vehicle has a follower at a short headway of approximately 2-4 seconds
G_NEAR – The observed gap/lag event has a vehicle in the near lane and no vehicle in
the far lane relative to the waiting pedestrian
G_COMBO – The observed gap/lag event has a vehicle in both lanes (near and far) - the gap/lag size is measured relative to first vehicle arrival
HEV – Approaching vehicle is a heavy vehicle; HEV=1 if the vehicle is anything larger than the equivalent of a 15-passenger van (dump truck, TTST, bus)
MUP – There are multiple pedestrians present in the crosswalk influence area; MUP=1 if the number of pedestrians waiting at the curb is greater than 1
NEAR – Pedestrian is waiting on the near-side of the approaching vehicle; NEAR=1 if the pedestrian waits on the same side of the road that the vehicle is traveling on
PLT – Approaching vehicle is part of a platoon of vehicles; PLT=1 if the headway to the following OR the previous vehicle was short (approximately 2-4 seconds)
PREV – The previous vehicle passed without yielding; PREV=1 if the previous vehicle failed to yield to the same pedestrian waiting at the crosswalk
PXW – A pedestrian from a previous event is still present in the crosswalk; PXW=1 if the driver has to account for a pedestrian who is still in the roadway from a previous event
QUE – Vehicle is part of a queue of vehicles; QUE=1 if the queue or platoon that the vehicle is a part of is moving slowly due to some downstream congestion or incident
TRIG – The pedestrian triggered the yield by stepping into roadway; TRIG=1 if the pedestrian actively seized the roadway before the driver action indicated a yield
TRTMT – Presence of crossing treatment; TRTMT=1 if the treatment was installed and
so is equivalent to the 'after' case (Only applicable for Mid-Block sites)
TTC_TAU – The time to collision threshold is satisfied; TTC_TAU=1 if the theoretical time to arrival at the crosswalk is less than 3 seconds (TTC=DIST1/SPEED_FT) Continuous Explanatory Variables
DECEL – Deceleration rate necessary to come to a full stop prior to crosswalk; DECEL
is calculated from measured speed and distance;
DECEL=(SPEED_FT*SPEED_FT)/(2*DIST1); units are feet/sec2
DIST1 – Vehicle position at the time of pedestrian arrival in crosswalk influence area measured in feet using a LIDAR speed measurement device
D_WAIT – The duration of pedestrian waiting time at the decision point. The waiting
time is zero for all initial lag events. For all subsequent gaps, the waiting time is calculated from the duration between the initial arrival at the crosswalk and the passing of the previous vehicle in seconds.
E_GAP – Expected Gap Time between successive vehicle events at constant speed in
seconds
E_LAG – Expected Lag Time b/w ped. (t1) and time vehicle would have arrived at
constant speed in seconds
O_GAP – Observed Gap Time between successive vehicle events t3n and t3n+1 in
seconds
O_LAG – Observed Lag Time b/w ped. arrival (t1) and vehicle arrival at the crosswalk
SPEED_FT – Vehicle speed at the time of pedestrian arrival in crosswalk influence area measured in ft/sec using a LIDAR speed measurement device in feet per second
TTC – Time until vehicle would theoretically arrive at the crosswalk; TTC is calculated from the measured speed and distance at the time pedestrian arrives in the crosswalk influence area; TTC=DIST1/SPEED_FT; units are seconds Data Collection Terms
MB-CLT – Site code for data collection site: Mid-Block Crossing on Selwyn Avenue in
Charlotte, NC
MB-RAL: – Site code for data collection site: Mid-Block Crossing on Sullivan Drive in
Raleigh, NC
RBT-RAL – Site code for data collection site: Roundabout Crossing on Pullen Road in
Raleigh, NC
LIDAR – A speed measurement device that uses laser technology used in data collection
Analysis Terms
CG - Critical Gap (sec.), by definition the gap time at which a minor street vehicle or pedestrian is equally likely to accept or reject the gap.
DYM – Driver Yield Model. Probabilistic model describing the likelihood of a driver
yielding to pedestrians at the crosswalk.
Gap – The temporal duration between two successive vehicle arrivals at a given point of reference (front bumper to front bumper) measured in seconds
HCM – Highway Capacity Manual (TRB, 2000). A reference manual outlining traffic engineering operational analysis methodologies
Lag – The temporal duration between the pedestrian arrival at the crosswalk and the arrival of the first vehicle measured in seconds
LOGIT – Statistical model using logistic regression techniques to describe probabilities
MLE – Maximum Likelihood Estimation; a statistical methodology to estimate a model form or parameter distribution that maximizes the likelihood of observing the given sample of data points
MUTC – Manual of Uniform Traffic Control Devices (FHWA, 2002). A reference
manual for traffic engineers discussion guidelines for signs, marking and signalized traffic control.
PCM – Pedestrian Crossing Model. Probabilistic model describing the likelihood of a pedestrians accepting a gap or lag in the conflicting traffic stream
P(G) – The probability of a gap occurring in the traffic stream
P(GU) – The probability of a gap being utilized by the pedestrian
P(Y) – The probability of a driver yielding
P(YU) – The probability that a yield is utilized by the pedestrian
RR – Ramsey-Routledge Method; a statistical methodology to estimate a distribution of critical gaps or lags from a sample of data
deceleration rate to come to a stop before the crosswalk (DECEL) is greater than the assumed comfortable deceleration rate of 10 ft/sec2. A driver subject to VDC is considered unlikely to yield to a pedestrian.
Simulation Terms
PR – Abbreviation for “priority rules”, which is the model algorithm in the simulation model VISSIM used to describe gap acceptance and yielding behavior.
VISSIM – A microsimulation software package that models movements of individual
1
INTRODUCTION
The field of traffic engineering has traditionally focused on the operations of motorized modes of transportation. While the analysis of vehicular traffic is most common, an increasing number of engineering projects today are including accommodations for non-motorized road users. Many cities and smaller townships have drafted master plans for pedestrian and bicycle networks, including both non-motorized trails and facilities shared with motorized traffic. The growing emphasis on the pedestrian and bicycle modes demands proper methods of analysis to determine the operational levels of service for non-motorized transportation modes as well as their interaction with vehicular traffic.
One of the most challenging components in the analysis of pedestrian facilities is the assessment of a location where the pedestrian path crosses a roadway of motorized traffic. These pedestrian crosswalks may or may not be signalized, and pedestrian delay and safety at these locations are important measures to understand. Over the past decade, pedestrian research has focused on the evaluation of treatments for unsignalized crossing locations that are intended to make them safer for pedestrians. The evaluation of such pedestrian crossing treatments is typically carried out through empirical before and after studies that investigate aggregated measures of effectiveness. The effectiveness of a treatment is oftentimes quantified by a decrease in vehicle speed, an increase in yielding behavior, or a reduction of crashes following installation. Alternatively, researchers
sometimes use comparison sites to contrast driver and pedestrian behavior at, for instance, marked versus unmarked crosswalks (Zeeger et al, 2001). While these are adequate and statistically valid methods of analysis, their clear drawbacks are that evaluation is time-consuming and lacks microscopic detail. A macroscopic analysis of pedestrian
Significant work has also been done on alternatives to conventional signalized pedestrian crossings. Innovative signalization schemes for pedestrian mid-block and roundabout crossings have been applied in Europe and Australia (Inman and Davis, 2007), and more recently in the United States (Tucson DOT, 2007). The general objective of these new signalization strategies is to balance the crossing safety for pedestrians with the delay experienced by motorized traffic as a result of installing the signal.
Current traffic engineering analysis tools and capacity models are of limited use for evaluating the interaction of pedestrians and vehicles at unsignalized crossing facilities. Common analysis methodologies are limited to boundary cases, which assume strictly enforced right-of-way rules (TRB, 2000). The methods typically ignore the more complex interaction of the two modes in which some drivers yield to pedestrians and some pedestrians accept gaps in traffic. Thus, while the methods may be adequate for analyzing signalized pedestrian crossings, they do not offer a way of comparing the operations of signals to unsignalized control. A true comparison of the operational impact of different unsignalized treatments is also not possible in the current framework.
an increased yielding rate? In order to analyze the interaction of the pedestrian and vehicle modes it is important to gain better insight into both the yielding and the gap acceptance processes and to identify ways that these behavioral characteristics can be related back to a measurable effect on operations.
1.1
Motivation
An increasing number of cities and state agencies are placing high priority on providing adequate pedestrian facilities. Pedestrian facility improvement projects aim to create recreational pedestrian paths, to revitalize downtown areas, or to create safe walking routes to educational facilities. With increasing focus on these types of pedestrian
facilities, questions about pedestrian safety and the operational interaction of pedestrians and motorized traffic need to be addressed. Especially when these pedestrian facilities intersect with streets, engineers have to decide how to control the interaction of the pedestrian and vehicle modes at the crossing.
The research presented here is inspired by two ongoing research projects investigating crossing difficulties of pedestrians with vision impairments. The first, a Bioengineering Research Partnership sponsored by the National Eye Institute (NEI) of the National Institutes of Health (NIH) quantifies differences in crossing performance of blind and sighted pedestrians at roundabouts. The second, National Cooperative Highway Research Project (NCHRP) 3-78a, is aimed at identifying and evaluating treatment solutions that may help pedestrians with vision impairments cross at roundabouts and channelized turn lanes.
Especially the question of the accessibility of unsignalized roundabout crossings to blind pedestrians has triggered a lot of research in recent years. The associated US Access Board (2006) regulations oblige transportation facilities to conform to the Americans with Disabilities Act and require equal access for all pedestrians, including those with vision or mobility impairments regardless of the demand for crossing. More discussion on this issue will follow in later chapters.
But pedestrian safety concerns clearly extend to pedestrians without disabilities as well. The National Highway Traffic Safety Administration (NHTSA, 2006) lists a total of 4,784 pedestrian facilities in 2006 and 61,000 injuries in traffic collisions. The report further cites that the highest rate of pedestrian fatalities (almost 40%) occurred during the hours of 4pm and 8pm, suggesting a relationship between pedestrian safety and heavy PM peak hour traffic.
In a separate analysis of pedestrian and bicycle injuries based on hospital data, an FHWA Report (FHWA, 1999) found that 88% of the injuries from motor vehicle crashes
occurred on the roadway. Furthermore, 38.5% of motor vehicle roadway injuries were to children under the age of 14, indicating elevated risk for young pedestrians in roadway crashes.
In efforts to improve pedestrian safety at signalized and unsignalized crossings a range of treatments or countermeasures are available. A recent NCHRP report by Fitzpatrick et al (2006) presented a thorough overview of such pedestrian crossing treatments and in many ways provided practicing engineers with helpful advice on the selection and evaluation of treatments. The pedestrian countermeasure selection system PEDSAFE
observations to make inferences on treatment effect on yielding behavior. However, the data collection approach in many ways was of a macroscopic nature, aggregating the results at the site level.
With the availability of different pedestrian crossing treatments, there needs to be some basis for deciding upon their installation and for analyzing their impacts. A common approach is to determine whether a signalized pedestrian crossing is warranted. The pedestrian signal warrant in the Manual of Uniform Traffic Control Devices (MUTCD) (FHWA, 2002) warrants the installation of a pedestrian signal when both of the following conditions are met:
A. The pedestrian volume crossing the major street at an intersection or midblock location during an average day is 100 or more for each of any 4 hours or 190 or more during any 1 hour; and
B. There are fewer than 60 gaps per hour in the traffic stream of adequate length to allow pedestrians to cross during the same period when the pedestrian volume criterion is satisfied. Where there is a divided street having a median of sufficient width for pedestrians to wait, the requirement applies separately to each direction of vehicular traffic.
{SOURCE: MUTCD, 2003 Edition, Section 4C.05 Warrant 4, Pedestrian Volume}
In the MUTCD a pedestrian signal is warranted if both the pedestrian volume is high and the conflicting vehicle flow is high, making it difficult for pedestrians to cross at a facility.
pose safety concerns and may cause many pedestrians to avoid these types of facilities all together.
With a lack of guidance from the MUTCD, engineers may turn to the Highway Capacity Manual (HCM) (TRB, 2000) to make decisions on pedestrian treatment installations based on pedestrian delay estimation at an unsignalized pedestrian crossing. However, discussions in this document will show that the current delay calculation in the HCM effectively assumes one of two right-of-way regulations: either all drivers yield to pedestrians or none do. Clearly, both assumptions are inadequate in describing actual operations at many crosswalks and thus research insights into this problem are sorely needed.
In addition to signals, engineers and planners today have a whole range of pedestrian treatments to choose from that may or may not serve the need of a particular site. Oftentimes, unsignalized crossings can be enhanced by treatments geared at increasing driver yielding behavior, and thus forgoing signalization. Many of these treatments have been heavily researched and their effectiveness demonstrated through empirical before and after studies. Nonetheless, their true impacts on operations at a new site are difficult to predict using existing methods. Similarly, a true comparison between signalized and unsignalized operations is also challenging to conduct a priori.
The NCHRP 3-78a project places a strong emphasis on the use of microsimulation models for treatment evaluation. Motivated by the high cost of field data collection and associated risk to blind study participants, the project intends to use microsimulation to model the interaction of pedestrians and motorized traffic at signalized and unsignalized facilities. Working from calibrated base interaction models, the goal is to extrapolate treatment impacts to a wider range of geometric and operational situations.
It was through the involvement in NCHRP 3-78a that the author along with members of the research team developed the underlying concepts used in this dissertation. The planned application of microsimulation models requires that the aforementioned interaction models accurately reflect actual observations at crosswalks.
Of the few existing attempts to analyze yielding and gap acceptance through microscopic behavioral data (not through site-specific parameters), the work by Sun et al (2002) stands out. The authors investigated the use of logit and probit models to describe both components of pedestrian-vehicle interaction and demonstrated the feasibility of this approach through model validation. The authors used observational data from one crosswalk, but did not include any operational parameters in the analysis. Their work focused on binary variables such as gender and vehicle type. They did not investigate if the speed of a particular driver would allow him or her to come to a stop at the crosswalk, nor did the authors perform any evaluation of treatments.
In his doctoral dissertation, Chae (2006) performed an operational analysis of pedestrian-vehicle interaction at roundabouts using video image processing. Through sophisticated vehicle tracking technology, the author was able to obtain detailed time-sensitive data on speeds and time gaps of both modes. The author discussed a range of treatments that would affect the interaction, but did not offer any in-depth evaluation of treatment effects. Further, the Chae (2006) did not investigate midblock crossings and did not explore predictive models for behavior.
roundabouts (Schroeder, Rouphail and Hughes, 2008), and evaluating unsignalized pedestrian crossings in a microsimulation environment (Schroeder and Rouphail, 2007).
1.2
Contribution to Knowledge
This document builds on several of the cited research studies by evaluating the effect of treatments presented by Fitzpatrick et al (2006) and PEDSAFE using statistical modeling tools similar to the work by Sun et al (2002). The key difference is that the research in this dissertation considers operational variables as well as behavioral attributes. The modeling results can be implemented in microsimulation, much like the approach taken by Chae (2006). The research makes a contribution to the knowledge base in the field of traffic engineering in several ways:
• The research develops a data collection methodology for researchers that measures a range of discrete and continuous variables describing the interaction of pedestrians and drivers at unsignalized crosswalks. These variables describe the dynamic state of the vehicle, behavioral attributes of drivers and pedestrians, and the state of concurrent events with the interaction.
• The research adopts statistical methods to describe the probability of driver yielding and pedestrian crossing behavior from the data. The developed forecast models allow for a more realistic representation of pedestrian-vehicle interaction, overcoming the limitations of existing methodologies that only address the boundary cases of yielding behavior.
methods.
• The more realistic representation of unsignalized operations allows for contrasting those crossings with signalized crosswalks in a simulation environment. In current practice it is impossible to quantify the incremental impact of a pedestrian signal on vehicle or pedestrian operations, because the evaluation of the unsignalized baseline case is overly simplistic.
1.3
Research Objectives
This research seeks to develop an analysis methodology for pedestrian-vehicle interaction that is applicable for inclusion in a microsimulation environment. The specific objectives of this research are as follows:
1. Devise a data collection methodology to evaluate the interaction of pedestrians and drivers at unsignalized pedestrian crossings at a microscopic or event level. 2. Demonstrate that pedestrian crossing and driver yielding behavior is sensitive to:
o the dynamic characteristics of the approaching vehicle o behavioral characteristics of pedestrian and driver o concurrent events at the crosswalk
o the installation of crosswalk treatments
3. Describe driver yielding and pedestrian crossing behavior from collected event-based data accounting for attributes of vehicle dynamics, behavior and the effect of treatments
4. Demonstrate that driver yielding and pedestrian crossing models have application to microsimulation models where they can enhance existing interaction
1.4
Research Scope
The methodology presented in this document requires significant data to properly
calibrate the proposed behavioral parameters that describe pedestrian crossing and driver yielding behavior. The attributes for pedestrian and driver populations were collected at sites in Raleigh and Charlotte, NC at a sample size deemed sufficient for an illustration of the methodology.
Given the great variability of pedestrian and driver behavior, the results are clearly subject to a regional and site-specific bias and should not be generalized to other sites at this time. While the methodology is universal and thus transferable, the observed data are not. Any extension or application of this research to other sites and outside of the State of North Carolina should therefore include additional data collection and model validation efforts.
The analysis approach aimed to take full advantage of the amount of data used for model calibration. The results are contrasted with existing analysis methodologies for gap acceptance and yielding, but the models were not formerly validated with independent data not used in model development.
The data collection approach collects microscopic data on individual drivers and pedestrians, but does not track these entities in sub-second time intervals. Vehicle tracking has been demonstrated by others, but is beyond the scope of this effort.
necessary (e.g. speed distributions). Similarly, pedestrian travel patterns, interactions between multiple pedestrians, and walking speed effects are not explicitly analyzed.
1.5
Outline of Dissertation
This document is divided into three main parts. The first part provides an overview of the problem statement and outlines the research approach and analysis methodology. This chapter presented an introduction to the research and defined the objectives in the context of existing work. Chapter 2 presents the underlying analysis framework and discusses different types of pedestrian crossings and treatments. It further reviews the behavioral process of pedestrian crossing and driver yielding behavior and summarizes existing research on the subject matter. Chapter 3 lays out a data collection methodology
developed specifically for this research to obtain the necessary variables from the field. It also discusses ways of reducing and analyzing the data. Special emphasis is given on illustrating the basic concepts of logistic regression techniques.
The second part of the document presents the data and analysis results of actual field data collected for this dissertation. Data were collected at two mid-block crossing locations and one roundabout site. The data for the mid-block crossing included observations before and after the installation of two different pedestrian crossing treatments; an in-road pedestrian warning sign and an in-pavement pedestrian-actuated flashing beacon. Chapter 4 is devoted to the analysis of driver yielding behavior at the two mid-block sites and the impact of the treatments on driver behavior. Chapter 5 analyzes pedestrian crossing behavior for those same data sets and compares conventional gap acceptance analysis methods with the newly proposed logistic regression approach. Chapter 6 presents and analyzes both driver yielding and pedestrian crossing data for a single-lane roundabout crosswalk.
2
ANALYSIS FRAMEWORK
The analysis framework presented in this chapter rests on the assumption that driver and pedestrian behavior can be represented through a set of descriptive parameters, that these parameters can be calibrated from field data, and that they can be used as inputs in simulation models. It is further assumed that different treatments implicitly impact the behavioral parameters of drivers and pedestrians and that these impacts are observable in the field. The research premise is as follows: if both the behavioral base condition of pedestrian and driver behavior and the treatment effect are quantifiable and observable, the resulting operational effects extracted from microsimulation are meaningful
(assuming the simulation logic is valid).
The chapter presents an analysis framework for unsignalized pedestrian crossing
facilities. The underlying concepts for the framework were first presented at the Annual Meeting and Exhibit of the Transportation Research Board (Schroeder and Rouphail, 2007). The chapter discusses the components of the framework and how it relates to modern microsimulation tools. It also offers a discussion of data needs in preparation for discussing the data collection methodology in the next chapter. The chapter goes on to present a brief overview of different pedestrian crossing facilities and a summary of the types of pedestrian treatments and crossing facilities. It concludes with a detailed discussion and literature review of the two main components of pedestrian-vehicle interaction: pedestrian crossing behavior and driver yielding behavior.
2.1
A Framework for Evaluating Unsignalized Crossings
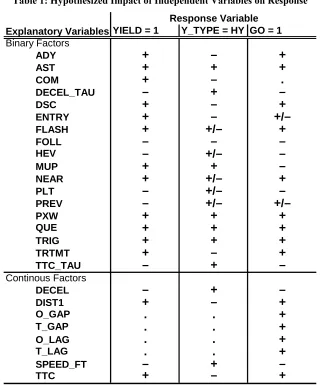
facilities and a comparison among the two in a microsimulation environment. A flowchart of the general analysis framework is provided in Figure 1.
Site Characteristics - Geometry - Volumes Traffic Control Conventional Signal - Timing - Compliance 'Hybrid' Signal - Timing - Compliance - Behavior Unsignalized Signalized
Base Condition 'Zebra'
- P(Y) - P(YU) - P(G) - P(GU)
Increase Visibility
- Increase P(Y) - Increase P(YU)? - Increase P(GU)?
Crossing Treatment
Force Behavior Change
- Increase P(Y) - Increase P(GU)?
Assist Blind Ped.
- Increase P(Y) - Increase P(YU) - Increase P(GU)
Field Data Collection
- Behavioral Characteristics - Impact of Treatments
Logistics Regression
- Estimate Model Parameters - Input in Simulation
Set-Up Simulation Model
- Car Following - Random Arrivals - Priority Rules - Evaluation
Calibration & Validation Select Performance Measures Compare Treatment Scenarios
Run Sensitivity Analysis
DECISION SUPPORT FOR TREATMENT INSTALLATION
Reportable, Quantifiable Impact of Treatment on Selected Performance Measures
Figure 1: Analysis Framework Flowchart
The analysis methodology relies on site-specific characteristics of the crosswalk. It assumes that geometric information and traffic and pedestrian volumes are available from field visits, design drawings or forecasts. It is further assumed that the analyst is aware of the existing or proposed type of traffic control (signalized or un-signalized).
For signalized crossings a conventional signal can be described from signal timing parameters and associated analysis methodologies. Concerns about pedestrian and driver compliance to the signal indication are valid and have been explored by others (Tiwari et al., 2007). However, the analysis of these behaviors is beyond the scope of this research. The same is true for behavioral characteristics at hybrid signals including the HAWK signal (Tucson DOT, 2007 and Schroeder, Rouphail, and Hughes, 2008) and strategies such as the “Pelican” or “Toucan” signals used in Europe and Australia (Inman and Davis, 2007).
The emphasis of this dissertation is on unsignalized crossing facilities, because signalized crossings are more clearly defined in existing analysis methodologies (TRB, 2000). For a representative analysis of signalized pedestrian crossing alternatives in microsimulation, the reader is referred to Schroeder, Rouphail and Hughes (2008). That work compared the use of both conventional pedestrian-actuated signals and innovative HAWK signals at single-lane and two-lane roundabouts. It demonstrated the potential of microsimulation to evaluate signalized crossing treatments over a range of volume levels and further
compared innovative and new signalization strategies prior to field implementation.
For unsignalized crossings, the author proposed a framework for evaluating the
traffic that should be included in a microscopic simulation analysis of unsignalized pedestrian crossing facilities.
Specifically, the interaction is characterized by four interaction processes that can be expressed in the form of probabilities:
P(G) - The probability of a gap occurring in the traffic stream P(GU) - The probability of a gap being utilized by the pedestrian P(Y) - The probability of a driver yielding
P(YU) - The probability that a yield is utilized by the pedestrian
The probability of gap occurrence, P(G), is a function of vehicle arrivals and the headway distribution in the traffic stream. The behavioral characteristics of pedestrians and drivers are generally described by the probability of crossing in a gap, P(GU), and the probability of a driver yielding to a waiting pedestrian, P(Y). The fourth parameter typically applies only to pedestrians with vision impairments or other special populations who tend to reject or miss a portion of the encountered yields. For the population of pedestrians observed in this research, the yield utilization rate, P(YU), is 100%.
Modern microsimulation models simulate the movements of individual vehicles and pedestrians based on algorithms for car-following, lane-changing behavior and others. The models generally allow the user to simulate speed and headway distributions as random parameters and to define priority rules (PTV, 2005) to represent unsignalized points of interaction. By adopting the model algorithms to match findings from this research, microsimulation can be a viable tool for analyzing the interaction of the pedestrian and vehicle modes.
Microsimulation models minimize data collection costs compared to field evaluation and, in the case of pedestrian research, offer the potential for non-intrusive treatment
evaluation, minimizing the risk to study participants. Through the analysis framework presented above, they allow the evaluation of proposed pedestrian treatments prior to installation at a new location. With proper calibration of models, simulation tools have a wide range of applications and have been used for example to model pedestrian-vehicle interaction at roundabouts (Chae, 2006).
Additional discussion on the modeling of pedestrians in microsimulation and the implementation of this research in microsimulation is provided in Chapter 7.
With models in place to describe pedestrian and driver behavior and to quantify treatment impacts, microsimulation models can be coded and calibrated from site-specific
interaction parameters.
2.2
Pedestrian Crossing Facilities
crossings at channelized right-turn lanes, mid-block pedestrian crossings, and crossings at the approaches to a modern roundabout.
2.2.1 Channelized Right-Turn Lanes
Channelized right-turn lanes (CTL) are commonly found at signalized intersections to create additional capacity for heavy right-turning traffic. These single-lane bypass lanes are typically free-flowing with a yield-controlled merge into downstream traffic and may be outfitted with an acceleration and/or a deceleration lane. A pedestrian crossing at the main signalized intersection inevitably requires the pedestrian movement to also cross these CTLs, which is most commonly done at an unsignalized zebra-striped crosswalk in the center of the turn lane. For a detailed discussion on CTL geometry and alternative placement for the pedestrian crosswalk refer to NCHRP Report 279 (TRB, 1985) and the NCHRP 3-72 project (TRB, 2003). While not discussed in detail in this document, a previously published paper (Schroeder, Rouphail and Wall Emerson, 2006) presents a detailed analysis comparing the crossing abilities of blind and sighted travelers at these types of facilities.
2.2.2 Mid-Block Crossings
2.2.3 Roundabout Crossings
Pedestrian crossings are also found at modern roundabouts, which are becoming an increasingly popular traffic control feature in the US. A long-term staple in Europe and Australia, an online database (Kittelson Associates, 2007) now lists more than 1,000 roundabout intersections across the United States, justifying their inclusion in this discussion. The pedestrian crossing at modern roundabouts is typically a two-stage crossing with pedestrians being able to find refuge on the splitter island as shown in Figure 2. The pedestrian crossing location is also designed to allow storage for one or more vehicles waiting to enter the roundabout downstream of the crosswalk.
Figure 2: Roundabout Pedestrian Crossing
For the purpose of discussion it is assumed that the base condition for pedestrian
crossings at any of the three types of locations is a zebra-striped unsignalized crosswalk. At these types of crossings, legislation typically gives pedestrians in the crosswalk the right-of-way, but as later discussion shows, motorist compliance varies. To further enhance the crossing and to make it safer for pedestrians, there are several categories of pedestrian crossing treatments that aim to facilitate pedestrian crossings.
2.3
The Range of Pedestrian Treatments
A great variety of treatments are available to help traffic engineers and planners improve pedestrian facilities and to provide safe crossing opportunities for pedestrians. The PEDSAFE pedestrian countermeasure selection system is available online
(www.walkinginfo.org) and lists 49 different treatments ranging from engineering solutions to education and enforcement methods. Similarly, a recent NCHRP report on “Improving Pedestrian Safety at Unsignalized Intersections” (Fitzpatrick et al, 2006) discusses a range of treatments and research findings on their safety performance.
Countermeasure selection tools such as PEDSAFE are intended to help practitioners distinguish between different treatments and make informed decisions on how to improve pedestrian facilities. Several state DOTs have developed their own decision tools or treatment matrices to support decisions. A great number of treatments have been evaluated as to their effectiveness in reducing pedestrian collisions, or in increasing the likelihood of yielding drivers. This document divides pedestrian treatments into four broad categories based on their intended functionalities:
2. Treatments that are forcing a behavior change in drivers, such as a raised crosswalk or chicanes geared at reducing driver speeds and creating a safer crossing environment
3. Treatments that are interrupting traffic flow, which includes conventional pedestrian signals and some innovative modifications of the signal phasing scheme, and
4. Special treatments intended to help blind pedestrians. This last category includes treatments aimed at improving gap and yield detection of blind pedestrians at unsignalized crossings.
Multiple treatments from the same or from different categories are oftentimes combined to either enhance the intended effect or supplement it. For example, the effect of a static sign could be enhanced by adding a pedestrian-actuated flashing beacon and could be supplement by additionally installing speed humps in the approach to the crosswalk. NCHRP report 562, cited above, supports this notion of a “systematic combination” (Fitzpatrick et al, 2006) of treatments to maximize the benefits to pedestrians.
2.3.1 Increasing Pedestrian Visibility
Treatments in this category have the general objective of increasing the awareness of drivers that are in the approach to a crosswalk. This category can be further divided into treatments that are a) static, b) animated, but non-responsive, and c) pedestrian-actuated.
a) Static treatments include conventional roadside signs and pavement marking delineating the crosswalk. This category also includes some innovative changes to conventional treatments, such as fluorescent green signs or colored pavement marking. A treatment with much promise that has been used in many
effective in increasing the yielding behavior of drivers (Fitzpatrick et al, 2006). All treatments in this group are fairly cost effective and easy to install.
Figure 3: In-Road Pedestrian Signs
(Source: http://mutcd.fhwa.dot.gov)
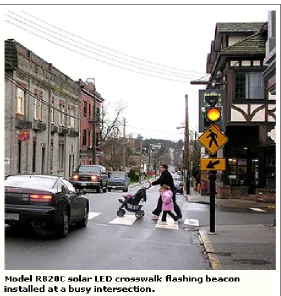
b) Animated (but non-responsive) treatments intend to increase a driver’s awareness by installing flashing beacons at the roadside, in the pavement or mounted
Figure 4: Roadside Pedestrian Flasher
(Source: www.walkinginfo.org/pedsafe)
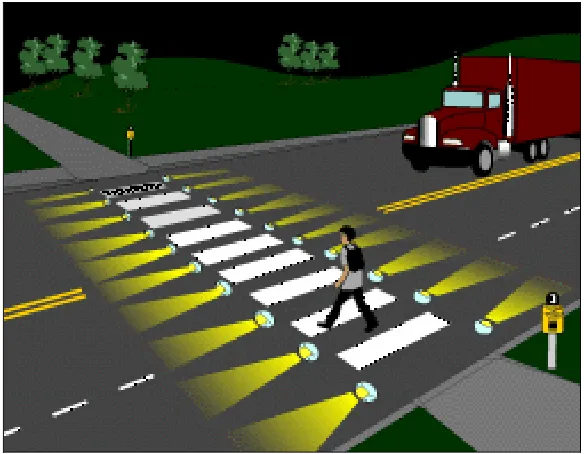
Figure 5: In-Pavement Flashing Crosswalk
(Source: www.walkinginfo.org)
The general objective of treatments in this category is to alert drivers of the presence of a pedestrian crosswalk. A by-product of increased driver attention in many cases is an increase in the yielding behavior of drivers. It is important to point out that this behavior change in drivers (more yielding) is voluntary, i.e. not enforced by physical modifications of the roadway or through legislation. The NCHRP report by Fitzpatrick et al. (2006) refers to this treatment category as “active when present” devices.
2.3.2 Forcing Behavior Change
Figure 6: Raised Crosswalk, Speed Humps and Chicanes
(Source: www.walkinginfo.org/pedsafe)
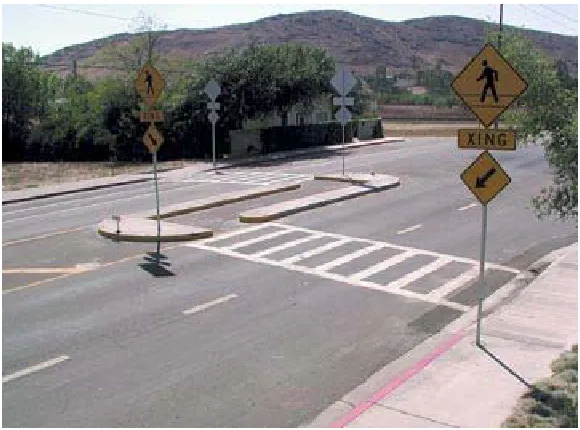
Figure 7: Offset Marked Crosswalk & Signing, Offset to the right
(Source: www.walkinginfo.org/pedsafe)
2.3.3 Interrupting Traffic Flow
The most high-tech and therefore most expensive treatments are pedestrian signals, designed to interrupt traffic to create safe crossing opportunities for pedestrians. Similar to pedestrian signals at signalized intersections, these treatments can be installed at a mid-block location or roundabout pedestrian crossing to stop vehicle traffic at the approach. Signals further have the advantage that they can be outfitted with audible pedestrian signals (APS) to create equal access for pedestrians with vision disabilities.
2.3.4 Assisting Blind Pedestrians
Specialized treatments under evaluation in the NCHRP 3-78a research effort aim to enhance the ability of blind pedestrians to make crossing decisions. The two broad categories here are treatments that enhance yield detection and those that target to
improve gap detection abilities of the pedestrians. These treatments are beyond the scope of this work and will therefore not be discussed further here.
2.4
Pedestrian-Vehicle Interaction
This section describes the behavioral components in the interaction of pedestrians and vehicles at unsignalized crosswalks: pedestrian gap acceptance and driver yielding behavior. The analysis of this interaction is complicated by the apparent lack of a clear understanding of right-of-way legislation. While many states have legislation in place requiring vehicles to yield to pedestrians in the crosswalk, field observations on busier streets make it evident that compliance varies. More commonly, drivers and pedestrians use methods of non-verbal communication to determine crossing priority. The
willingness of a driver to yield and the assertiveness with which a pedestrian seizes the crosswalk are two of many factors that may influence this interaction. Other factors may include the cross-section of the road, the type of crossing treatment or the general level of congestion at the crossing location. These behavioral processes are explored below.
2.4.1 Pedestrian Crossing Behavior
Overview of Gap Acceptance Models
Traditionally, literature on vehicle gap acceptance has used a constant value of critical gap (CG) that is calibrated for local conditions (Troutbeck and Brilon, 2002). It can differ depending on the type of movement and the type of vehicle. For example, the CG for left turns is likely to be larger than for right turns, and heavy vehicles tend to have longer CG because of slower acceleration profiles and longer vehicle lengths. In the following, this type of gap acceptance model will be referred to as the deterministic model.
By definition, the critical gap is the time between consecutive vehicles on the major road at which a vehicle waiting at the minor approach is equally likely to accept the gap or reject it. Literature on gap acceptance oftentimes assumes that drivers are both
homogeneous and consistent. In a homogeneous driver population, all drivers have the same critical gap. Under consistency assumption, the same gap acceptance situation will always cause a driver to make the same (consistent) decision. Although these
assumptions are not realistic, Troutbeck and Brilon (2002) justify their use because inconsistencies in driver behavior tend to increase capacity while a heterogeneous driver population will decrease capacity, thereby offsetting the previous effect.
The most common US application of deterministic gap acceptance is in the US Highway Capacity Manual (TRB, 2000). The Manual recommends using a constant critical gap from listed default parameters or locally estimating CGs from field conditions. It further recommends a reduction of its tabulated CG values for heavily populated regions (greater than 250,000), suggesting that drivers in those regions may be more likely to encounter frequent congestion and have thus lowered their CG threshold.
the minor street flow becomes a function of the CG on the minor approach tc, the
follow-up time on the minor approach tf, and the conflicting major street flow qp, as shown in
HCM2000 equation 17-70 adopted below:
Equation 1: HCM Capacity Equation for Two-Way Stop Controlled Intersection (17-70)
e
pe
f c pt q
t q p
q
Capacity −
−
− × × =
1 600 , 3
[vehicles/hour]
The follow-up time describes the time needed for additional vehicles in a stored queue to accept the same gap. The size of tf is typically less than tc, because some of the decision
and acceleration times for subsequent vehicles occur during the initial gap.
In addition to deterministic gap acceptance, a report compiled for the Federal Highway Administration (FHWA) Next Generation Microsimulation (NGSIM) research effort (Cambridge Systematics, 2004) discusses probabilistic gap acceptance models, for which the driver response for an identical event (same speed, same gap in conflicting traffic) can be drawn from a probabilistic distribution of possible responses. Such probit models assume a mean CG with a random variance term depending on the specific coefficients defined for a driver and/or situation. Conceptually, probit models could represent inconsistent driver behavior and a heterogeneous population by drawing gap acceptance decisions from random distributions.
Alternatively, probabilistic behavior can be modeled in the form of a binary or
multinomial logit model. A logit model could describe the likelihood of gap acceptance as a function of a number of different parameters (for example assertive vs. non-assertive pedestrians, gap time, and type of the arriving vehicle). It thus introduces greater
Cassidy (1995), and probit models were suggested by Mahmassani and Sheffi (1981) and Madanat (1994).
Some researchers have proposed even more complex algorithms for modeling gap acceptance. Kita (1993) used neural networks to describe the process, under the assumption that gap acceptance is not a linear sequence of events, but that multiple factors affect the decision making process. This modeling approach is capable of removing consistency assumptions, but the authors upheld the assumption of homogeneity.
Pedestrian Crossing Attributes
To assess pedestrian gap acceptance, the viewpoint needs to be shifted to the perspective of a pedestrian arriving at a crosswalk. The pedestrian population arriving at the
crosswalk needs to be treated very differently from a vehicle population. Blue and Adler (2001) pointed out that pedestrians are not officially channelized, can vary their speed, can occupy any part of the walkway, can bump into each other and have almost
instantaneous acceleration/deceleration profiles.
A number of researchers have attempted to predict pedestrian movement characteristics for a stream of pedestrians. The most promising research focuses on cellular automata modeling, which treats the pedestrian as an independent cell capable of movement in a defined number of directions. Research by Blue and Adler (2001) developed