http://www.ejfa.info/
PLANT SCIENCE
Evaluation of triticale genotypes for salt tolerance using physiological traits
Maryam Salehi and Ahmad Arzani*
Department of Agronomy and Plant Breeding, College of Agriculture, Isfahan University of Technology, Isfahan 8415683111, Iran
Abstract
Salinity is one of the major constraints to plant production worldwide. The effect of terminal salinity on the physiological traits of 18 triticale (X. triticosecale) lines comprising nine doubled haploid (DH) and nine
corresponding advanced lines (F8) and two bread wheat cultivars (control) was investigated under field
conditions. Salt-stressed experiment was irrigated using saline water with EC = 16 ds m-1 from mid-jointing growth stage (Zadoks 43) onward. Na+ concentration, K+/Na+ ratio, Ca2+/Na+ ratio, chlorophyll content,
carotenoids content, proline content and grain yield were assessed. A high correlation coefficient (r=0.84**) was obtained between K+/Na+ratio and grain yield under saline field conditions. The results also revealed an
inverse and significant relationship between grain yield loss due to salinity with K+/Na+ ratio, proline and
carotenoids content under saline stress provided evidence supporting the role of K+/Na+ ratio in salinity
tolerance. F8line number 6 possessed the highest values for carotenoids content, Ca2+/Na+ ratio and proline
content as well as the least Na+concentration under salt-stressed conditions, accompanied by having the least
grain yield loss due to salinity, was ranked this line as superior salt-tolerant genotype.
Key words: Physiological traits, Salt tolerance, X. triticosecale
Introduction
Salinity in soil or water is one of the major abiotic stresses, especially in arid and semi-arid regions, can severely limit plant growth and productivity. The increasing occurrence of dry periods in many regions of the world and the salinity problems associated with irrigated areas frequently lead to the consecutive incidence of drought and salinity on cultivated land (Islam et al., 2011).
Ion toxicity, osmotic stress and nutrient imbalance are the factors associated with the deleterious effect of salinity on plant growth and productivity. Therefore, understanding the salt tolerance mechanisms such as Na+ exclusion, K+/Na+ discrimination and osmotic adjustment is essential to improve salt tolerance in crop plants.
Low Na+ accumulation and high K+/Na+
discrimination have been found to be strongly
contribute to enhanced salinity tolerance in bread wheat (Santa-Maria and Epstein, 2001) and in durum wheat (Houshmand et al., 2005).
Osmotic adjustment is a fundamental adaptive response of plant cells to salinity, helping the maintenance of turgor under saline conditions (Serrano et al., 1999). The significance of proline accumulation in the osmotic adjustment has been extensively studied but, its role is still a matter of debate and varies according to the species. However, it has been postulated that proline acts as a compatible solute, an osmoprotectant, and a protective agent for cytosolic enzymes and cellular organelles (Bohnert et al., 1995). Proline has also been considered a carbon and nitrogen source for rapid recovery from stress and growth, a stabilizer for membranes and some macromolecules as well as a free radical scavenger (Jain et al., 2001).
Photosynthesis and photosynthesis-related parameters have been affected by salinity stress (Arzani, 2008). Carotenoids are lipid-soluble and non-enzymatic antioxidants produced by most photosynthetic organisms and belong to two classes of the carotens and xanthophylls. In plants, carotenoids act as light collectors shielding against photosensitization in the chloroplasts.
For a complex trait such as salinity tolerance Received 11 June 2013; Revised 18 September 2013; Accepted 09
October 2013; Published Online 20 October 2013 *Corresponding Author
Ahmad Arzani
Department of Agronomy and Plant Breeding, College of Agriculture, Isfahan University of Technology, Isfahan 8415683111, Iran
doubled haploid (DH) lines will be a significant advantage. This is the case for field grown plants for which genotype by environment interactions can be very large due to the heterogeneity in soil salinity (Arzani, 2008).
Triticale (X. Triticosecale Wittmack) is one of the most successful man-made cereal as it combines the unique grain quality of wheat (Triticum ssp.) with rye (Secale spp.) tolerance to harsh environment (Lelley, 2006). Triticale seems to be an interesting alternative to other cereals, particularly bread wheat, in environments where growing conditions are unfavorable or for in the low-input systems (Erekul and Kohn, 2006).
The objectives of this study were: (1) to evaluate salt tolerance of triticale DH and their corresponding F8lines as well as two bread wheat cultivars (Roshan and Kavir), using physiological traits, and (2) to determinate the associations of physiological traits with grain yield under salt stress conditions in triticale.
Materials and Methods
Plant materials and growth conditions
Two separate experiments were carried out under salt stressed and non-stressed conditions at a research farm of the Isfahan University of Technology, located at Lavark, Iran (40 km south west of Isfahan, 32˚32΄N, 51˚23΄ E, 1630 m asl), during the 2008-2009 growing season. The soil is silty clay loam, typic Haplargids of the arid tropic, with pH=7.3-7.8, EC=1-1.2 dS m-1 and contained
1.3% of organic matter. Mean annual precipitations and mean annual temperature were 140 mm and 15°C, respectively. Plant materials used in this study included 9 doubled haploid (DH) lines and 9 corresponding F8 lines of triticale derived from
Polony Q / TW179 cross (Arzani and Darvey, 2002) and two local bread wheat cultivars ('Roshan' and 'Kavir'). 'Roshan', as a drought tolerant, and 'Kavir' as a salt tolerant cultivars (Daei et al., 2009), were included as control. DH line number 3 was registered in Australia as the ‘Eleanor’ cultivar (Anon, 2001).
A randomized complete block design with three replications was used in each of the two experiments. Each plot consisted of four rows with 4 m long and 25cm apart spaced. At the salt stressed and non-stressed experiments, irrigated water with an EC of 1 dS m-1was used until
mid-jointing stage (43 growth stage of Zadoks scale), and afterward salt-stressed experiment was irrigated using saline water by dissolving salt in water (1% NaCl). The electrical conductivity (EC) of the irrigation water was nearly 16 dS m-1.
EC and the chemical properties at 30 cm depth of soil of saline and non-saline experiments were determined. Na+ concentration, K+/Na+ ratio,
Ca2+/Na+ ratio, the contents of photosynthetic
pigments [chlorophyll a+b (chl a+b), carotenoids
(xanthophylls and carotenes (x+c)], and the weight
ratio of chl a and b to total carotenoids (chl
(a+b)/(x+c))), proline and grain yield were
evaluated.
To measure the Na+, K+ and Ca2+
concentrations, plant samples were dried (75 ºC to constant mass) and weighted. leaf samples were ashed, at 550 ºC, for 3 h. Inorganic ions were then extracted with 10 ml 1 M H2SO4, and the volume of
each sample was standardized to 100 ml. Na+ and
K+ concentrations of the solutions were measured
using a 410-Corning flame photometer. Ca2+
concentration was estimated using a Perkin-Elmer, 2380 atomic absorption spectrophotometer.
To measure the photosynthetic pigments, 100
mg of tissue from 10 leaves obtained randomly from each plot was used.
Concentrations of leaf chlorophyll a (Chl a), chlorophyll b (Chl b) and total carotenoids(C x+c)
were spectrophotometrically determined, using the redetermined extinction coefficients and equations of Lichtenthaler and Buschman (2001) in 80 % acetone extract.
Free proline content was extracted from 0.5 g of leaf samples in 3% (w/v) aqueous sulphosalycylic acid and estimated using ninhydrin reagent according to the method of Bates et al. (1973).
Statistical analysis
The data from two experimental conditions (control and saline) were subjected to combined analysis of variance (ANOVA) using PROC GLM of SAS (SAS Institute, 1999). All the effects were considered random. Mean comparisons were conducted using the Fisher’s least significant difference (LSD0.05) test. Linear regression was
conducted to determine the relationship between physiological traits and grain yield with two experimental groups of saline and non-saline (control) field conditions.
Results and Discussion
A significant influence of salinity on the physiological traits with the exception of Ca2+/Na+
using one salt tolerance and one-drought tolerance wheat cultivars to compare with 18 triticale lines selected under normal growth conditions.
Na+ concentration increased in response to
salinity stress (Table 2). Increase of Na+
concentration in plant tissues is one of the primary plant responses to salinity stress (Meneguzzo et al., 2000). Under normal conditions, means of Na+
concentration ranged from 0.49 for F8 line number
1 to 1 for DH line number 6. DH line number 2 (2.69) and F8 line number 4 (1.14) exhibited the
highest and the lowest Na+ concentration under
salt-stressed experiment, respectively (Table 2). DH lines had higher Na+ concentration than F
8 lines
under both conditions. Na+ concentration had
negative and significant correlation with chl a+b(r
= -0.48*) and grain yield (r = -0.45*) and positive correlation with grain yield loss (r =0.48*) under salinity stress conditions. It is evident that salt tolerance is associated with low uptake of Na+
(Schachtman and Munns, 1992; Santa-Maria and Epstein, 2001), partial exclution (Colmer et al., 1995), its removal from the cytoplasm and compartmentalization into the vacuoles (Ashraf, 1994). Schachtman and Munns (1992) described the association of low shoot Na+concentration with
salt tolerance in wheat.
High K+/Na+discrimination was described as a
physiological index for salinity tolerance in wheat (Dvorak et al., 1994). Our results followed a similar trend which K+/Na+ ratio ranged from 1 for DH
line number 2 to 1.78 for F8 line number 4 under
non-stressed and from 0.22 for DH line number 3 to 0.8 for F8 line number 1 under salt stressed
experiment (Table 2). The leaf K+/Na+ ratio of
genotypes was significantly (P < 0.01) reduced as plants were subjected to salinity stress (Table 2). Decrease of K+/Na+ ratio in response to salinity
stress has been previously observed in bread (Dvorak et al., 1994) and durum wheat (Meneguzzo et al., 2000; Houshmand et al., 2005). Comparatively, in our study it was found that F8
lines had higher K+/Na+ratio than DH lines under
both growth conditions (Table 2). Due to the impact of K+concentration on reducing toxicity of Na+in
plants under salinity stress, the K+/Na+ ratio has
been proposed, as a saline tolerance indicator in wheat (Dvorak et al., 1994). Our data supported the positive role of potassium in salinity tolerance, observing a strong relationship between the leaf K+/Na+ ratio and the grain yield in triticale under
saline field conditions (Figure 1). A negative correlation coefficient was found between K+/Na+
ratio and grain yield loss due to salinity (r=-0.55*) providing, further evidence that supports the role of K+/Na+ratio in salt tolerance in triticale.
Ca2+/Na+ratio was not significantly affected by
the salinity in the tested genotypes (Table 1). According to Cachorro et al. (1994), a high Ca2+
concentration could decrease the Na+ toxicity.
Houshmand et al. (2005) reported that shoot Ca2+/Na+ ratio increased with increase in NaCl
concentration of the growth medium. Our data revealed significant differences between triticale lines and wheat cultivars for Ca2+/Na+ ratio with
triticale lines being significantly (P < 0.01) superior
under both conditions. F8 line number 4 and DH
line number 8 had the highest Ca2+/Na+ ratio and
grain yield under both growth conditions (Table 2, 3). Higher Ca2+/Na+ratio in these genotypes may be
accounted for the high grain yield of the F8 line
number 6 (Table 2, 3) that accompanied with the least grain yield loss. Accordingly, evidence was provided supporting the role of the Ca2+/Na+ ratio
in the salt tolerance mechanisms in triticale.
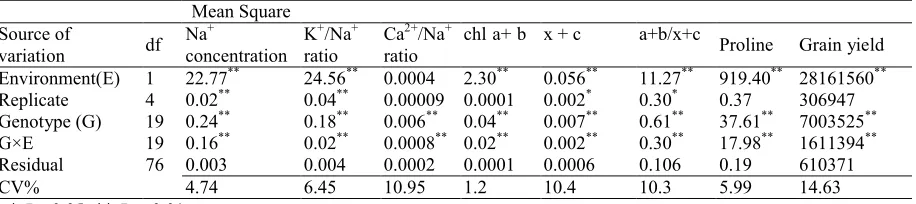
Table 1. Result of combined analysis of variance of the tested traits in triticale and wheat genotypes grown under salinity and normal field conditions.
Mean Square
Grain yield Proline
a+b/x+c x + c
chl a+ b Ca2+/Na+
ratio K+/Na+
ratio Na+
concentration df
Source of variation
28161560**
919.40**
11.27**
0.056**
2.30**
0.0004 24.56**
22.77**
1 Environment(E)
306947 0.37
0.30*
0.002*
0.0001 0.00009
0.04**
0.02**
4 Replicate
7003525**
37.61**
0.61**
0.007**
0.04**
0.006**
0.18**
0.24**
19 Genotype (G)
1611394**
17.98**
0.30**
0.002**
0.02**
0.0008**
0.02**
0.16**
19 G×E
610371 0.19
0.106 0.0006
0.0001 0.0002
0.004 0.003
76 Residual
14.63 5.99
10.3 10.4
1.2 10.95 6.45
4.74 CV%
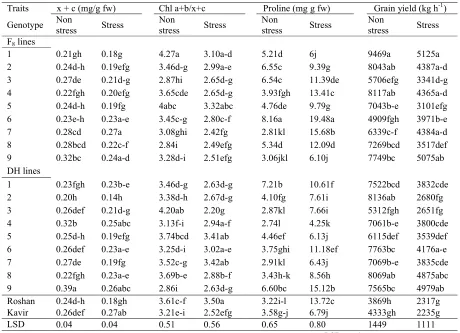
Table 2. Means of the Na+concentration, K+/Na+ratio, Ca2+/Na+ratio and chlorophyll a+b (chl a+ b) of triticale and
wheat genotypes grown under salinity stress and normal field conditions.
chl a+ b (mg/g fw) Ca2+/Na+ratio
K+/Na+ratio
Na+ Traits Stress Non stress Stress Non stress Stress Non stress Stress Non stress Genotype
F8lines
0.56hi 0.89g 0.11d-g 0.09fgh 0.8a 1.74ab 1.46hi 0.49i 1 0.56h 0.84ij 0.13cd 0.15bc 0.66cd 1.68a-d 1.36jk 0.58gh 2 0.54i 0.77n 0.07h 0.06i 0.43gh 1.16h 1.64ef 0.73cd 3 0.52j 0.82l 0.16ab 0.16abc 0.64cde 1.78a 1.14l 0.57ghi 4 0.63ef 0.96e 0.14bc 0.15bc 0.40gh 1.20h 1.29k 0.76bcd 5 0.64d 0.81l 0.18a 0.17ab 0.63de 1.48fg 1.17l 0.70cde 6 0.66c 0.84j 0.07h 0.09fgh 0.64cde 1.64bcd 1.79c 0.60gh 7 0.55hi 0.78mn 0.11d-g 0.10d-g 0.50fg 1.48fg 1.39ij 0.76bcd 8 0.59g 1.03c 0.11efg 0.11de 0.77ab 1.71abc 1.32jk 0.52hi 9 DH lines 0.60g 0.79m 0.12c-g 0.12d 0.60def 1.50efg 1.37ijk 0.73cd 1 0.38l 0.68o 0.14c 0.16bc 0.33h 1i 2.69a 0.78bc 2 0.46k 1.08b 0.10g 0.07hi 0.22i 1.13h 1.90b 0.84b 3 0.74a 0.99d 0.07h 0.11def 0.60def 1.42g 1.50gh 0.69de 4 0.66c 0.94f 0.1fg 0.14c 0.54ef 1.42g 1.60f 0.62efg 5 0.70b 0.85hi 0.10fg 0.16abc 0.63de 1.58def 1.65ef 1a 6 0.64de 0.95ef 0.11d-g 0.12d 0.60def 1.40g 1.77cd 0.68def 7 0.67c 0.82kl 0.18a 0.18a 0.67bcd 1.63bcd 1.16l 0.59gh 8 0.67c 1.09a 0.12c-f 0.09e-h 0.74abc 1.60cde 1.58fg 0.59gh 9 0.62f 0.86h 0.08h 0.08ghi 0.50fg 1.40g 1.70de 0.70cde Roshan 0.67c 0.83jk 0.13cde 0.10d-g 0.54ef 1.60de 1.48h 0.60gf Kavir 0.016 0.014 0.02 0.02 0.11 0.11 0.09 0.08 LSD
Means followed by the same letter within a column are not significantly different (LSD0.05).
Our data further revealed the significant influences of both salinity and genotype on photosynthesis related parameters (Table 1). Indeed, chl a+b and carotenoids content decreased
due to salinity stress (Table 2, 3). Chl a+b ranged
from 0.68 mg/gfw for DH line number 2, to 1.09
mg/ gfw for DH line number 9 under non-stressed
experiment, and from 0.38 mg/gfw for DH line
number 2 to 0.74 mg/gfw for DH line number 4
under salt-stressed experiment (Table 2). Carotenoids content ranged from 0.20 mg/gfw (DH
line number 2) to 0.39 mg/gfw(DH line number 9),
and 0.14 mg/gfw(DH line number 2) to 0.27 mg/gfw
(F8line number 7) for non-stressed and salt-stressed
environments, respectively (Table 3). Carotenoids displayed a positive and significant correlation with chla+b(r = 0.65**) under both growth conditions.
A negative and significant correlation coefficient was observed between grain yield loss and
carotenoids content (r = -0.54*) under salt stressed
conditions. Akbarian et al. (2011) observed a negative and significant correlation coefficient between grain yield loss and carotenoids content under field drought stress. Chl (a+b)/(x+c) ratio
ranged from 2.84 to 4.27 in non-stressed, and from 2.20 to 3.50 in salt stressed experiment (Table 3). The ratio of chl (a+b)/(x+c) of the genotypes were
3.45 and 2.84 in non-stressed and salt stressed environments, respectively. The weight ratio of chl (a+b)/(x+c) is an indicator of greenness
(Lichtenthaler and Buschman, 2001). Indeed, lower values for the ratio of chl (a+b)/(x+c) are an
indicator of senescence, stress, and damage to the plant and the photosynthetic apparatus, which is expressed by a faster breakdown of chlorophyll than carotenoids.
Table 3. Means of the chl a+b content, carotenoids content (x+c), proline content and grain yield of triticale and wheat genotypes grown under salinity stress and normal field conditions.
Grain yield (kg h-1)
Proline (mg g fw) Chl a+b/x+c
x + c (mg/g fw) Traits Stress Non stress Stress Non stress Stress Non stress Stress Non stress Genotype F8lines
5125a 9469a 6j 5.21d 3.10a-d 4.27a 0.18g 0.21gh 1 4387a-d 8043ab 9.39g 6.55c 2.99a-e 3.46d-g 0.19efg 0.24d-h 2 3341d-g 5706efg 11.39de 6.54c 2.65d-g 2.87hi 0.21d-g 0.27de 3 4365a-d 8117ab 13.41c 3.93fgh 2.65d-g 3.65cde 0.20efg 0.22fgh 4 3101efg 7043b-e 9.79g 4.76de 3.32abc 4abc 0.19fg 0.24d-h 5 3971b-e 4909fgh 19.48a 8.16a 2.80c-f 3.45c-g 0.23a-e 0.23e-h 6 4384a-d 6339c-f 15.68b 2.81kl 2.42fg 3.08ghi 0.27a 0.28cd 7 3517def 7269bcd 12.09d 5.34d 2.49efg 2.84i 0.22c-f 0.28bcd 8 5075ab 7749bc 6.10j 3.06jkl 2.51efg 3.28d-i 0.24a-d 0.32bc 9 DH lines 3832cde 7522bcd 10.61f 7.21b 2.63d-g 3.46d-g 0.23b-e 0.23fgh 1 2680fg 8136ab 7.61i 4.10fg 2.67d-g 3.38d-h 0.14h 0.20h 2 2651fg 5312fgh 7.66i 2.87kl 2.20g 4.20ab 0.21d-g 0.26def 3 3800cde 7061b-e 4.25k 2.74l 2.94a-f 3.13f-i 0.25abc 0.32b 4 3539def 6115def 6.13j 4.46ef 3.41ab 3.74bcd 0.19efg 0.25d-h 5 4176a-e 7763bc 11.18ef 3.75ghi 3.02a-e 3.25d-i 0.23a-e 0.26def 6 3835cde 7069b-e 6.43j 2.91kl 3.42ab 3.52c-g 0.19fg 0.27de 7 4875abc 8069ab 8.56h 3.43h-k 2.88b-f 3.69b-e 0.23a-e 0.22fgh 8 4979ab 7565bc 15.12b 6.60bc 2.63d-g 2.86i 0.26abc 0.39a 9 2317g 3869h 13.72c 3.22i-l 3.50a 3.61c-f 0.18gh 0.24d-h Roshan 2235g 4333gh 6.79j 3.58g-j 2.52efg 3.21e-i 0.27ab 0.26def Kavir 1111 1449 0.80 0.65 0.56 0.51 0.04 0.04 LSD
Free proline content of the leaves was significantly affected by genotype and salinity (Table 1). Salinity stress caused an increase in proline content of the genotypes (Table 3). Several plant species, including halophytes, accumulate high proline levels in response to the osmotic stress, as a tolerance mechanism to high salinity and water deficit (Delauney and Verma, 1993). F8 lines had
higher proline content than DH lines under both growth conditions (Table 3). High level of proline enables a plant to maintain low water potential and, thus, buffering the immediate effect of water storages within the organism. There was a negative correlation between grain yield loss due to salinity and proline content under salt-stressed conditions (r= -0.55*). Grain yield of the genotypes was
significantly reduced by salinity stress (Table 3). Under salt stress conditions, the F8 line number 1,
2, 4, 7, 9, DH line number 6, 8 and 9 produced higher grain yield and ranked as the superior genotypes. F8 line number 1, 2, 4 and DH line
number 8 were superior under both environmental conditions, if the grain yield is considered. However, the latter group has usually been preferred because they characterized the breeding potential of high yield stability.
Conclusions
In this study, three variables salinity stress, plant species and genotypes within species were hypothesized to affect physiological traits and grain yield and have been empirically substantiated. The strong relationship between the leaf K+/Na+ ratio
and the grain yield production under saline field conditions implies the key role of the ionic mechanism, which effectively discriminate between potassium and sodium ions in triticale. On the other hand, the non-association between Ca2+/Na+ ratio
and salinity tolerance in our study may display a lower turn-over of calcium than potassium in the ionic balance. The comparable performance of triticale lines non-deliberately selected triticale line with that of wheat cultivars, either selected for salinity tolerance or drought tolerance, further underlies the adaptability of triticale to saline environment as well as the possibility of improving salinity tolerance in triticale to tolerate a higher level of salinity.
References
Akbarian, A., A. Arzani, M. Salehi and M. Salehi. 2011. Evaluation of triticale genotypes for terminal drought tolerance using physiological traits. Indian J. Agric. Sci. 81:1110-1115.
Anon. 2001. Plant Varieties J. 14 (1):15.
Arzani, A. 2008. Improving salinity tolerance in crop plants: A biotechnological view. In Vitro Cell Dev. Biol. Plant 44:373-383.
Arzani A. and N. L. Darvey. 2002. Comparison of doubled haploid lines and their mid-generation progenitors in forage and dual-purpose triticales under greenhouse hydroponic conditions. Euphytica 126:219-225.
Ashraf, M. 1994. Breeding for salinity tolerance in plant. Crit. Rev. Plant Sci. 13:17-42.
Bates, L. S., R. P. Waldren and L. D. Teare. 1973. Rapid determination of free proline for waret-stress studies. Plant Soil 39:205–207.
Bohnert, H. J., D. E. Nelson and R. G. Jensen. 1995. Adaptation to environmental stresses. Plant Cell 7:1099–1111.
Cachorro, P., A. Ortiz and A. Cerda. 1994. Implications of calcium nutrition on the response of Phaseolus vulgaris L. to salinity.
Plant Soil 159:205-221.
Colmer, T. D., E. Epstein and J. Dvorak. 1995. Differential solute regulation in leaf blades of various ages in salt sensitive wheat and salt tolerant wheat × Lophopyrum elongatum
(Host) love amphiploid. Plant Physiol. 108:1715-1724.
Daei, G., M. Ardakani, F. Rejali, S. Teimuri and M. Miransari. 2009. Alleviation of salinity stress on wheat yield, yield components, and nutrient uptake using arbuscular mycorrhizal fungi under field conditions. J Plant Physiol.
166:617-625
Delauney, A. J. and D. P. S. Verma. 1993. Proline biosynthesis and osmoregulation in plants. Plant J.4:215–223.
Dvorak, J., M. M. Noaman, S. Goyal and J. Gorham. 1994. Enhancement of the salt tolerance of triticum turgidum L. by the knal
locus transferred from the Triticum aestivum
L. chromosome 4D by homeologous recombination. Theor. Appl. Genet. 87:872-877.
Erekul, O. and W. Kohn. 2006. Effect of weather and soil conditions on yield components and bread-making quality of winter wheat (Triticum aestivumL.) and winter triticale (X.
North-East Germany. J. Agron. Crop Sci. 192:452-464
Houshmand, S., A. Arzani, S. A. M. Maibody and M. Feizi. 2005. Evaluation of salt-tolerant genotypes of durum wheat derived from in vitro and field experiment. Field Crops Res. 91:345-354.
Islam M. R., M. A. Salam, L. Hassan, B. C. Y. Collard, R. K. Singh, and G. B. Gregorio. 2011. QTL mapping for salinity tolerance at seedling stage in rice. Emir. J. Food. Agric. 23:137-146.
Jain, M., G. Mathur, S. Koul and N. B. Sarin. 2001. Ameliorative effects of proline on salt stress-induced lipid peroxidation in cell lines of groundnut (Arachis hypogea L.). Plant Cell
Rep. 20:463–468.
Lelley, T. 2006. Triticale: A low-input cereal with untapped potential, In: R. J. Singh and P. P. Jauhar (Eds.), pp. 395-430. Genetic Resources Chromosome Engineering and Crop Improvement. CRC Press, Taylor & Francis Group: Boca Raton, FL.
Lichtenthaler, H. K. and C. Buschman. 2001. Chlorophylls and carotenoids: Measurement and characterization by UV-VIS spectroscopy.
In: Current Protocols in Food Analytical Chemistry, John Wiley and Sons, New York, pp. F4.3.1–F4.3.8.
Meneguzzo, S., F. Navari-Izzo and R. Izzo. 2000. NaCl effects on water relations and accumulation of mineral nutrients in shoots, roots and cell sap of wheat seedling. J. Plant Physiol. 156:711-716.
Santa-Maria, G. E. and E. Epstein. 2001. Potassium/sodium selectivity in wheat and amphiploid cross wheat × Lophopyrum elongatum. Plant Sci.160:523-534.
SAS Institute. 1999. SAS/STAT User’s Guide. SAS Institute, Inc., Cary.
Serrano, R., J. M. Mulet, G. Rios, J. A. Marquez, I. F. Larrinoa, M. P. Leube, I. Mendizabal, A. Pascual-Ahuir, M. Proft, R. Ros and C. Montesinos. 1999. A glimpse of the mechanisms of ion homeostasis during salt stress. J. Exp. Bot. 50:1023–1036.
Schachtman, D. P. and R. Munns. 1992. Sodium accumulation in leaves of Triticum species