Integrating Intrusion Detection Model Using
Ensemble of Classifiers and Extreme Learning
Machine
Rayees Ahmad Sheikh1, Abid Ud Din Wani2, Abhishek Bhardwaj3
1Research Scholar, CT Institute of Engineering Management and Technology Jalandhar, Punjab, India 2Research Scholar, CT Institute of Engineering Management and Technology, Jalandhar, Punjab, India 3Assistant Professor Dept. Of CSE/IT, CT Institute of Engineering Management and Technology Jalandhar,
Punjab India
E-mail ID:[email protected], [email protected]
---ABSTRACT
---The Intrusion detection from the last some decades are very important for current as well as for present networks. In the recent times many new methods have been used for IDS with machine learning technique and analysis for huge data is very much suitable. But the techniques like WMV (weighted majority voting) which have large dataset will take much more amount of time with this there is degradation of results whenever increasing the dataset. For this problem this paper focuses on the Extreme learning machine would be the best suitable for IDS with the analysis of big data and improving the accuracy. The proposed technique will integrate Mutual information ranking filter and attribute ranking feature selection with ELM technique. The Mutual information technique will implement attribute selection and will analyse proposed technique performance MI-ELM technique with algorithms like Modified Naïve Bayes, Support vector machine, LP Boosting and also hybrid of these three algorithms with respect to Precision, Recall. F-measure, accuracy, the (KS) Kappa statistic, Incorrectly and Correctly (CI) classified instances, RMSE (Root of Mean square erratum or error) and RRE (Root relative of error). There will be analysis of the dataset on according to basis of traffic is it normal or abnormal and the experimental results has shown that there will be increased accuracy in comparison with the classifiers.
Key words- Intrusion detection, Mutual information, Extreme Learning machine, Group of classifiers.
--- --- Date of Submission: Sep 18, 2019 Date of Acceptance: Oct 05, 2019 --- ---
1.
INTRODUCTION
I
ntrusion are in brief intruders that violate the rules and regulations of the systems and networks to teal confidential information. Intrusions enter systems with the motives to copying files and running duplicate software and also defacement on the servers took place. There are two types Host IDs and NIDs. The Intrusion detection can glance the systems and if something suspicious happens the prompt will be given and very well monitored. Host-based is first type as well as first layer of IDS and each individual system had one IDS. The second layer is Network IDS and it very much easy to deploy and one IDS will be used at a time with many systems. Intrusion detection has been mainly classified into two optimal categories. Misuse/signature is technique in which specific rules have been defined and according to that rules suspicious activities have been detected very well but only those which are familiar. The Anamoly has capability with better rules it can detect both known and unfamiliar. The Mutual information is actually amount of the information sending and received. It contained the conditional probability with symmetric properties and the positive values means non-negative. They are expressed to entropies and joint entropies. It is actually the proposed technique combining with the extreme learning machine and whichis a new data driven tool also, an innovative idea of neural network uses a state of feed forward single/multiple network algorithm to provide very near solution. Some particular type of problems has been solving and it is machine learning setup and had multiple and single layers.
2.
Background Details:
Thaseen et al. [1] have proposed Chi- Square feature selection which reduces the dimensionality of the specific attributes. Their aim was to find the main critical features as well as better accuracy for the Intrusion detection model. In this they have used Majority voting technique in which it notices the votes of each and every classifier like election protocol. The classifier which gives more votes in comparison with the other classifiers has been selected. The classifier (MNB), (SVM) and LP Boosting used for building the optimal Intrusion detection. The dataset performance well analysed and new description of benchmark DARPA Intrusion detection. It shows good generalisation and improved accuracy i.e.,
Kausar et al. [2] have suggested principal component analysis- based mechanism (PCA) for the SVM intrusion detection system. In present performance factor and training overhead are the drawbacks of several Intrusion detection. The very much increased efficiency and the reduce very less false prompts with the maximising diagnosis rate. Main limitation in processing of the raw features of classifiers is much increasing complexity aritecture with accuracy reduce when detection increase. The processing of classifier overhead is a problem and for this motive have been use PCA. It can transform attributes into big dimension space and old minimising method by abstract several groups from attribute vector computing by the PCA. Now, these subsets separately train as well as test system through related resources and manipulate sensitivity. There is a lot of work shows maximising accuracy. Dhanabal et al. [3] have proposed the special Classification algorithm with the better evaluation of the data set. Basically, it is refined version of data set is KDD’99 (NSL-KDD) its predecessor dataset. The analysis of NSL-KDD dataset classification algorithms has the plenty of effectiveness and the study in network diagnosis anomalies. Therefore, the analysed relationship of protocols in network traffic are available patterned. Data mining classification algorithm are through the WEKA tool. The data set NSL-KDD of the analysis result best applicant data set to test feature IDS performance. Furthermore, CFS increases accuracy and the dimensionality minimizes as well as reduce the detection. Akashdeep et al. [4] have suggested intelligent system intrusion detection system which have potential to perform correlation and the information gain to perform well feature ranking firstly. So, to recognise the useless and useful attributes by using the Novel approach. The feedforward networks reduced the attributes of the networks for the testing on the KDD 99 dataset. Several instances of training before the preprocessing and then normalise the data. And the intelligently system behaves the categories into normal and attack classes. Their aim was that the attributes reduction system like in normal system to perform in same degree. They have tested five types of dataset so all average and unique results of data sates are reported. Zainal et al. [5] have proposed the ensemble in which sorting of the unique classes in which everyone have a learning model. The methods in this structure are LGP, Adaptive neural, ANFI and Random forest, integrating of many learning models shows increasing in diagnosis on the network traffic for accuracy. The limitation of this paper was many classification trees gather and results on unique address was capable to variance dataset with which machine knowledge method will unsuccessful to address it. Zhang et al. [6] have proposed that the well-structured of the Hybrid system which actually overcomes the drawbacks of more wrong positive rate in anomaly detection and cannot detect the unknown intrusions by misuse. The Random forest algorithm in both cases misuse and anomaly where been integrated. Their proposed result showed increased detection on NIDS with great performance on misuse and anomaly
detection usage. Pietraszek et al. [7] have suggested two best optimal approaches of complementary and the orthogonal to minimize several wrong positives by with alert process Intrusion detection in machine learning and also in the data mining. The alert system and these both methods work together. In real and the simulated environment wrong positive have been very minimized. Mukherjee et al. [8] have suggested that the method for attribute reduction vitality based to recognise the essential input reduction attributes. In their work, they have used Naïve Bayes classifier and it is efficient dataset minimization for Intrusion detection. The minimized features of empirical results give performance to IDS as well as effective for network IDS. Panda et al. [9] have proposed that the Intrusion detection in anomaly based was given naïve Bayes for data mining algorithm is very much efficient. The experimental results show detection increases on network. They have shown wrong positives, computation time and cost better performances when compared with the neural network back propagation. Daejoon et al [10] have proposed that the neural network with cost ratio of wrong positive as well as wrong false errors. The neural network in first step develops and in second phase performance will be analysed, errors of asymmetric costs. In the experimental result of IDS network shows performance by higher accuracy.
3.
COMPARATIVE ANALYSIS:
Research scholars and professionals have used many techniques and methods In the Intrusion detection modelsTable I Comparative analysis
S. No
Context of research
Techniques used
Problem Discussed
Advantages Authors
1 Characteristics attributes for attack
and normal traffic
Weighted majority
voting technique
Combining several techniques with
this detection reduces
Maximising accuracy when integrate with
several classifiers. Thaseen et al.
2 Having possible feature reduction with maximum
accuracy
(PCA) Principal Component
Analysis
Accurateness of attack detection
performance increase when the attributes
decrease Kausar et al.
3 Integrity of
algorithms Classification Specific algorithm
Network traffic generate by
attacks
Refining strengthen
Dhanabal et al.
4 Characteristics identified worthy
and motive less
Intrusion detection system New
intelligent
Complication and accumulation
intensity
Efficiently System operates
Akashdeep et al.
5 Sorting and grouping in learning model
ANFIS, RF and LGP
False prompts and
unsuccessful for results to address
Increasing in detection for
accuracy Zainal
et al.
6 Integrating and framework of
organisation
Random forest
Cannot detect unknown
attacks
Maximising detection on
NIDS
7 The complementary as well as orthogonal
approach
ID in Data mining and machine learning. Beneficial reduction in simulated and real environment false positives have been reduced Pietraszek et al.
8 Statistically ID systematized attribute Reduction and Naïve Bayes well-planned reduction Exactness optimal Mukherjee et al
9 Neural network comparison Data mining algorithms Several attacks discussed
Better detection and will take time less
Panda et al.
10 Performances of the neural networks
developed
accuracy shown in Intrusion detection Minimization of the errors Structure establish to achieve great accuracy
Daejoon et al
4.
Research Methodology
4.1 Dataset assemblage: The data set is very large and we have taken only 10% of the data because otherwise it will become complicated. The data which we have taken is a very famous dataset in which there are both attack as well as the simple normal traffic. The dataset 4900000 in the KDD- CUP99 as vector connection. In the data mining we have available KDD data set and make traffic analysis on basis of traffic is it normal or abnormal. On line there are more available datasets and some does not filter because they are error free.
4.2 For Preprocessing: This is the process of filtering and Preprocessing in this either missing values have been removed in a good way. If there is bulky data have attacks like denial of service then it needs to first normalise the data also randomize the data. Lastly, there will be removal of noise in the preprocessing phase.
Conversion: There will transformation of data because data should be changed into numerical value from the categorial value.
Normalisation: It acts like a scale and also used for
removing of errors.
Attribute predilection: For accuracy of all the attributes are basically not relevant to each other for this model. In this all the irrelevant and the redundant dataset are removed. For all the relevant attributes
filter have been used for to identify features.
4.3 (MI) Mutual Information attribute Selection: The random variable of mutual dependence or relation with one another have been determined by this technique of mutual information. The feature entropy has the very well relationship with the mutual information. The uncertainty of random variable is measured by the entropy.
4.4 ELM Classification: The data goes in layers for the series of neural network of a feedforward network. Single/multiple of layers are setup of the machine learning algorithm and also, they are specific. The ELM
Fig1: Proposed IDS 4.5. Proposed Model: The suggested model has combined the Intrusion detection system with Mutual information as the attribute selection (feature) technique. The dataset has been collected from the online sources it was huge amount of data in dataset only 10% data has been taken into consideration with this providing better results. The preprocessing technique used for the removing noise and filter the data also can remove missing values. If the dataset will be clear don’t have errors then then we don’t need filtering. The data set contained 42 attributes it is very much data. The technique MI will make ranking of the attributes and we are choosing top 15 attributes. Class is known for the training set in data mining future can predict only the basis of previous data (original data). Extreme learning machine algorithm can classify the original dataset on traffic related normal or abnormal and training time algorithm can predict ELM actual value and predict value. The comparison taking place on matching between the two through accuracy. In our proposed model we have used the technique MI-ELM with the many classifiers like SVM, modified naïve Bayes, LP Boosting and Hybrid existing technique. The proposed technique shows increased accuracy with the existing classifiers.
5.1 Experimental Result: There are different types of parameters as taken under observation are as accuracy, correctly (C.I) classified instances, incorrectly (C.I) classified instances, the kappa integer statistic, precision, recall, F-measure, root mean square error and relative root error with classifiers of Support vector machine, Modified Naïve Bayes, Boosting, Hybrid and proposed MI-ELM.
5.2 Illustration Evaluation: There are several parameters used for description estimation. Confusion matrices in which values are predict through an algorithm and other one is actual values. The results are analyzed and there are total 1260 instances in this dataset.
5.3 Implementation MI-ELM:
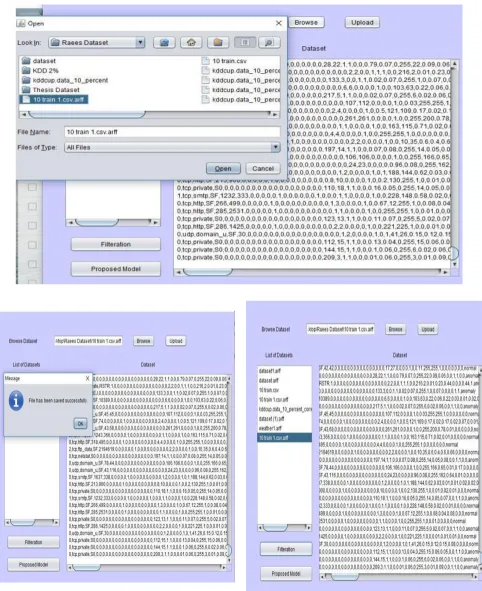
Fig 4.1 Snapshot of Selecting the dataset
Fig 4.2 Snapshot Data is uploaded and the file has been saved successfully
Fig 4.4 Snapshot of the Feature ranking using proposed Mutual information feature selection technique
Fig 4.5 Results of SVM base technique
Fig 4.6 Results of naïve Bayes base technique
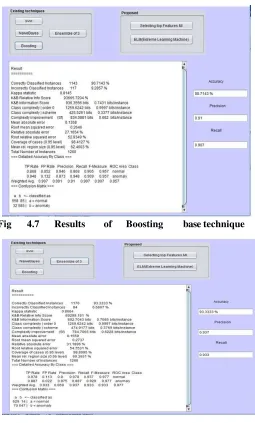
Fig 4.7 Results of Boosting base technique
Fig 4.8 Hybrid technique results
f) False Positive Rate:
𝐹𝑝
FPR=
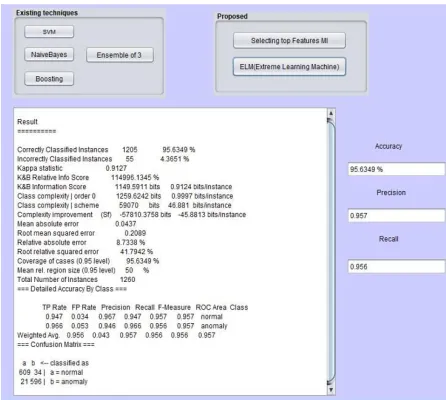
Fig 4.10 The Proposed ELM technique results 5.4 Results: The analysis will be making of attributes with ranking of the feature optimisation or direct classification. There are different parameters like Precision, Recall. F-measure, accuracy, the Kappa integer statistic, Incorrectly and Correctly (CI) classified instances, RMSE (Root of Mean square erratum or error) and RRE (Root relative of error). The Mutual information attribute selection is applying with ELM classification and parameters are briefly described below.
a)
Accuracy: It is the total perfection of the standard value and is the result of specification.A
=
𝑇𝑝+𝑇𝑛𝑇𝑝+𝐹𝑝+𝑇𝑛+𝐹𝑛
b)
Precision: It is the calculation and a measurement also show the clearness. The predict as well as actual values are positive.P
=
𝑇𝑝𝑇𝑝+𝐹𝑝
c)
Recall: It was recollection of the intelligent systems and produce optimal solutions.𝑇𝑝
R=
𝑇𝑝+ 𝐹𝑛d)F-Measure: Both recall and precision consider the best test to calculate.
F-Measure=
2
/
(
1/𝑃+
1/𝑅)
e) Detection Rate:
𝑇𝑝
D.R
=
𝑇𝑝+𝐹𝑛𝑇𝑝+ 𝐹𝑛
g) Kappa statistic: It shows the which are near to unity
have more accuracy.
h) Correctly classified Instances: The sum of the diagonal values has been classified into rightly classified instances. It has from directly from confusion matrices. The values for correctly classified should always greater from incorrect classified instances.
i) Incorrectly classified instances: Similarly, they have classified through the sum of diagonal elements from confusion matrices.
j) Root mean square error: It is actually the standard deviation of a prediction and of errors. The frequently used between in difference estimated and the predicted values.
k) Root relative error: It will normalise the total square error and divided so get normalise by square root of prediction.
5.5 Results of algorithms:
5.5.1 Accuracy: And for the accuracy Table 5.1 shows accuracy of SVM
(78.17%), MNB (88.75%), Boosting (90.71%), Hybrid existing (93.33%) and Proposed MI-ELM (95.63%/). Among all these classifiers the proposed technique shows more accuracy 95.63% as shown in table 5.1 Table 5.1 shows group of classifiers with accuracy
Para meter s
SV M
Naï ve Bay es
Boo sting
Hybr id Tech nique
Prop osed MI- EL M Accu
racy 78. 17 %
88. 57 %
90.7 1%
93.33 %
Chart Title
1400 1200 1000 800 600 400 200 0
Correctly Classified Instances
InCorrectly Classified Instances
Fig 5.1 Graphical representation of accuracy
5.5.2 The Correctly and the Incorrectly classified instances: In table 5.2 both have been categorised into two rows and classifiers are in different columns. The values of correctly should always be greater than incorrectly so that it provides
better results.
Table 5.2 Comparison both correctly and incorrectly classified instances
Fig 5.2 Correctly and incorrectly classified instances
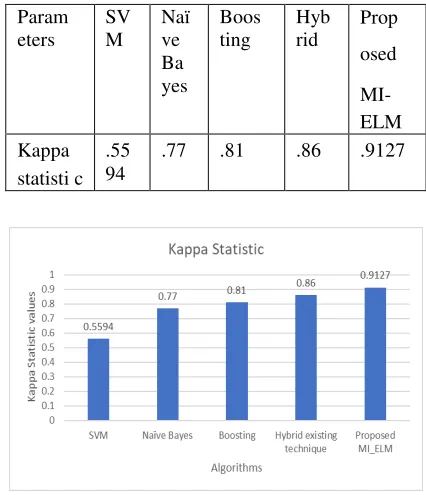
5.3.3 The Kappa Statistic Values (KSV): The value .91 is has more accuracy among the classifiers. Also, the values which are near to shows always much and greater accuracy. In table 5.3 below has shown.
Table 5.3 shows accuracy is maximum by proposed model in table as well as graph
Fig 5.3 Kappa statistic values
Param eters
SV M Naï ve
Ba yes
Boos ting
Hyb
rid Prop osed MI- ELM Correc
tly classif ied instan ces
98 5
111 6
1143 117 6
1205
Incorr ectly classif ied instan ces
27 5
114 117 84 55
Param eters
SV M
Naï ve Ba yes
Boos ting
Hyb rid
Prop osed MI- ELM Kappa
statisti c .55 94
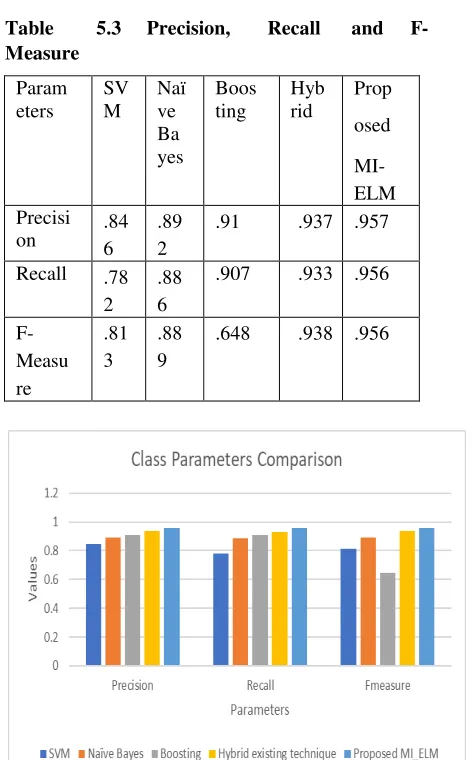
5.3.3 Precision, Recall, F-Measure: In all these three parameters proposed MI-ELM shows more values in every parameter.
Table 5.3 Precision, Recall and F- Measure
Fig 5.4 Graphical representation of Precision, Recall, F-measure
5.4.4 RMSE (Root of Mean square erratum or error) and RRE (Root relative of error): In graph and table 5.1 the proposed technique shows less error rates in comparison to others like SVM, MNB, Boosting and Hybrid technique.
Table 5.4 RMSE and RRE
Param eters
SV M
Naï ve Ba yes
Boos ting
Hyb rid
Prop osed MI- ELM Root
mean square error
.46 .33 .26 .27 .2089
Root relativ e error
93. 45
66. 46
52.9 3
54. 75
41.79 Param
eters
SV M
Naï ve Ba yes
Boos ting
Hyb rid
Prop osed MI- ELM Precisi
on .84 6 .89 2 .91 .937 .957 Recall .78
2
.88 6
.907 .933 .956
F- Measu re
.81 3
.88 9
REFERENCES:
[1] Thaseen S et al. Integrated Intrusion Detection Model Using Chi-Square Feature Selection and Ensemble of Classifiers. Arabian Journal for Science and Engineering 2018, 44(4); 3357-3368.
[2] Kausar N et al. An Approach towards Intrusion Detection using PCA Feature Subsets and SVM. International Conference on Computer & Information Science (ICCIS) lEEE 2012; 978-1-4673- 1938-6/12. [3] Dhanabal L et al. A Study on NSL-KDD Dataset for Intrusion Detection System Based on Classification Algorithms” International Journal of Advanced Research in Computer and Communication Engineering (June 2015) Vol. 4, Issue 6,
[4] Akashdeep et al. A feature reduced intrusion
detection system using ANN classifier Expert Systems with Applications (2017); 88: S249–257
[5] Zainal A et al. Ensemble of One-class Classifiers for Network Intrusion Detection System. IEEE (2008); 978-0-7695-3324-7/08.
[6] Zhang J et al. A Hybrid Network Intrusion Detection Technique Using Random Forests. Proceedings of the First International Conference on Availability, Reliability and Security (ARES’06) IEEE 2006; 0-7695-2567-9/06. [7] Pietraszek T, Tanner A. Data mining and machine learning Towards reducing false positives in intrusion detection. Information Security Technical Report (2005) 10, 169-183.
[8] Mukherjee S, Sharma N. Intrusion Detection using Naive Bayes Classifier with Feature Reduction. Procedia Technology (2012); 4:119 – 128.