Original Research Article
Supportive supervision as an effective intervention in improving water,
sanitation and hygiene facilities in government health
facilities of Tamil Nadu
Sudharshini Subramaniam*, T. S. Selvavinayagam
INTRODUCTION
Water, sanitation and hygiene (WASH) is one of the important components of sustainable development goals without which achieving any of the global health-related goals, including those to reduce maternal mortality and end preventable new born deaths is not possible.1–3 WASH in health care facilities is prioritized as a necessary input to achieve all global and national health goals. The benefits of adequate WASH in Health Care
Facilities (HCF) include reducing health care acquired infections and anti-microbial resistance, improving occupational health and safety leading to quality care service in the facilities.
Despite the fundamental need of WASH for quality health service delivery, access to WASH in HCF is alarmingly poor. A 2015 WHO/UNICEF global report revealed that 38% of HCF had no source of water. Furthermore, the provision of water and soap or
alcohol-ABSTRACT
Background: Water, sanitation and hygiene (WASH) is one of the important components of Sustainable Development Goals which is essential for achieving any global health-related goals. WASH in health care facilities is prioritized as a necessary input to achieve health goals. Supportive Supervision has been established as an effective intervention in improving the performance of health care workers. This paper evaluates the role of supportive supervision in improving WASH facilities in the health care facilities of high priority districts of Tamil Nadu.
Methods: The effectiveness of supportive supervision in improving WASH facilities was assessed through a pre-post experimental research design. World Health Organization proposed steps were followed while planning for the supportive supervision. Supervisory visits were made using checklists in all secondary level public health facilities in 7 High Priority Districts which were chosen based on the preliminary WASH survey conducted by UNICEF. The same health facilities were revisited after 3 months and supervised using the same checklist.
Results: In the first supervisory visit, 41.6% of the health facilities (57 out of 137 facilities) were non- functional in terms of WASH score, while only 5.8% (8 out of 137 facilities) were fully functional. In the second visit, proportion of non- functional facilities had dropped from 41.6% to 7.3% and there has been an increase in the partially functional (52.6% to 71.5%) and fully functional facilities (5.8% to 21.2%) which was found to be statistically significant.
Conclusions: Supportive supervision was able to show a significant improvement in the WASH facilities in all types of facilities.
Keywords: Supportive Supervision, WASH
Institute of Community Medicine, Madras Medical College, Chennai, Tamil Nadu, India
Received: 03 January 2018
Revised: 05 February 2018
Accepted: 06 February 2018
*Correspondence:
Dr. Sudharshini Subramaniam,
E-mail: [email protected]
Copyright: © the author(s), publisher and licensee Medip Academy. This is an open-access article distributed under the terms of the Creative Commons Attribution Non-Commercial License, which permits unrestricted non-commercial use, distribution, and reproduction in any medium, provided the original work is properly cited.
based hand rubs for hand washing was absent in over one third of facilities and almost one fifth of facilities did not have improved sanitation. It was also noted that national planning for WASH in HCF was largely lacking and limited availability of data on WASH coverage in HCFs.4
UNICEF as part of RMNCH+A strategy in 2014 conducted a WASH assessment of 341 Public Health Facilities in 13 health unit districts (HUD) of Tamil Nadu. In the assessment report, the overall WASH index score was good across facilities in all HUDs, except health sub-centers; the major concerns were reported related to sanitation and hygiene. The lack of housekeeping staff as well as the increased flow of patients was reported as major reasons for less sanitation and hygiene across health facilities. Lack of water and sanitation facilities were found high across HSCs. Government of India recommends supportive supervision of health facilities for WASH practice for compliance and provision of Quality care. UNICEF undertake WASH assessment every 3 months in the high priority districts to support the health facilities in taking corrective measures.5
Supervision provides an excellent opportunity to provide follow-up training, improve performance, and solve other systemic problems. The traditional method of supervision was based on the assumption that the subordinate workers are least motivated and therefore required a strong control from outside to boss and keep things in track. Such controlled supervision involved authoritarian approach. Having followed for years, this approach proved itself to be of less benefit to the system rather harmful, thereby warranting an approach which makes the supervisors and health workers work together to solve problems and improve performance. Supportive supervision is one such approach. Supportive supervision is helping to make things work, rather than checking to see what is wrong. Supportive supervision encourages open, two-way communication, and building team approaches that facilitate problem-solving. It focuses on monitoring performance towards goals, and using data for decision-making, and depends upon regular follow-up with staff to ensure that new tasks are being implemented correctly.6–8 There are mounting evidence supporting the role of supportive supervision in improving the health care especially in improving immunization services and family planning services.9–13 It has also been established as an effective intervention in improving the performance of health care workers.6,14–18 This study evaluates the role of supportive supervision in improving the WASH facilities in the HCF of high priority districts of Tamil Nadu.
METHODS
The effectiveness of supportive supervision in improving WASH facilities was assessed through a pre-post experimental research design. World Health Organization has proposed the following steps to undertaken for a supportive supervision.7
Setting up a supportive supervision system
Planning regular supportive supervision visits
Conducting a supervisory visit
Follow up activities
These steps were followed while planning for the supportive supervision.
Setting up a supportive supervision system
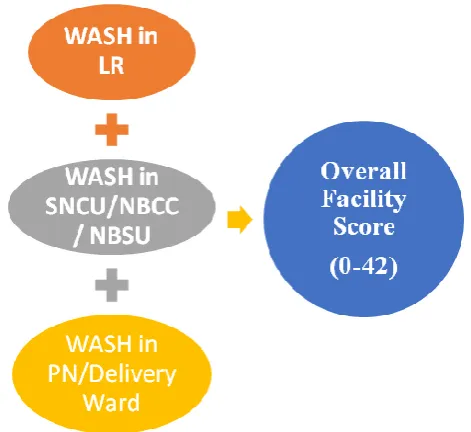
A supportive supervision system was set up by creating supportive supervisors, supervisory checklist and ensuring adequate resources were available for conducting visits. Medical post-graduates from Institute of Community medicine, Madras Medical College, were trained for doing a supportive supervision using the WASH Supervisory Checklist by one day training by UNICEF consultant. The supervisors were also given hands on training on using WASH supervisory checklist at the Rural Health Training Centre by UNICEF Consultant. Twenty-one Post Graduates students underwent the training. WASH supervisory checklist consist of 3 components – Labour ward, New Born Care Corner/ Special New Born Care Unit/ New Born Stabilization Unit and post-natal ward as shown in Figure 1. In each component, hand washing facilities and practice, toilet facilities, waste segregation and overall cleanliness of the facility was assessed. Score was given to each question. Based on scores, each facility was classified as non-functional (0-18), partially functional (19-33), fully functional (34-42).
Figure 1: Scoring pattern of WASH index.
Planning regular supportive supervision visits
During this step it was decided on where and when the supervisory visit is to be made. It was decided by UNICEF consultants to do supervisory visits in all secondary level public health facilities in z7 High Priority Districts. These 7 high priority districts were chosen based on the preliminary WASH survey conducted in 13 Health Unit districts (HUD) of Tamil Nadu by UNICEF during the year 2014. Among the 13 HUDs, 7 HUDs were identified as high priority districts (HPD) by Government of India, Ministry of Health & Family Welfare. The 7 HPDs are Krishnagiri, Madurai, Vellore, Tiruchirappalli, Tirunelveli, Tiruvannamalai and Virudunagar. These districts had been selected based on key indicators from the national child survival score card, health management information system data on maternal, infant, neonatal, and Under five mortality, performance
of key antenatal, intra-partum and post natal, family planning and adolescent health and nutrition services for maternal and child health (MCH) care and presence of blocks with hard to reach areas, most vulnerable populations and pockets of multiple deprivation in terms of access, coverage of services and quality of services.
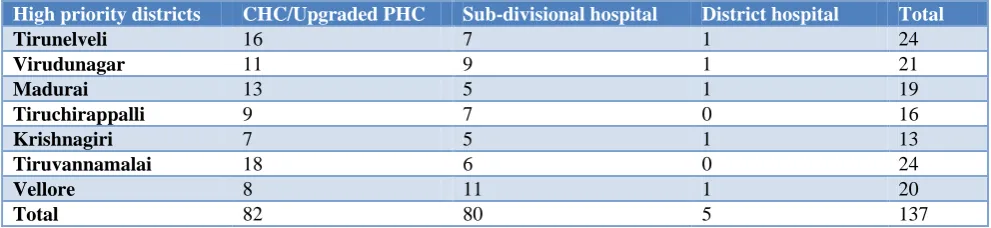
Based on the Government of India recommendation it was decided by UNICEF to conduct supervisory visits every 3 months. A group of 3 supervisors were made as a district team, who visited all the facilities allotted to them in their respective districts for assessment using the check list. It was planned in such a way that not more than 2 health facilities are visited by a supervisor per day and the visits was scheduled for a period of 8 days to cover 137 facilities. District wise split up of facilities covered is shown in Table 1.
Table 1: Facilities covered in supportive supervisory visits – district wise.
High priority districts CHC/Upgraded PHC Sub-divisional hospital District hospital Total
Tirunelveli 16 7 1 24
Virudunagar 11 9 1 21
Madurai 13 5 1 19
Tiruchirappalli 9 7 0 16
Krishnagiri 7 5 1 13
Tiruvannamalai 18 6 0 24
Vellore 8 11 1 20
Total 82 80 5 137
Conducting a supervisory visit
During the supervisory visit to the facility, the supervisor collected necessary information using the checklist, on-site training was also given if any deviation was observed. The results were recorded and communicated to the facility personnel. During the second visit, the recommendations of the first visit were also looked upon.
Follow-up activities
The findings of the supervision were then communicated to Project Director of Tamil Nadu National Health Mission, Joint Director of Health Services, Deputy Director of Health Services of the respective HUD. The overall score of each facility and the component wise break-up of the scores were reported. The communication of the findings led to a meeting among the stakeholders, which in turn capacitated the necessary corrective measures to be taken. All the stakeholders were also informed of the next supervisory visit.
Study period
The first supervisory visit was conducted in the month of August, 2016. The same health facilities were revisited after 3 months (December, 2016) and supervised using
the same checklist. The findings of the 2nd visit were also communicated to the respective facilities and DDHS of the respective HUD.
The assessment data from the facility’s checklist were entered electronically and then compiled district wise, Type of Facility and for HPD wise for each of the components using Excel sheets and SPSS16.
RESULTS
Totally 137 facilities were visited in the 7 HPDs. All these facilities were delivery points. Of the 137 facilities visited, 82 were community health centres, 5 district hospitals and the rest were sub –divisional hospitals. The first supervisory visit was done in the month of August, 2016. It is evident from Figure 2, that 41.6% of the health facilities (57 out of 137 facilities) were non-functional in terms of WASH score, while only 5.8% (8 out of 137 facilities)were fully functional in the first supervisory visit. In the same figure, it is evident that on the 2nd supervisory visit which was done 3 months later, 7.3% facilities were non-functional, 71.5% were partially functional and 21.2% were fully functional.
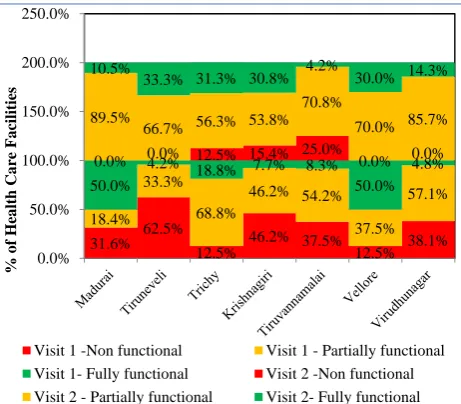
performing better in comparison with other districts in terms of being fully functional. Tirunelveli followed by Krishnagiri district had the highest number of non-functional facilities in the 1st visit. However, in the 2nd supervisory visit there were no facilities which were non-functional in Madurai, Tirunelveli, Vellore and Virudunagar. In the other 3 districts, the percentage of facilities with non-functional status was lesser compared to 1st visit except in Tiruchirappalli which maintained status quo.
Figure 2: Functional status of the health facilities- in two supervisory visits.
Figure 3: Functional status of the health facilities- district wise in two supervisory visits.
The WASH level of the facilities depending on the type of health facilities showed that District hospitals had zero non-functional facilities even in the first visit, while there was 42.6% and 40% of the CHCs and Sub-divisional hospital in non-functional status (Figure 4). There was a significant reduction in the proportion of CHCs and sub-divisional hospitals with non- functional status to 8.6% and 6% respectively. It is also evident that proportion of CHCs, sub district hospitals, district hospitals with fully functional status improved to 21%, 50%, 18% respectively.
Figure 4: WASH functional status– type of health care facility wise in 2 supervisory visit.
From Table 2, it is evident that there has been an improvement in the WASH scores of the facilities, non- functional facilities had dropped from 41.6% to 7.3% and there has been an increase in the facilities which had become partially functional (52.6% to 71.5%)and fully functional (5.8% to 21.2%). This was found to statistically significant (p value -<0.001, McNemar test).
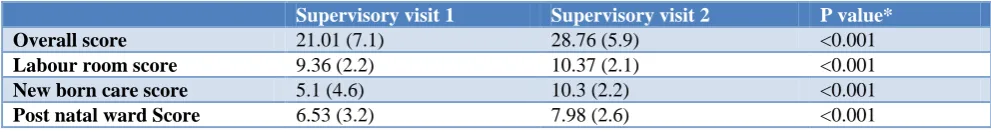
Table 3 depicts the overall and individual component mean (SD) score, based on assessment of all the facilities. Also, on comparison of the scores of both visits, it is evident that there was a significant improvement in the overall WASH score as well as that of the individual component score.
Table 2: Comparison of functional status of facilities between two supervisory visits.
Functional status
Supervisory visit 2
Total (%) Non functional (%) Partially functional (%) Fully functional (%) Supervisory visit 1
Non functional 7 (12.3) 42 (73.7) 8 (14) 57 (41.6) Partially functional 3 (4.2) 53 (73.6) 16 (22.2) 72 (52.6) Fully functional 0 (0) 3 (37.5) 5 (62.5) 8 (5.8)
Total 10(7.3%) 98 (71.5) 29 (21.2) 137
McNemar test – 50.695, p value - <0.001. 41.6
7.3 52.6
71.5
5.8 21.2
0 10 20 30 40 50 60 70 80
visit 1 visit 2
% o f H CF Supervisory visit
non functional partially functional fully functional
31.6% 62.5%
12.5% 46.2% 37.5% 12.5% 38.1% 18.4%
33.3%
68.8%
46.2% 54.2%
37.5% 57.1% 50.0% 4.2% 18.8% 7.7% 8.3% 50.0%
4.8% 0.0% 0.0% 12.5% 15.4% 25.0% 0.0% 0.0% 89.5%
66.7% 56.3% 53.8% 70.8%
70.0% 85.7% 10.5%
33.3% 31.3% 30.8% 4.2% 30.0% 14.3%
0.0% 50.0% 100.0% 150.0% 200.0% 250.0% % o f H ea lth Ca re F a cilities
Visit 1 -Non functional Visit 1 - Partially functional Visit 1- Fully functional Visit 2 -Non functional Visit 2 - Partially functional Visit 2- Fully functional
42%
8.60% 0% 0%
40% 6% 51.90% 70.40% 67% 50% 54% 76% 6.20% 21% 33.30% 50% 6% 18% 0% 10% 20% 30% 40% 50% 60% 70% 80% 90% 100%
visit 1 visit 2 visit 1 visit 2 visit 1 visit 2
CHC District hospital Sub divisional hospiatal % o f H ea lth Ca re F a cilities
Type of HCF
Table 3: Comparison of component wise WASH score
Supervisory visit 1 Supervisory visit 2 P value*
Overall score 21.01 (7.1) 28.76 (5.9) <0.001
Labour room score 9.36 (2.2) 10.37 (2.1) <0.001
New born care score 5.1 (4.6) 10.3 (2.2) <0.001
Post natal ward Score 6.53 (3.2) 7.98 (2.6) <0.001
Statistical test – paired t test.
DISCUSSION
It is evident from the results that there was a significant improvement in the WASH functional status of the HCF between the 2 supervisory visits. There was a significant reduction in the proportion of facilities with non-functional status from 41.6% to 7.3%. Similarly, there was a significant increase in the proportion of facilities which were partially functional from 52.6% to 71.5% and from 5.8% to 21.2% in the fully functional status between the two supervisory visits. The improvement was observed in all the 7 HPDs. Tirunelveli showed the maximum reduction in the proportion of non-functional facilities between the two visits.
The improvement is also evident in terms of the overall mean score from 21.01 to 28.76 between the visits. The component wise score revealed that there was a significant improvement in all the 3 components. There was a maximum improvement in the score in the new born care. At the 2nd visit the least mean score was observed in Post-natal ward. One reason for the maximum improvement in the new born ward is due to a decision change in the scoring pattern between the 2 supervisory visits. In the 1st visit, scoring was given only if there was a separate WASH facilities for the new born care corner even if it was located within the labour ward. Based on the input from the supervisors, it was decided to give a score depending on the WASH facilities of the labour ward, if the new born care corner was located within the labour ward. The WASH facilities in the post natal ward was least in either visits, suggesting that least attention is given to these wards, thereby posing both the mother and child to high risk of getting an infection and subsequently leading to increased morbidity and mortality in either group.
District hospitals had better WASH facility compared to CHCs and sub divisional hospitals in both the visits. This is very similar to the findings of WHO/UNICEF country profile which also showed the difference in WASH facilities depending on the type of health facility.4 However, there was a significant improvement in both CHCs and sub-divisional hospitals after the supportive supervision, which indicates the potential of improvement in these facilities.
The importance of WASH facilities in HCF is well established. Cleanliness of HCF is one of the important criteria for improving the quality of care in health care
facilities.19 Studies have suggested that health facilities with poor WASH score had high maternal mortality ratio.2 On the other hand improvement in the WASH facilities in the health care centres has a significant impact in the reduction of sepsis and neonatal mortality rate. Tamil Nadu has made impressive gains in terms of maternal mortality and neonatal mortality.3 The Maternal mortality ratio of Tamil Nadu as per the SRS 2013 is 79/1 lakh population.20 Sepsis contributes to at least 17% of the maternal mortality.21 Similarly sepsis contributes to 20% of neonatal mortality.22 With innovative strategies like Muthulakshmi Reddy Maternity Benefit scheme – a conditional cash benefit transfer scheme, there has been a tremendous improvement in the institutional deliveries. Therefore, it becomes a responsibility of the public health system to provide clean services to the mothers attending the facilities.
Government of India having recognised the importance of the cleanliness in health care facilities, has released “Swachatha Guidelines” as a promotion of Swatch Bharath Abhiyan.23 Kayakalp initiative is an award giving initiative for recognising the public health facilities which are putting efforts in improving the cleanliness of their facilities. One of the criteria for application for Kayakalp award includes supervision and feedback. The reason for giving undue importance to cleanliness is not only for aesthetic reasons, but also because of its impact on the health of the people utilising the services of these facilities.24 Kayakalp uses appreciation and recognition as the mode of improving WASH facilities in HCFs. While this is an efficient strategy, it requires a lot of self -motivation and commitment from the health care workers, as it is considered as a choice. Supportive supervision supersedes this disadvantage.
and the management indicators.14 Supportive supervision also showed a three- to sevenfold improvement in the services provided by the sexually transmitted infection (STI) clinics in India over a period of 45 months.26
The checklist used as the supervisory tool was an enabling factor in specifically identifying the problem and thereby was useful in conveying the findings to the different authorities at different levels. This helped in targeting and focusing on the problem. The benefit of adopting a methodical supervision using checklist has been established in various studies. in practice of primary health treatment guidelines in Nepal and diarrhoea management in Nigeria.17,27 In Philippines, the use of a supervisory tool improved indicators in a primary health facility by 42 per cent in the experimental group compared with 18% in control group.27
Factors which facilitated supportive supervision
The supportive supervisors were neutral third party, which acted as a facilitator as the facility members were not scared of any punitive actions and also took the visit by supervisors as an opportunity to tell their demands and grievances to improve the facility. Overall there was a desire among all the stakeholders at all levels to improve their facilities, which acted as an important facilitator to bring changes in their own facility. The availability of adequate fund made the process of supportive supervision hassle free.
Factors which act as inhibitors in supportive supervision
Supportive supervision requires adequate planning and budget. In the absence of such funding, sustenance of the program becomes a problem. To address this, in the program implementation plan itself, a separate budget should be allotted for the purpose of supportive supervision.
Limitations
The personal bias of the supervisors constitutes a limitation of the intervention, however this has been tried to reduce by hands on training and demonstration for the supervisors, so that uniformity is maintained. The impact of supportive supervision on WASH is studied after a short period of observation. The long-term impact and sustainability is not studied.
Recommendation
The long term impact of the supportive supervision should be established. The other challenging factors which would impede sustainable supportive supervision process are to be addressed. Supervision of a large number of facilities scattered across a larger area is more challenging. One of the ways by which this could be addressed is to include supportive supervision as a
separate strategy in the planning of any programme and separate budget should be allocated for the same.
CONCLUSION
Supportive supervision as per the steps given by WHO has a definite effect in improving the WASH facilities in the government health sector. Identification of the specific problem helps in focussing on it and thereby getting a positive solution. However, such an effort on long term basis could be resource intensive and time consuming, which needs to be addressed.
ACKNOWLEDGEMENTS
The authors sincerely acknowledge the Post Graduates of Institute of Community Medicine, Madras Medical College, who were the supportive supervisors of the Health Care facilities. The authors sincerely acknowledge Dr. Kaleeswaran, Post Graduate, Institute of Community Medicine, Madras Medical College for his support in collating the data. Authors also thank Dr. Vijayaprasad Gopichandran, Assistant Professor, Department of Community Medicine, ESI Medical College, K.K.Nagar, Chennai for providing inputs in the previous version of the manuscript.
Funding: The Supportive Supervisory visits were funded by UNICEF. Supervisory Checklist was prepared by UNICEF and supervisors were given one day training by UNICEF consultant. Otherwise UNICEF did not play any role in collection of data, interpretation and in writing the manuscript
Conflict of interest: None declared
Ethical approval: The study was approved by the Institutional Ethics Committee
REFERENCES
1. United Nations. Clean Water and Sanitation: Why It Matters. 2016. Available at: http://www.un.org/ sustainabledevelopment/wp-content/uploads/2016/ 08/6_Why-it-Matters_Sanitation_2p.pdf. Accessed on 16 August 2017.
2. Benova L, Cumming O, Campbell OMR. Systematic review and meta-analysis: association between water and sanitation environment and maternal mortality. Trop Med Int Health. 2014;19(4):368–87.
3. Blencowe H, Cousens S, Mullany LC, Lee AC, Kerber K, Wall S, et al. Clean birth and postnatal care practices to reduce neonatal deaths from sepsis and tetanus: a systematic review and Delphi estimation of mortality effect. BMC Public Health. 2011;11(Suppl 3):S11.
5. World Health Organization (WHO). Water and Sanitation for Health Facility Improvement Tool (WASH FIT) A practical guide for improving quality of care through water, sanitation and hygiene in health care facilities. 2017. Available at: http://apps.who.int/iris/bitstream/10665/254910/1/9 789241511698-eng.pdf?ua=1. Accessed on 16 August 2017.
6. Crigler L, Gergen J, Perry H. Supervision of Community Health Workers. 2013.
7. World Health Organization. Training for mid-level managers (MLM) 4. Supportive supervision. 2008;(Mlm):1–34; Module 4.
8. Children’s Vaccine Program at PATH. Guidelines for Implementing Supportive Supervision: A step-by-step guide with tools to support immunization. 2003;
9. Djibuti M, Gotsadze G, Zoidze A, Mataradze G, Esmail LC, Kohler J. The role of supportive supervision on immunization program outcome - a randomized field trial from Georgia. BMC Int Health Human Rights. 2009;9(Suppl 1):S11. 10. RAISE. Guidelines for implementing supportive
supervision for family planning and post- abortion care services in crisis settings. 2012.
11. Ryman T, MacAuley R, Nshimirimana D, Taylor P, Shimp L, Wilkins K. Reaching every district (RED) approach to strengthen routine immunization services: Evaluation in the African region, 2005. J Public Health. 2010;32(1):18–25.
12. Suh S, Moreira P, Ly M. Improving quality of reproductive health care in Senegal through formative supervision: results from four districts. Human Resources for Health. 2007;5(1):26. 13. Som M, Panda B, Pati S, Nallala S, Anasuya A,
Chauhan AS, et al. Effect of supportive supervision on routine immunization service delivery-a randomized post-test study in Odisha. Global J Health Sci. 2014;6(6):61–7.
14. Ameha A, Karim AM, Erbo A, Ashenafi A, Hailu M, Hailu B, et al. Effectiveness of supportive supervision on the consistency of integrated community cases management skills of the health extension workers in 113 districts of Ethiopia. Ethiopian Med J. 2014;52 Suppl 3:65–71.
15. Frimpong JA, Helleringer S, Awoonor-Williams JK, Yeji F, Phillips JF. Does supervision improve health worker productivity? Evidence from the Upper East Region of Ghana. Tropical Medicine and International Health. 2011;16(10):1225–33. 16. McAuliffe E, Daly M, Kamwendo F, Masanja H,
Sidat M, de Pinho H. The Critical Role of Supervision in Retaining Staff in Obstetric Services: A Three Country Study. PLoS ONE. 2013;8(3):1. 17. Hernández AR, Hurtig A-K, Dahlblom K, San
Sebastián M. More than a checklist: a realist evaluation of supervision of mid-level health
workers in rural Guatemala. BMC Health Services Res. 2014;14:112.
18. Vasan A, Mabey DC, Chaudhri S, Brown Epstein H-A, Lawn SD. Support and performance improvement for primary health care workers in low- and middle-income countries: a scoping review of intervention design and methods. Health Policy and Planning. 2016;2016:czw144.
19. World Health Organization. Standards for improving quality of maternal and newborn care in health facilities. 2016;73. Available at: http://apps.who.int/iris/bitstream/10665/249155/1/9 789241511216-eng.pdf Accessed on 18 August 2017.
20. SRS. Maternal Mortality Ratio (MMR), Maternal Mortality Rate and Life Time Risk; India, EAG & Assam, South and Other states. Census of India. 2013: 1–2. Available at: http://www.censusindia. gov.in/vital_statistics/mmr_bulletin_2011-13.pdf. Accessed on 16 August 2017.
21. Montgomery AL, Ram U, Kumar R, Jha P. Maternal Mortality in India: Causes and Healthcare Service Use Based on a Nationally Representative Survey for The Million Death Study. 2014;9(1):1-11. 22. Sankar M, Neogi S, Sharma J, Chauhan M,
Srivastava R, Prabhakar P, et al. State of newborn health in India. Journal of Perinatology. 2016;36:S3-S8.
23. Ministry of Health and Family Welfare Govt of India. Swachhta Guidelines for Public Health Facilities. New Delhi; 2015.
24. Ministry of Health and Family Welfare Govt of India. Table of Contents. Vol. 43. New Delhi; 2015 May. Available at: http://linkinghub.elsevier.com/ retrieve/pii/S0196655315001984 Accessed on 3 April 2017.
25. Mohan P, Kishore B, Singh S, Bahl R, Puri A, Kumar R. Assessment of implementation of integrated management of neonatal and childhood illness in India. J Health, Population Nutrition. 2011;29(6):629–38.
26. Mogasale V, Wi TC, Das A, Kane S, Singh AK, George B, et al. Quality assurance and quality improvement using supportive supervision in a large-scale STI intervention with sex workers, men who have sex with men/transgenders and injecting-drug users in India. Sexually Transmitted Infections. 2010;86(Suppl 1):i83–8.
27. Ross MW, Williams ML. Effective targeted and community HIV/STD prevention programs. J Sex Res. 2002;39(1):58–62.